
tools spotlight

-
EUR/USD: It Takes Time to Chop Down a Tree
April 9, 2021, 9:36 AMThere are many important indicators strongly suggesting that the EUR/USD should be lower, but despite that, the currency pair is stubborn. What’s happening?
Germany, France, and now Spain have all lowered their growth estimates. Europe is lagging behind the U.S. in economic performance, printing money like crazy, and Covid-related restrictions are tightening. Still, the EUR/USD won’t budge, and gold is enjoying this delayed action. But the EUR/USD will have to face the music eventually, and when that happens (and it will), gold will no longer be singing in tune (for the medium-term).
Before looking at the EUR/USD, let’s first examine how gold, miners and the USD Index are faring.
In yesterday’s (Apr. 8) analysis, I put the following in bold:
Please keep in mind that since gold might reverse today, it could rally a bit first – this would not be bullish, but relatively normal.
Here’s what happened in gold yesterday:
And here’s what’s happening in today’s pre-market trading:
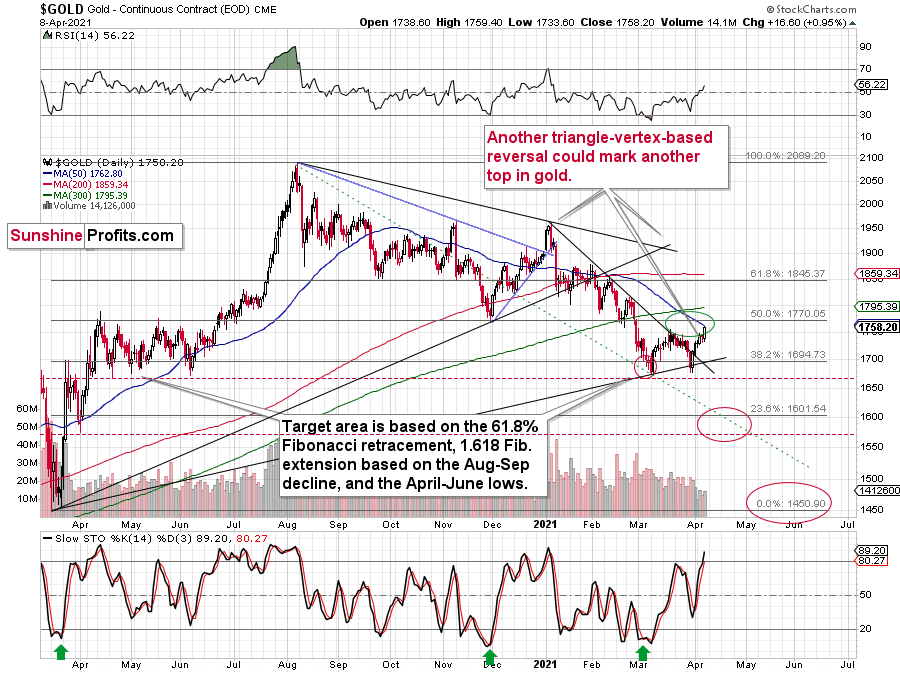
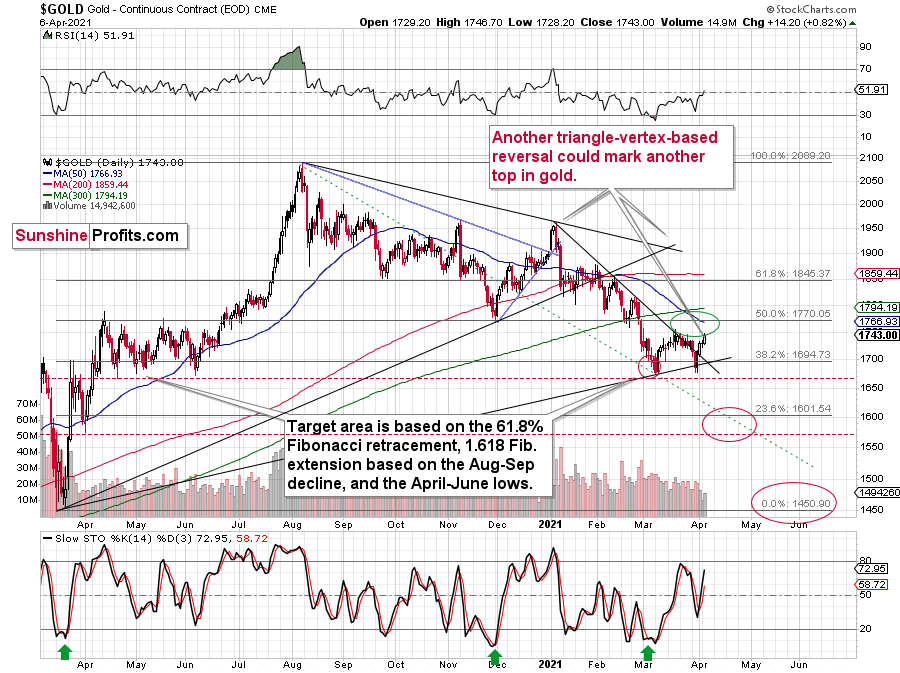
Simply put, gold rallied yesterday, and it seems to have topped right at its triangle-vertex-based reversal.
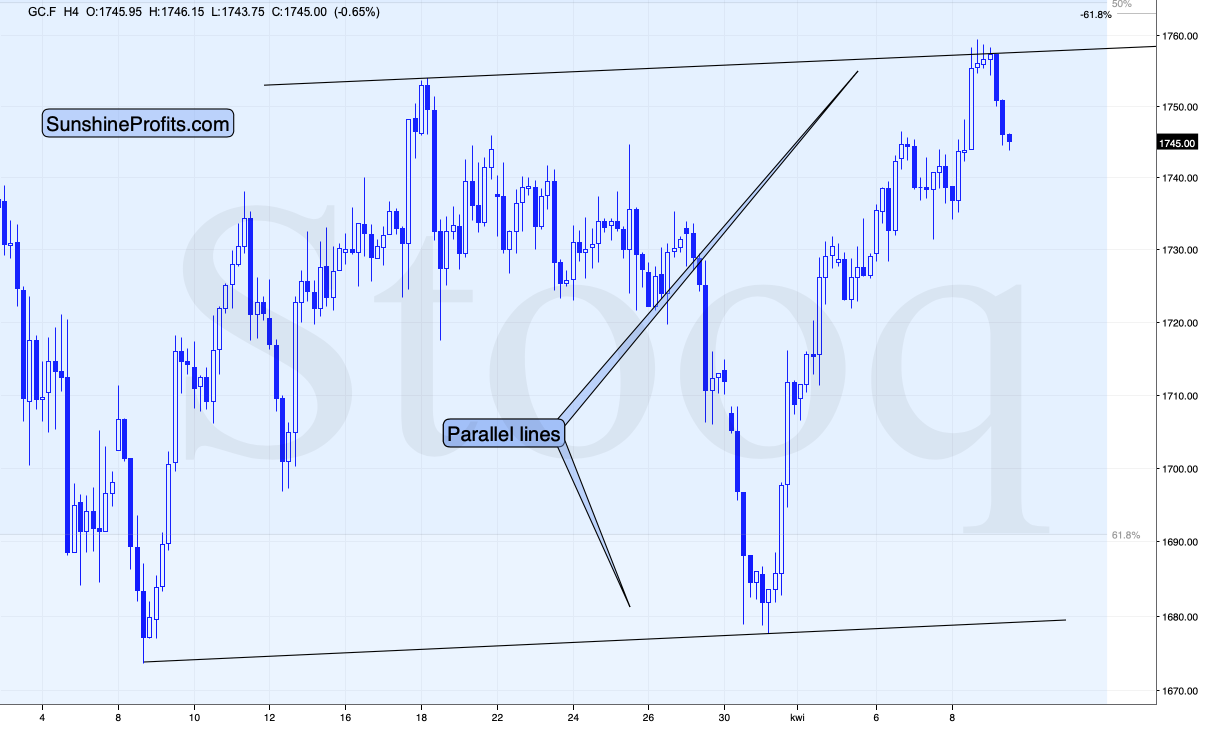
Moreover, gold has not only topped at the reversal point, but it also seems to have topped at the line that’s parallel to the line connecting two previous short-term bottoms. This means that the recent monthly rally was a near-perfect zigzag (a.k.a. ABC) correction – the most classic way in which a flag formation can form.
The moves that follow such continuous patterns tend to be similar to the moves that preceded them. In this case, the move that preceded the zigzag pattern was the January – March decline, during which gold fell by more than $150. Repeating this kind of move would mean a decline in gold to about $1,600. This would be in perfect tune with what I wrote previously about gold’s likely interim downside target.
The Miners
What about other gold stocks – did they confirm the top as well?
Yes, although the confirmation wasn’t particularly clear.
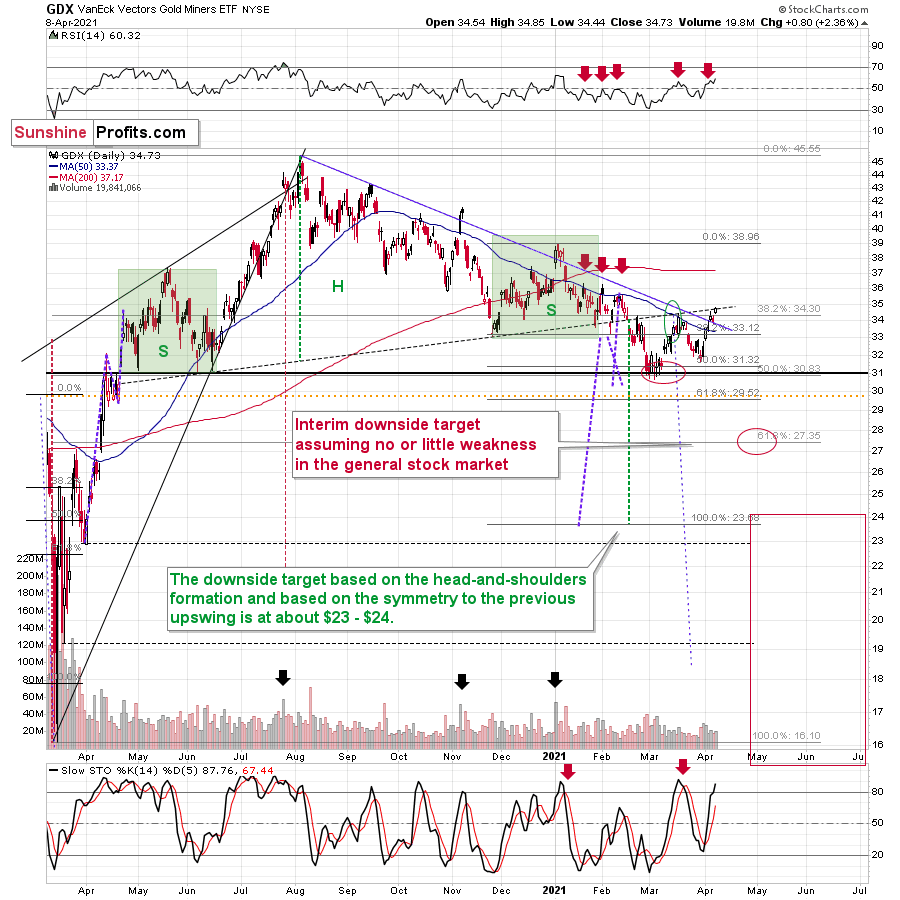
The GDX ETF didn’t soar yesterday, but rather moved higher at a moderate pace. It moved visibly above the declining blue resistance line, but it stopped at the neck level of the previously completed broad head-and-shoulders pattern. This is a strong resistance that already worked once (in mid-March), so it’s quite likely that reaching it marked the end of the short-term correction.
USD Index
And the USD Index?
It declined a bit more than seemed likely based on the 1:1 analogy to how much it declined back in 2018, but the deviation from this analogy is not big enough to say that the link is broken – far from it.
I previously wrote the following with regard to the short-term bottoming target for the U.S. currency:
What we saw yesterday definitely qualifies as a small correction. In fact, even if it was doubled it would still be small. And – more importantly – it would be in perfect tune with what happened in 2018 during the big rally.
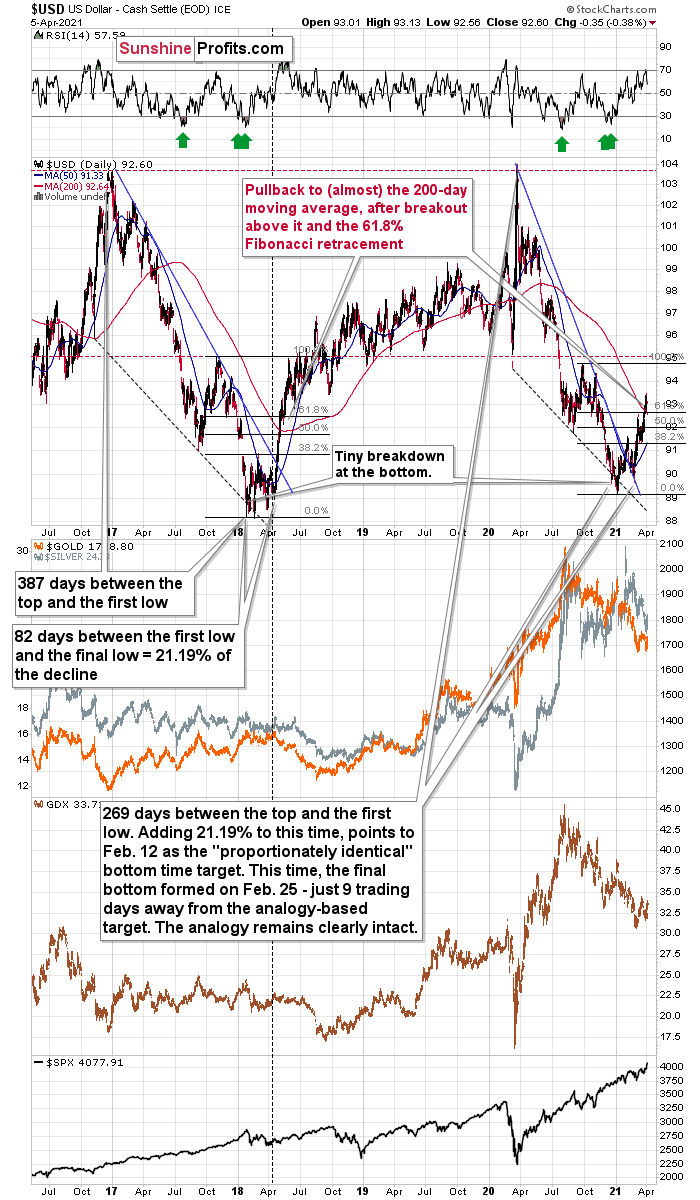
After rallying visibly above the:
- 93 level
- 200-day moving average
- 61.8% Fibonacci retracement level based on the final part of the decline
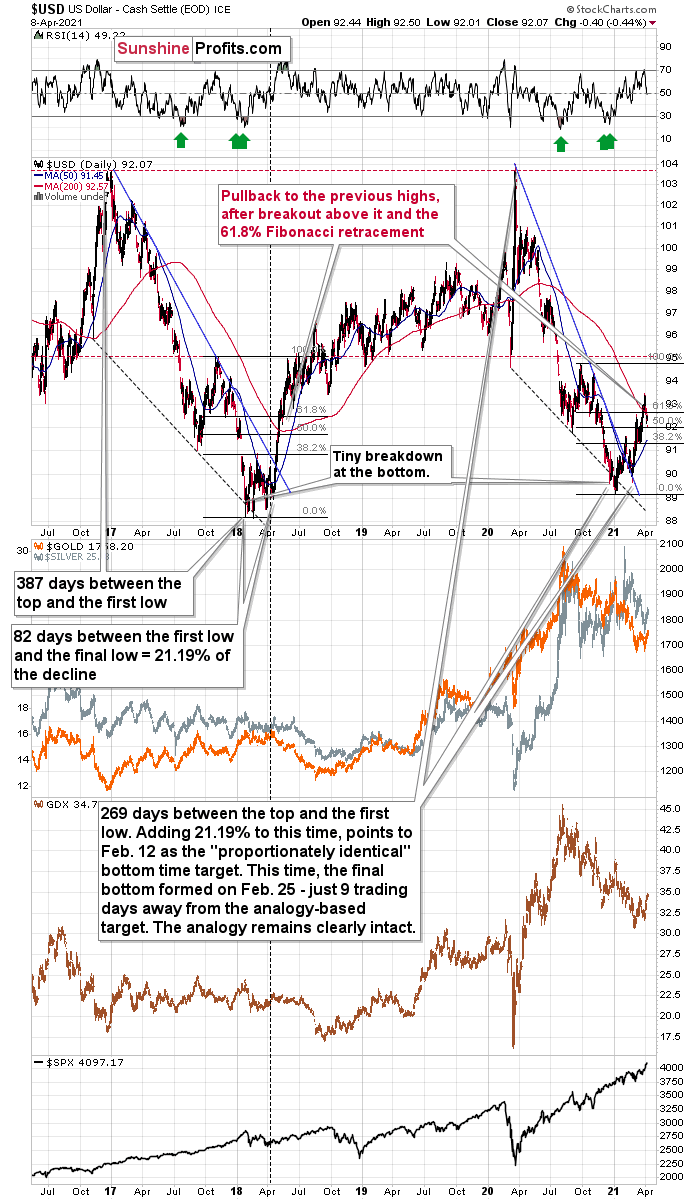
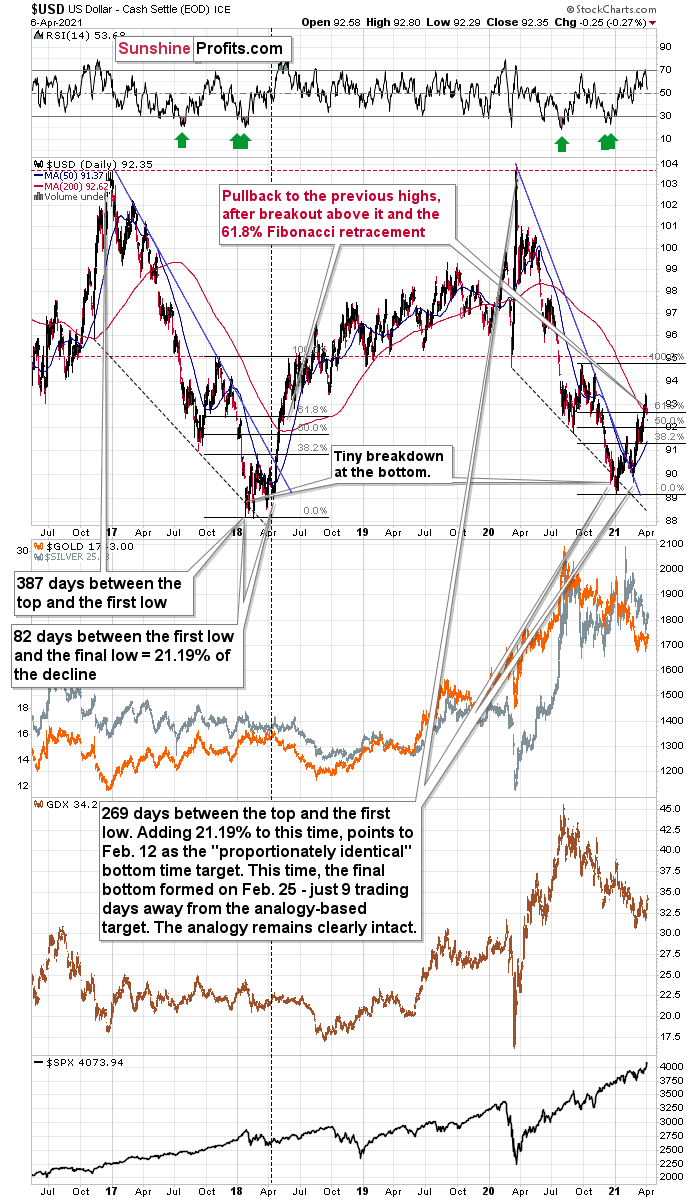
the USD Index moved back below the 93 level. This happened in May 2018 and it happened last week.
Since both rallies are so similar, it’s nothing odd that we see a pullback in a similar situation.
Back in 2018, the pullback was small and quick. It ended without the USD Index reaching its 200-day moving average. The pullback ended when the USDX moved approximately to its previous high and slightly below the 61.8% Fibonacci retracement.
Applying this to the current situation (previous high at about 92.5, the 61.8% Fibonacci retracement at about 92.7, and the 200-day moving average at 92.66), it seems that the USD Index would be likely to find its bottom in the 92.3 – 92.7 area.
Yesterday’s close at 92.07 and today’s pre-market move above 92.3 suggest that the bottom might have been formed just a little below the lower border of the above-mentioned target area. Since the history doesn’t necessarily repeat itself to the letter, but it often rhymes, the two situations – the current and the 2018 rallies – continue to be similar and the implications continue to be bullish. This, in turn, is bearish for the precious metals prices – at least in the next several weeks.
All in all, gold and mining stocks seem to have reversed, while the USD Index seems to have bottomed or is quite close to bottoming. As gold and miners decline, the same is likely to be the case with silver.
Having said that, let’s take a look at the market from a more fundamental angle.
The More Things Change, The More They Stay the Same
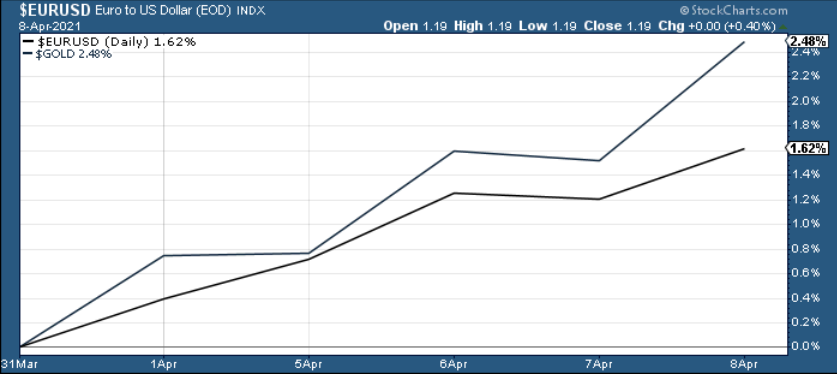
With gold hitching its carriage to the EUR/USD’s horse, the latter’s recent strength has enabled a smooth ride for the yellow metal. Case in point: since Apr. 1, the two have clearly enjoyed each other’s company.
However, in ironic fashion, three important developments have occurred along the journey.
- Germany (Europe’s largest economy) had its 2021 GDP growth estimate reduced from 3.5% to 3.35%
- France (Europe’s second-largest economy) had its 2021 GDP growth estimate reduced from 6% to 5%.
And the third?
Well, on Apr. 8, Spain’s Economy Minister Nadia Calvino told Bloomberg that Europe’s fourth-largest economy will also reduce its 2021 GDP growth estimate.
Please see below:
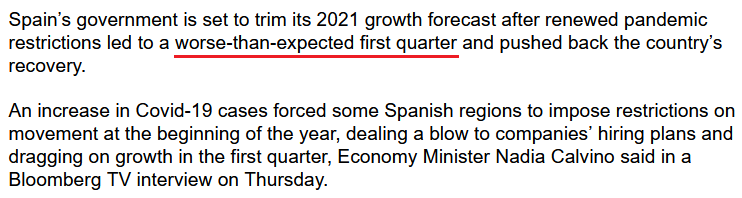 Source: Bloomberg
And as the dominoes continue to fall, also on Apr. 8, The Independent Authority for Fiscal Responsibility (AIReF) – an agency that oversees the sustainability of Spain’s public finances – reduced its 2021 GDP growth estimate from 8.2% to 6.6%.
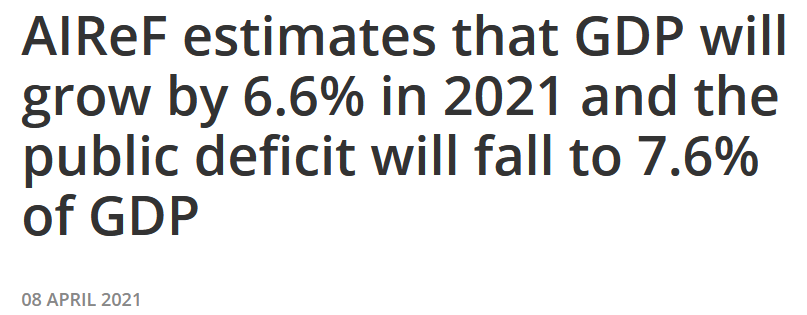 Source: AIReF
But hey, who cares about GDP growth, right?
If that wasn’t enough, Klaas Knot, a member of the European Central Bank (ECB) Governing Council, told CNBC on Apr. 8 that “we don’t want the run-up in bond yields to prematurely tighten our financing conditions.”
Translation? Last week’s €343 billion expansion of the ECB’s balance sheet – the largest since June 2020 – was likely not a one-off event. Why so? Because Knot hinted at this himself.
Please see below:
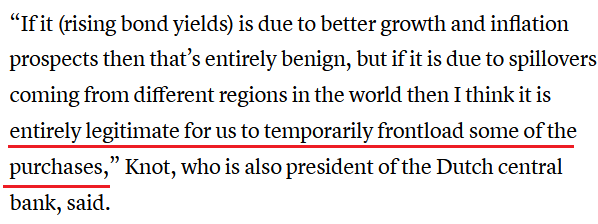 Source: CNBC
And why all of the concern?
Well, because the Eurozone economy remains on ice. Case in point: a German constitutional court recently blocked the EU’s €750 billion recovery plan (Europe’s version of COVID-19 fiscal stimulus). And because the plan requires full support, The European Commission can’t raise the funds unless all EU member states agree. And with only 22 of the 27 EU nations on board, it could be months until the funds reach the real economy (if ever).
But in the meantime, French Finance Minister Bruno Le Maire told Bloomberg on Apr. 7 that the recovery plan is “not on the right track” and that he’s “deeply concerned.”
“We are in April 2021, and once again I have not seen any single penny,” he said.
And why is Le Maire so concerned?
Because his country is in lockdown as Europe struggles to control the coronavirus pandemic. Take a look at IHS Markit’s France Construction PMI (released on Apr. 8): in what passes for good news these days, “a further decline in French construction activity” gave way to “positive expectations” because the contraction was the softest in nine months.
However, notice the caveat at the end of Eliot Kerr’s comments?
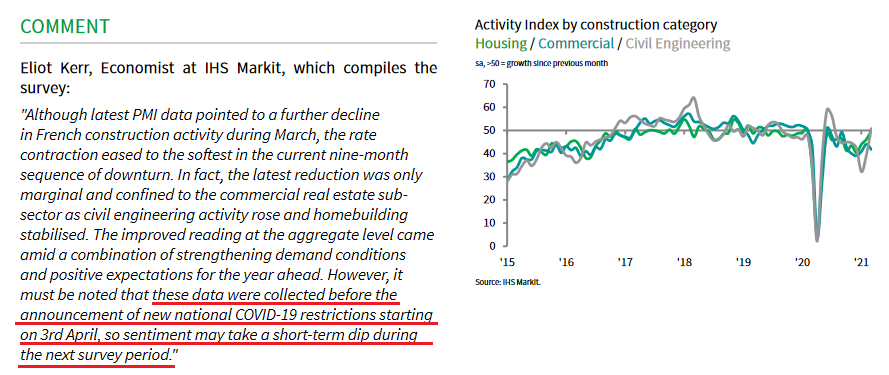
That’s right: before the recent lockdown.
Moreover, IHS Markit’s Eurozone Productivity PMI (also released on Apr. 8) showed that efficiency remains sluggish in France.
Please see below:
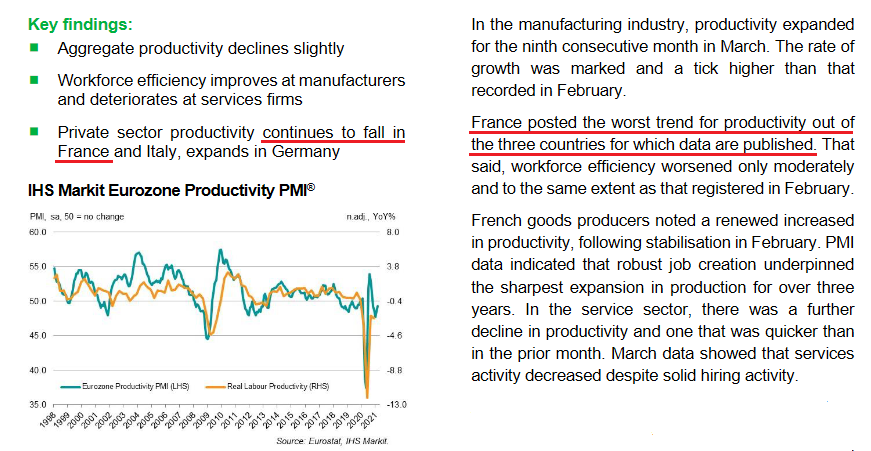
Furthermore, despite improving moderately in March, France is easily the worst performer of the major Eurozone economies.
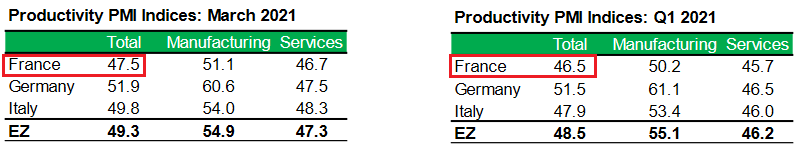 Source: IHS Markit
For context, PMI (Purchasing Managers’ Index) data is compiled through a monthly survey of executives within industries that are integral to regional economic performance. A PMI above 50 indicates business conditions are expanding, while a PMI below 50 indicates that business conditions are contracting.
Keep in mind though: since the data was weak before France went into lockdown, the virus surge will likely quash any and all momentum.
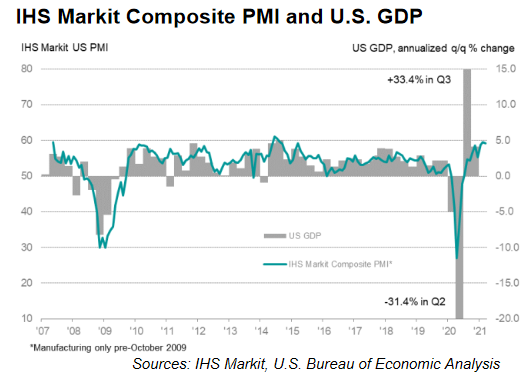
Furthermore, while IHS Markit’s Eurozone Composite PMI (released on Apr. 7) hit 53.2 (service sector still in contraction at 49.6), overall Eurozone activity still lags behind the U.S.
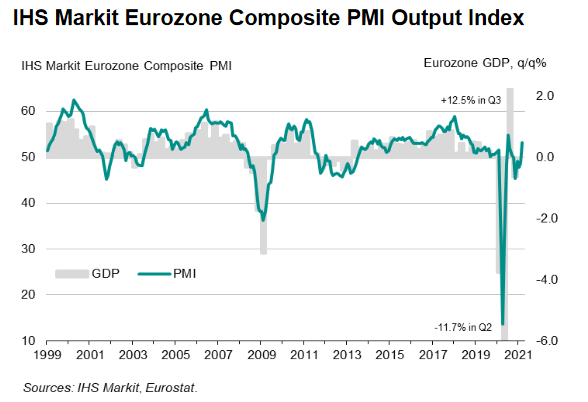
As an apples-to-apples comparison, IHS Markit’s U.S. Composite PMI (released on Mar. 24), stood at 59.1, while service sector activity jumped to 60.0.
Please see below:
And with fiscal stimulus left to the German courts and the fundamental risks rising, as mentioned, the ECB will be forced to pick up the slack. If you analyze the chart below, you can see that the ECB’s monthly PEPP purchases in March were the highest since November. And because currencies trade on a relative basis, relative outprinting by the ECB is fundamentally bearish for the EUR/USD.
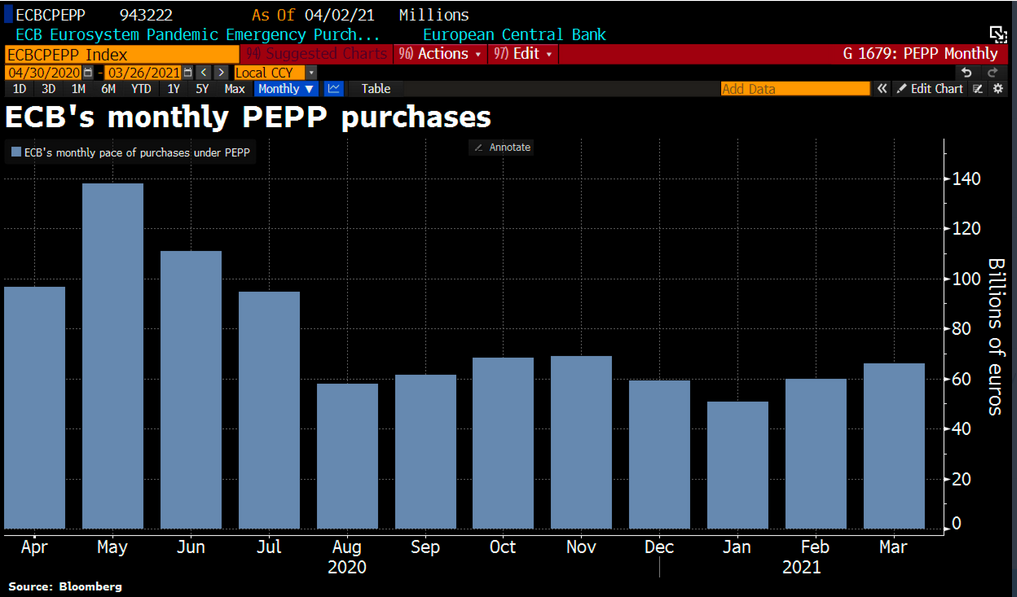
To that point, Reuters hinted that the ECB has no plans of slowing down.
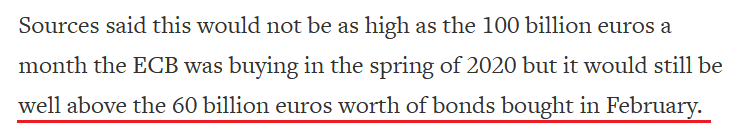 Source: Reuters
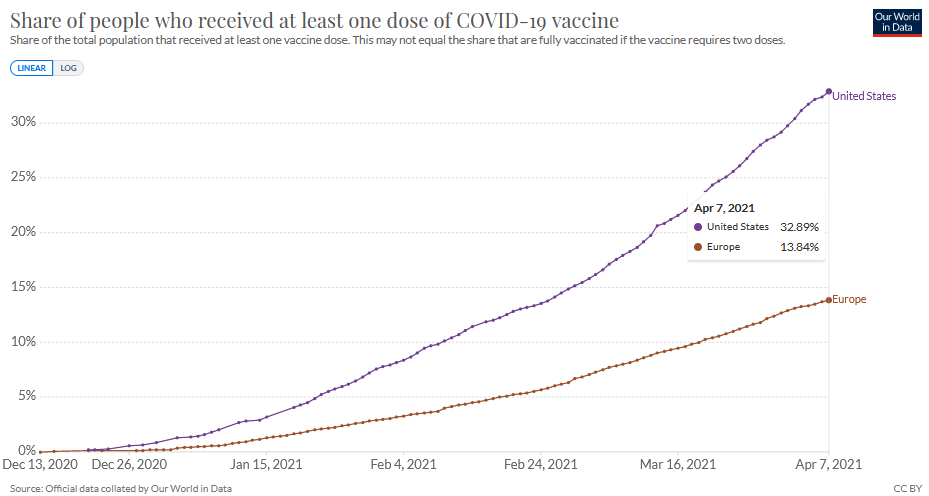
Adding to the list of laggards, Europe has made little progress in its vaccine rollout. On Mar. 31, the U.S.-Eurozone spread between the share of people who have received at least one dose of a COVID-19 vaccine was 16.53%. However, on Apr. 7, the spread increased to 19.05%.
So let’s review:
Relative to the United States:
- The economic outlook is worse in Europe
- The money printer is working overtime in Europe
- The virus spread is worse in Europe
- The vaccine rollout is much slower in Europe
Thus, should the above developments coincide with a stronger euro?
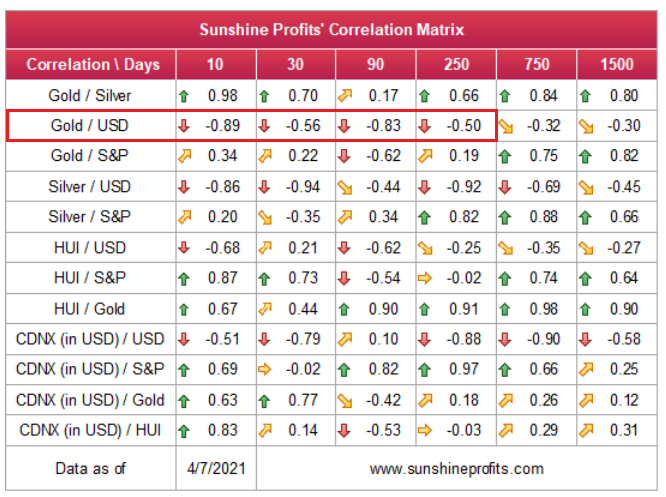
Either way, once the EUR/USD decides to reflect these realities, a move lower will propel the USD Index higher. And because gold has a strong negative correlation with the U.S. dollar, the falling dominoes are profoundly bearish for the yellow metal.
And seemingly front-running the action, gold’s strongest supporters have now become its largest detractors. Case in point: gold-backed ETFs have suffered massive outflows in recent months, with total assets declining to their lowest level since May 2020.
Please see below:
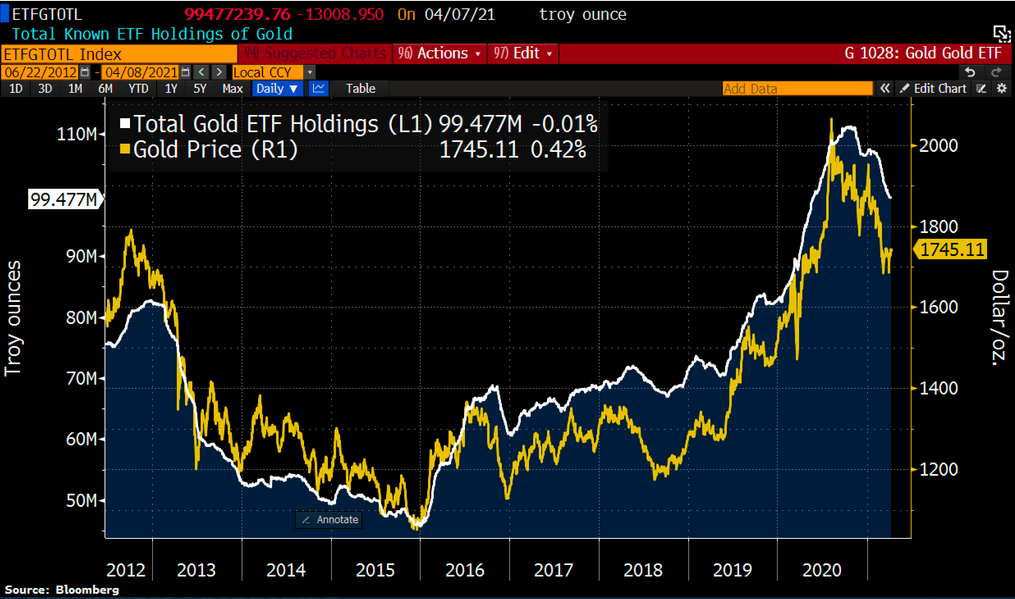
To explain, the yellow line above tracks the gold price, while the white line above tracks the total assets of gold-backed ETFs. For context, gold-backed ETF holdings have declined in four of the last five months and the only comparable example is the massive drawdown that we witnessed in 2012-2013. More importantly though, if you analyze the middle of the chart, you can see that even as gold rallied on Apr. 8, gold-backed ETFs still suffered outflows, with total holdings declining by 0.01%.
In conclusion, up is down, down is up and the EUR/USD continues to follow in equities’ footsteps. Thus, for now, despite the myriad of fundamental indicators supporting a lower EUR/USD, the currency pair wants what it wants. However, after displaying this same behavior in December 2020, before rolling over, fundamentals are akin to chopping down a tree with an axe: it takes several swings to bring down the evergreen. And because gold’s recent strength is likely to fade with the EUR/USD, the medium-term weather forecast still signals cloudy skies ahead.
Thank you for reading our free analysis today. Please note that the above is just a small fraction of the full analyses that our subscribers enjoy on a regular basis. They include multiple premium details such as the interim targets for gold and mining stocks that could be reached in the next few weeks. We invite you to subscribe now and read today’s issue right away.
Sincerely,
Przemyslaw Radomski, CFA
Founder, Editor-in-chief -
Mining Stocks: A House Built on Shaky Ground
April 8, 2021, 9:46 AMIt’s tempting to say that miners are showing strength compared to gold based on the GDX’s performance, but other mining proxies say otherwise.
Just because a house is standing doesn't mean its foundations are solid, and that's exactly the case with the miners.
There’s one extra thing that I would like to point out about mining stocks’ technical picture today (Apr. 8), and that’s their performance relative to gold.
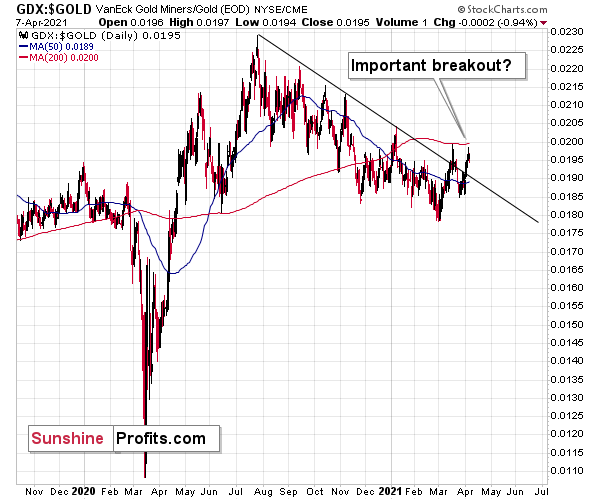
Some investors might say that mining stocks are showing strength compared to gold as the GDX to gold ratio broke above its declining resistance line.
However, I don’t think it’s fair to say so. I think that seeing a breakout in the GDX to gold ratio is not enough for one to say that the miners to gold ratio is breaking higher.
After all, the GDX ETF is just one proxy for mining stocks, and if miners were really showing strength here, one should also see it in the case of other proxies for the mining stocks when compared to gold.
For instance, the HUI Index to gold ratio, the XAU Index to gold ratio, and the GDXJ (junior mining stocks) to gold ratio.
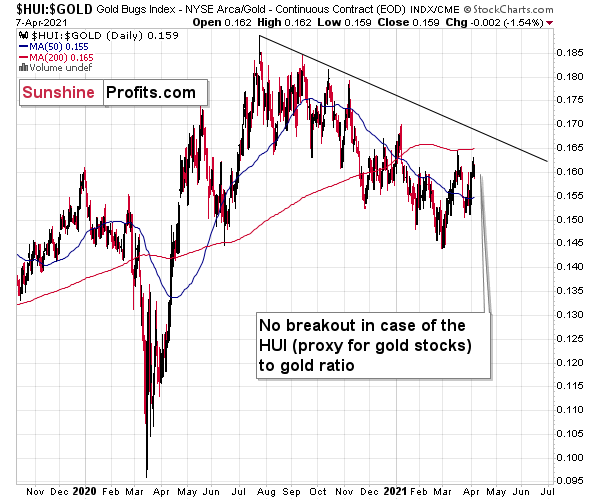
There is no breakout in the HUI to gold ratio whatsoever. In fact, the ratio is quite far from its declining resistance line. Even if we chose other late-2020 tops to draw this line, there would still be no breakout.
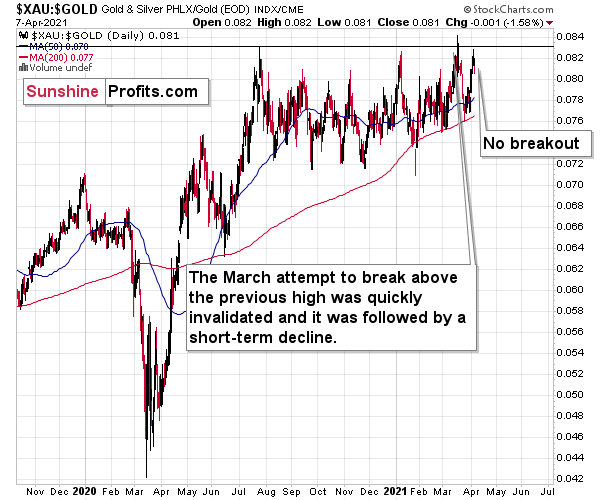
There is no breakout in the XAU to gold ratio either. The previous attempts for the XAU to gold ratio to rally above their 2020 high marked great shorting opportunities, which is very far from being a bullish implication.
But the most bearish implication comes from gold’s ratio with another ETF – the GDXJ.
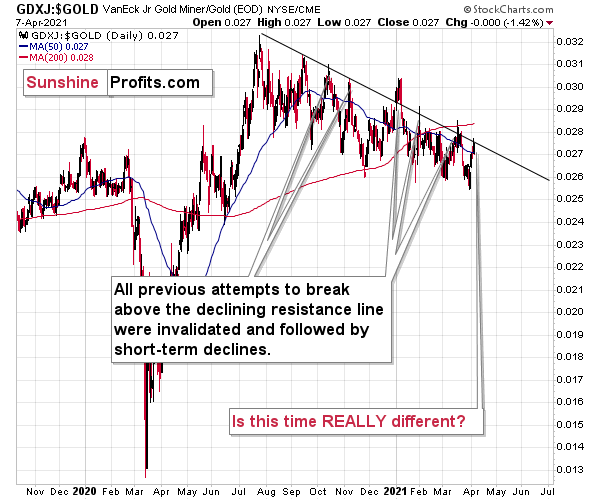
The GDXJ to gold ratio actually provides a sell signal, as the tiny breakout above the declining resistance line was already invalidated.
Five out of five previous attempts to break above the declining resistance line failed and were followed by short-term declines. Is this time really different?
It seems to me that the five out of five efficiency in the GDXJ to gold ratio is more important than a single breakout in the GDX to gold ratio, especially considering that it was preceded by a similar breakout in mid-March. That breakout failed and was followed by declines.
Taking all four proxies into account, it seems that the implications are rather neutral to bearish. Especially when taking into account another major ratio - the one between HUI and S&P 500 is after a major, confirmed breakdown.
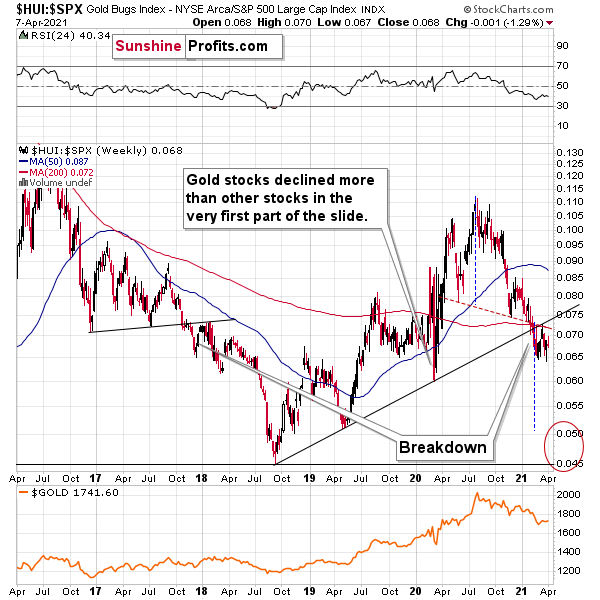
All in all, the implications of mining stocks’ relative performance to gold and the general stock market are currently bearish.
Thank you for reading our free analysis today. Please note that the above is just a small fraction of the full analyses that our subscribers enjoy on a regular basis. They include multiple premium details such as the interim targets for gold and mining stocks that could be reached in the next few weeks. We invite you to subscribe now and read today’s issue right away.
Sincerely,
Przemyslaw Radomski, CFA
Founder, Editor-in-chief -
Will the Guillotine Drop On Gold this Week?
April 7, 2021, 9:14 AMTwo things appear to be on the chopping block for this week, or are close to being so. The first is the USDX’s corrective downswing, and the second being gold’s short-term rally.
And that can only mean that the precious metals are looking at negative headwinds for the medium-term. How low can the yellow metal go? It may be hard to believe, but is anything below $1500 even possible?
In yesterday’s flagship Gold & Silver Trading Alert, I emphasized that the next short-term top in the precious metals market is likely to be formed this week, most likely on Wednesday or Thursday. The basis for this forecast was the triangle-vertex-based reversal in gold as well as USD’s correction that appears to be analogous to its 2018 correction that was followed by another powerful rally.
In short, the above expectation (and reasoning behind it) remains up-to-date. Let’s start today’s discussion with a look at the USD Index.
USD’s Corrective Downswing is Over
On Friday (Apr. 2), I wrote the following:
What we saw yesterday definitely qualifies as a small correction. In fact, even if it was doubled it would still be small. And – more importantly – it would be in perfect tune with what happened in 2018 during the big rally.
After rallying visibly above the:
- 93 level
- 200-day moving average
- 61.8% Fibonacci retracement level based on the final part of the decline
the USD Index moved back below the 93 level. This happened in May 2018 and it happened last week.
Since both rallies are so similar, it’s nothing odd that we see a pullback in a similar situation.
Back in 2018, the pullback was small and quick. It ended without the USD Index reaching its 200-day moving average. The pullback ended when the USDX moved approximately to its previous high and slightly below the 61.8% Fibonacci retracement.
Applying this to the current situation (previous high at about 92.5, the 61.8% Fibonacci retracement at about 92.7, and the 200-day moving average at 92.66), it seems that the USD Index would be likely to find its bottom in the 92.3 – 92.7 area.
The early-March high was 92.53 in intraday terms, and it was 92.33 in terms of the closing prices. The USD Index moved briefly to 92.29 yesterday (Apr. 6), but it ended the day at 92.35. This means that it moved back to the previous high in terms of the daily closing prices. It also moved below the 61.8% Fibonacci retracement. Consequently, what happened yesterday (and its consequences on the precious metals market) were relatively normal – they didn’t change the outlook.
Unfortunately, unlike the case in early March, this counter-trend rally wasn’t likely enough to happen for us to temporarily switch to a long position. Theoretically, everyone knows that it’s impossible to catch each and every move and correction, and it’s pointless to expect oneself and others to be able to pinpoint each and every move. On the other hand, I realize that it’s unpleasant and disappointing to see such a correction unfold without changing the outlook, so the preferred action is to simply wait while the market moves temporarily against one. It’s difficult, but let’s keep in mind that it’s the kind of “difficult” that every investor and trader chooses when they decide to invest or trade at all – there’s no way to eliminate these “unwelcome” periods in their entirety. What one can do is to focus on the outlook, on proper position size management and on patience in exercising the actions (or lack thereof) that stem from both the above.
Fortunately, it seems that the corrective downswing in the USD Index is over or almost over now. This – along with the triangle-vertex-based reversal in gold – suggests that the rally in the PMs is over as well, or close to being so.
Gold’s Short-Term Rally is Over
About to meet its maker, the Grim Reaper could surprise the yellow metal this week. With the guillotine likely to drop either today (Apr. 7) or tomorrow (Apr. 8), gold is on a collision course with its triangle-vertex-based reversal point. The chart points to it being “in between” of those two days, so it’s likely to be on either of them or in their close proximity, effectively meaning this week. Moreover, given the yellow metal’s inability to capitalize on the USD Index’s misfortune, the former could already be a dead man walking.
We now know that there is indeed some kind of corrective upswing right now, but the upside target remains exactly as it was previously – we could have seen the top already today, or gold might move slightly higher before topping. The ~$1,770 level seems to be the maximum short-term upside target.
Also, please note that it seems that gold is moving in a way that’s somewhat similar to what we saw between mid-April 2020 and mid-June 2020. It’s trading sideways below $1,800 but above ~$1,660. Back in 2020, the range of the back-and-forth movement (size of the short-term rallies and declines) was bigger, but the preceding move was also more volatile, so it’s normal to expect smaller short-term volatility this year (at least at during this consolidation).
Why is this particularly interesting? Because both consolidations (the mid-April 2020 – mid-June 2020 one and the March 2021 – today one) could be the shoulders of a broad head-and-shoulders pattern, where the mid-June 2020 – early-March 2021 performance would be the head. The breakdown below the neck level – at about $1,660 – would be extremely bearish in this case, because the downside target based on the pattern is created based on the size of the head. The target based on this broad pattern would be at about $1,350.
Is this level possible? It is. When gold soared above $2,000, almost nobody thought that it would decline back below its 2011 highs (well, you – my subscribers – did know that). Gold below $1,500 seems unthinkable now, but with rallying long-term rates and soaring USD Index, it could really happen.
I would also like to add that gold moved higher yesterday on volume that was relatively low. The size of the move and the low volume make this action similar to what we saw in early February 2021 – just another relatively small corrective upswing.
Thank you for reading our free analysis today. Please note that the above is just a small fraction of the full analyses that our subscribers enjoy on a regular basis. They include multiple premium details such as the interim targets for gold and mining stocks that could be reached in the next few weeks. We invite you to subscribe now and read today’s issue right away.
Sincerely,
Przemyslaw Radomski, CFA
Founder, Editor-in-chief -
Ladies and Gentlemen, Mr. Dollar is Back
April 6, 2021, 10:07 AMPreviously dismissed, the USDX may now be back with a vengeance. Sentiment is swinging away from shorts and there is an uncanny historical pattern.
With a potential bearish pattern already broken, the USDX is resuming its journey northward. And why is it geared to do well? Is it because the U.S. economy is ripping head? Definitely not - that’s not happening. It’s rather because other regions (think Europe and Japan) are doing even worse.
The dollar’s imminent rise doesn’t mean that gold can’t still experience some very short-term upswing, but for the medium-term, the precious metals continue to face bearish headwinds.
With the greenback laying back and enjoying a well-deserved Easter vacation, gold, silver and the gold miners avoided a dollar-drama for at least another day. However, with the USD Index working to regain its supremacy, along with investors’ respect, the ‘death of the dollar’ narrative has quietly dissipated from the investing zeitgeist.
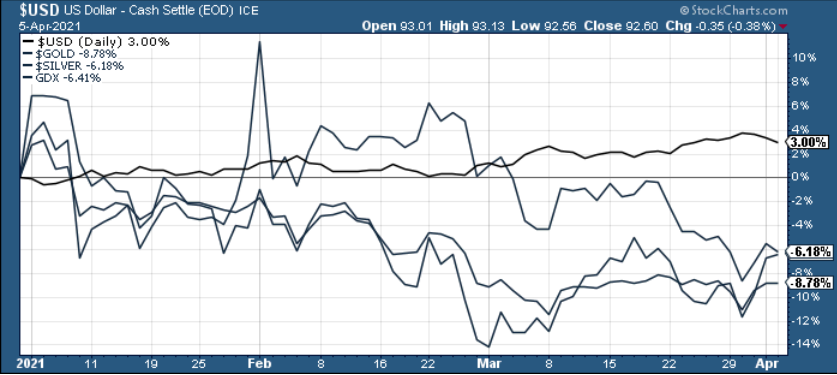
Case in point: the USD Index has broken above its monthly declining resistance line and has already made four new highs since the New Year. More importantly though, because the precious metals have a strong negative correlation with the U.S. dollar, the upward momentum has coincided with an 8.78% drawdown of gold, a 6.18% drawdown of silver and a 6.41% drawdown of the GDX ETF.
Please see below:
And showing no signs of slowing down, with a well-rested USD Index itching to get back to work, we could see ‘business as usual’ in the coming days. On Apr. 2, I warned that a short-term correction could usher the USD Index back to its March high.
That’s exactly what happened yesterday (Apr. 5).
However, with the corrective culmination approaching the finish line, the USD Index remains poised to resume its uptrend.
Adding to the optimism, the tide has already gone out on a sea full of USD Index shorts. And because Warren Buffett once said that “only when the tide goes out do you discover who's been swimming naked,” highly leveraged speculators could be the next to follow.
Please see below:
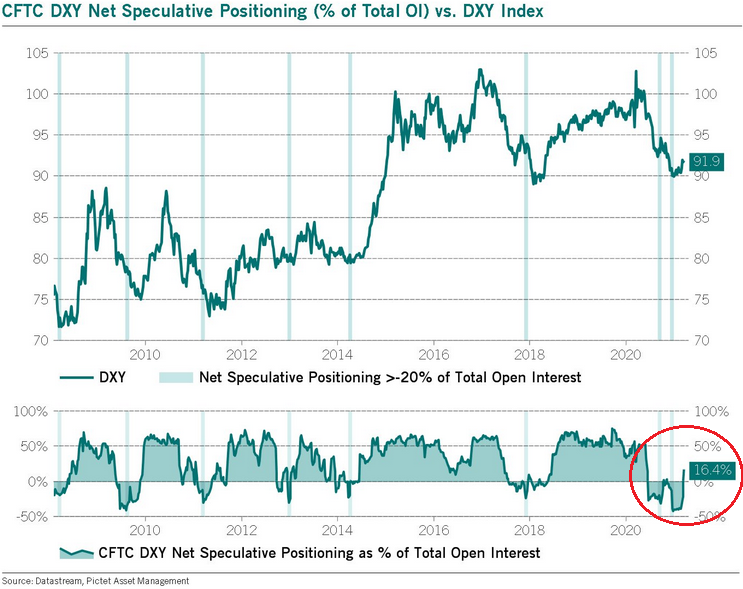
To explain, notice how oversold periods in 2014 and 2018 – where net-speculative short interest as a percentage of total open interest (based on the CoT data) was extremely high – preceded sharp rallies in the USD Index? Thus, with 2021 the most extreme on record, the forthcoming rally should be significant.
How significant? Well, let’s take a look at how things developed in the past – after all, history tends to rhyme.
Wayback Playback
Let’s focus on what happened when the net speculative positions were significantly (!) negative and then they became significantly (!) positive, so without paying attention to tiny moves (like the one that we saw last summer), let’s focus on the more meaningful ones (like the one that we see right now – the net positions just became visibly positive – over 16%, after being very negative for quite some time.
In short, that’s how the following profound rallies started:
- The big 2008 rally (over 16 index points)
- The big 2009 – 2010 rally (over 14 index points)
- The 2011 – 2012 rally (over 11 index points)
- The 2013 rally (“only” over 5 index points)
- The big 2014 – 2015 rally (over 20 index points)
- The 2018 rally (over 15 index points)
The current rally started at about 89, so if the “normal” (the above shows what is the normal course of action) happens, the USD Index is likely to rally to at least 94, but since the 5-index point rally seems to be the data outlier, it might be better to base the target on the remaining 5 cases. Consequently, one could expect the USD Index to rally by at least 11 – 20 index points, based on the net speculative positions alone. This means the upside target area of about 105 – 114.
Consequently, a comeback to the 2020 highs is not only very likely, but also the conservative scenario.
Moreover, let’s keep in mind that the very bullish analogy to the 2018 rally remains intact. Please see below:
To explain, I wrote on Friday (Apr. 2):
What we saw yesterday definitely qualifies as a small correction. In fact, even if it was doubled it would still be small. And – more importantly – it would be in perfect tune with what happened in 2018 during the big rally.
After rallying visibly above the:
- 93 level
- 200-day moving average
- 61.8% Fibonacci retracement level based on the final part of the decline
the USD Index moved back below the 93 level. This happened in May 2018 and it happened last week.
Since both rallies are so similar, it’s nothing odd that we see a pullback in a similar situation.
Back in 2018, the pullback was small and quick. It ended without the USD Index reaching its 200-day moving average. The pullback ended when the USDX moved approximately to its previous high and slightly below the 61.8% Fibonacci retracement.
Applying this to the current situation (previous high at about 92.5, the 61.8% Fibonacci retracement at about 92.7, and the 200-day moving average at 92.66), it seems that the USD Index would be likely to find its bottom in the 92.3 – 92.7 area.
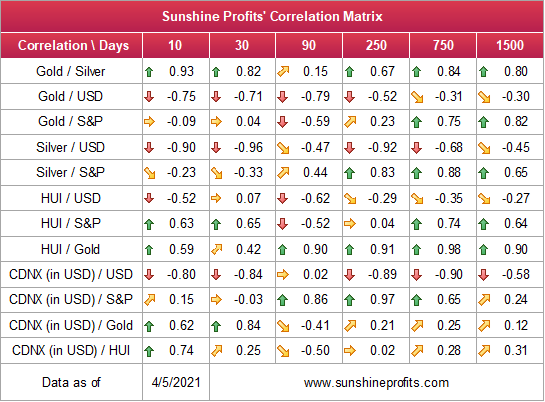
Because of this, the outlook remains profoundly bearish for the gold, silver, and mining stocks over the medium term (even though the next few days are relatively unclear, especially due to gold’s triangle-vertex based reversal that’s due this week). If you analyze the table below, you can see that the precious metals tend to move inversely to the U.S. dollar.
The 2017-2018 Analogue
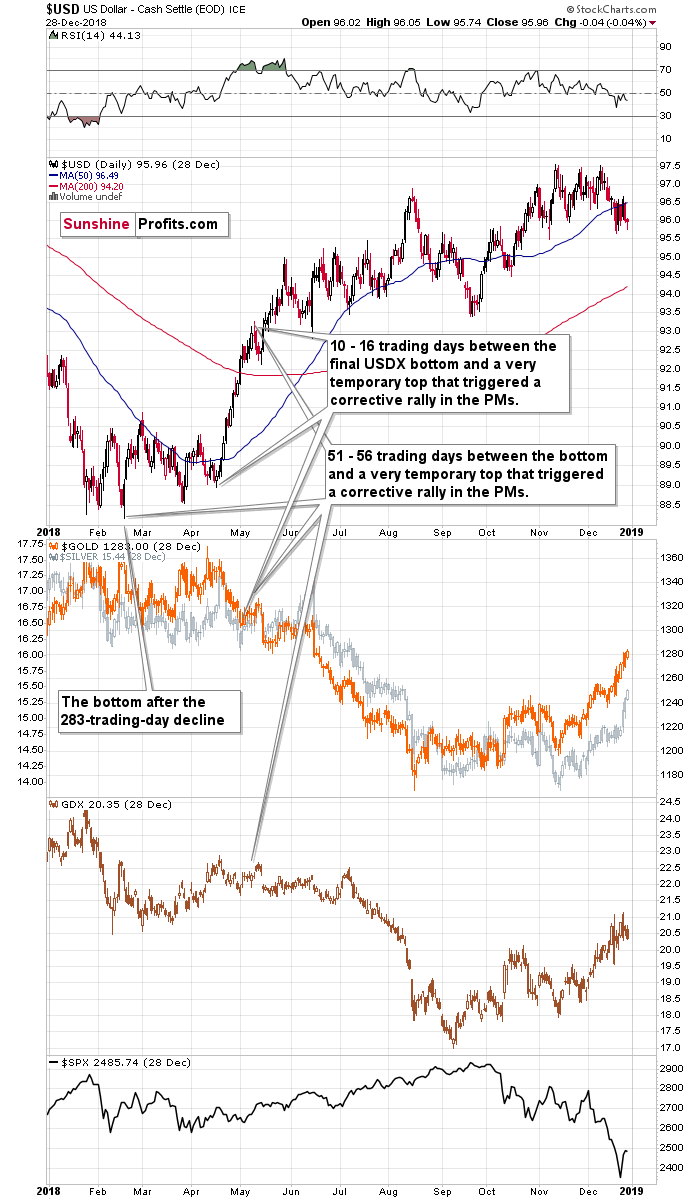
But as the most important development affecting the precious metals, the USD Index’s 2017-2018 analogue is already unfolding before our eyes. With this version likely to be titled ‘The Resurgence: Part 2,’ while history often rhymes, it’s rare for it to rhyme with this level of specificity. For context, in 2018, the USD Index’s breakout above its 50-day moving average is exactly what added gasoline to the USDX’s 2018 fire. And after the 2018 breakout, the USDX surged back to its previous high. Today, that level is 94.5.
Even more ominous for the precious metals, when the USD Index turned a short-term decline into consolidation in mid-2018, can you guess what happened next? Well, the USD Index moved significantly higher, while gold moved significantly lower.
Please see below:
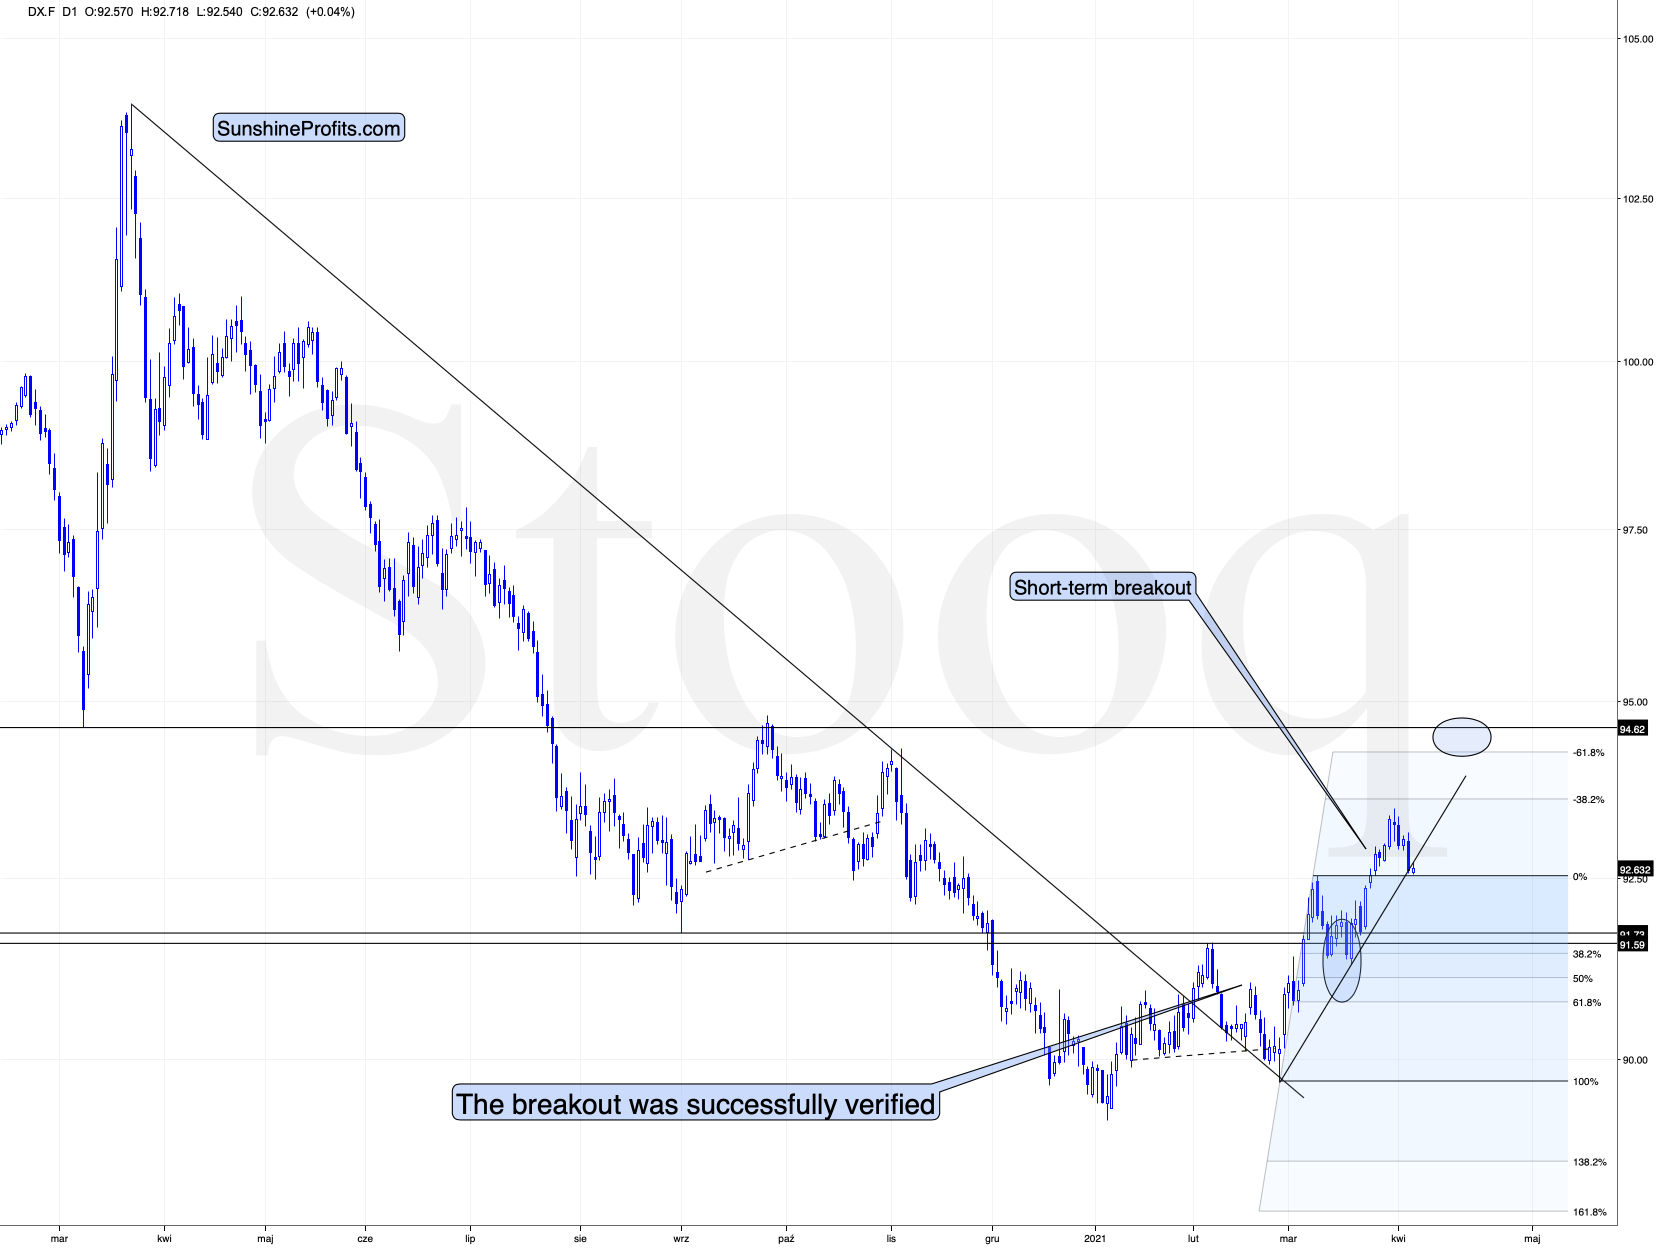
USDX Broke a Potential Bearish Pattern
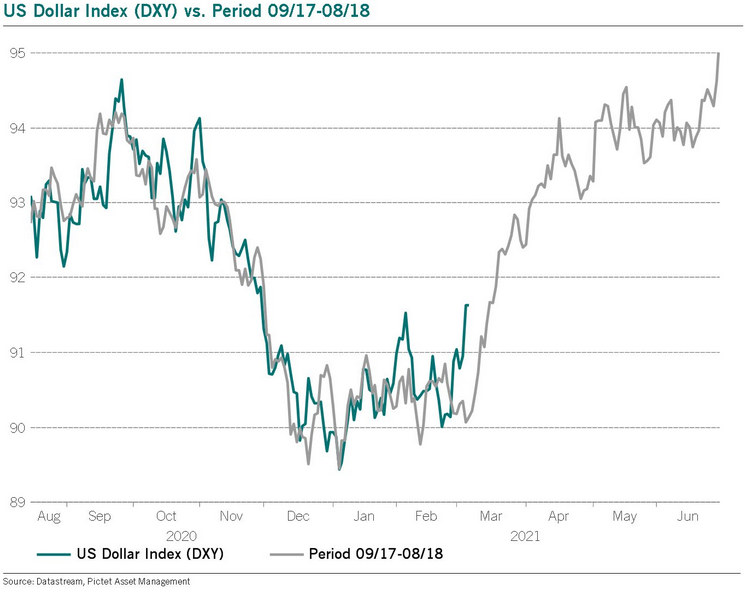
Likewise, a potentially bearish pattern that I had been monitoring – where the USD Index’s price action from July to October 2020 mirrored the price action from December 2020 to February/March 2021– has officially been broken. With the USD Index’s medium-term breakout trumping the former, the potentially bearish pattern has been invalidated and the USD Index remains on a journey to redemption.
But to what end?
Well, if we look back at 2020, the USD Index attempted to recapture its previous highs. But lacking the upward momentum, the failure was followed by a sharp move lower. Today, however, the USD Index has broken above its previous highs and the greenback verified the breakout by consolidating, moving back toward the previous lows and rising once again. Now, the USD Index is visibly above its previous highs.
Taken together, and given the magnitude of the 2017-2018 upswing, ~94.5 is likely the USD Index’s first stop. And in the months to follow, the USDX will likely exceed 100 at some point over the medium or long term.
No, not because the U.S. is doing so great in economic terms. It’s because it’s doing (and likely to do) better than the Eurozone and Japan, and it’s this relative performance that matters, not the strength of just one single country or monetary area. After all, the USD Index is a weighted average of currency exchange rates and the latter move on a relative basis.
In conclusion, while the USD Index’s decline on Apr. 5 created a goldilocks environment for the precious metals, the latter should have enjoyed a much larger upswing. However, with the U.S. 10-Year Treasury yield jumping by another 2.37% and the precious metals still shaken from a string of false breakouts, their relatively weak performance was quite revealing. Think about it: if gold, silver and the gold miners can’t make up ground when their main adversary retreats, how are they likely to respond when the USD Index regains its mojo? As a result, with the USD Index’s attitude about to shift from accommodating to unkind, gold, silver and the gold miners will likely see lower levels before forming a lasting bottom.
Thank you for reading our free analysis today. Please note that the above is just a small fraction of the full analyses that our subscribers enjoy on a regular basis. They include multiple premium details such as the interim targets for gold and mining stocks that could be reached in the next few weeks. We invite you to subscribe now and read today’s issue right away.
Sincerely,
Przemyslaw Radomski, CFA
Founder, Editor-in-chief -
Extra Alert: Did Gold Just Play a Trick on Us?
April 2, 2021, 1:47 PMAvailable for premium subscribers only.


Gold Investment News
Delivered To Your Inbox
Free Of Charge
Bonus: A week of free access to Gold & Silver StockPickers.
Gold Alerts
More-
Status
New 2024 Lows in Miners, New Highs in The USD Index
January 17, 2024, 12:19 PM -
Status
Soaring USD is SO Unsurprising – And SO Full of Implications
January 16, 2024, 8:40 AM -
Status
Rare Opportunity in Rare Earth Minerals?
January 15, 2024, 2:06 PM

