
tools spotlight

-
NASDAQ: The Leaders Lead. Or Attempt to, and Fail.
May 5, 2021, 8:50 AMThe most bearish development for gold came from… the NASDAQ. And no, these are not six typos in a row. Let me explain.
The tech stocks were the strongest part of the stock market in the previous year or so, and for a good reason. Due to the lockdown-induced surge in remote work, the need for all sorts of tech improvements (in both: software and hardware) soared. So, it’s no wonder that the NASDAQ was the strongest part of the market. It was the sole leader.
Now, there’s a rule in every market that leaders… Well, lead. This makes perfect sense, no surprise yet. But, there’s a point after which the leaders stop leading and stocks that are relatively weak or have less favorable fundamentals are catching up, eventually rallying more than the leaders. Why would this be the case? Because those who understand the markets and what’s going on are already invested, and those who are neither as knowledgeable nor experienced – the investment public – enter the market.
The investment public makes purchases often without any regard to fundamentals (or technicals) – they buy because a given asset seems cheap compared to other assets. And what would be cheap in the final part of the upswing – after the market professionals have already established their positions in well-positioned assets? The poorly positioned assets. The stocks/markets that were – for a good reason – neglected previously. So, they start buying those, and the laggards become the new leaders.
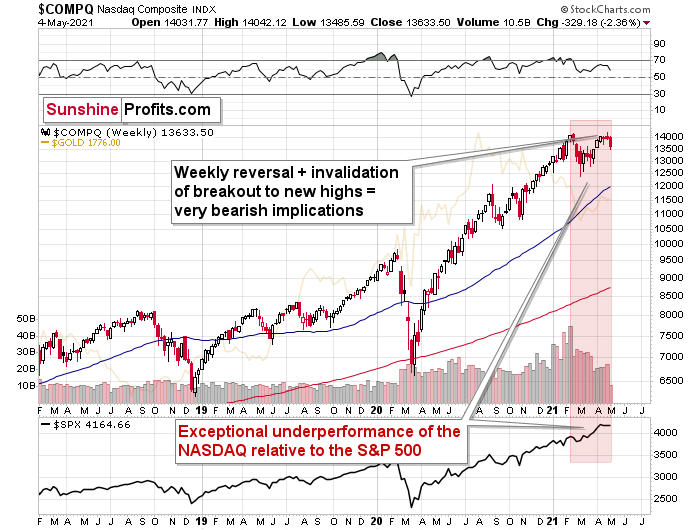
The NASDAQ was the leader that started to underperform while other stocks soared. The last few months were as clear as it gets in terms of emphasizing that. While the S&P 500 Index soared to new all-time highs, the only thing that the tech stocks managed to do was to attempt to break to new highs.
Attempt.
And fail.
Last week’s shooting-star-shaped weekly reversal was bearish on its own, but considering that it was also a failure to break to new highs, the bearish fire got gasoline poured over it.
Now, this could have been accidental, and it was prudent to wait for another decline before stating that the top in the stock market is most likely in…
Until we saw yesterday’s slide. The NASDAQ is already over 2% lower this week, and it’s only after two sessions.
Why is this important? Because if we have indeed seen a major top on the stock market, then it tells us a lot about the next moves on the precious metals market. And – in particular – about mining stocks.
The history might not repeat itself, but it does rhyme, and those who insist on ignoring it are doomed to repeat it.
And there’s practically only one situation from more than the past four decades that is similar to what we see right now.
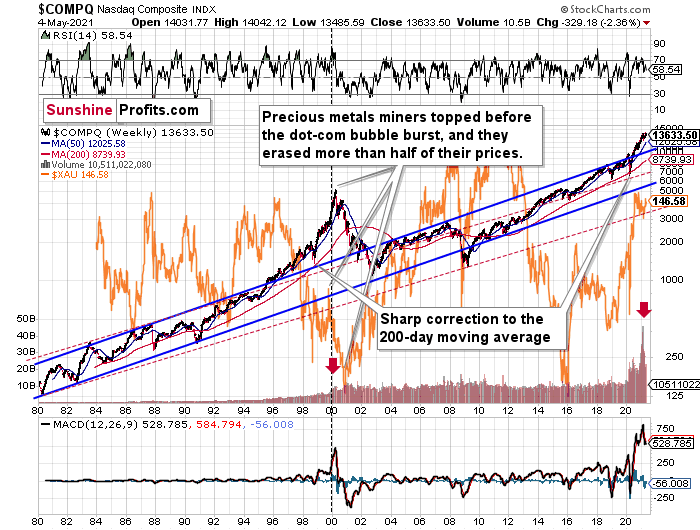
It’s the early 2000s when the tech stock bubble burst. It’s practically the only time when the tech stocks were after a similarly huge rally. It’s also the only time when the weekly MACD soared to so high levels (we already saw the critical sell signal from it). It’s also the only comparable case with regard to the breakout above the rising blue trend channel. The previous move above it was immediately followed by a pullback to the 200-week moving average, and then the final – most volatile – part of the rally started. It ended on significant volume when the MACD flashed the sell signal. Again, we’re already after this point.
The recent attempt to break to new highs that failed seems to have been the final cherry on the bearish cake.
Why should I – the precious metals investor, care?
Because of what happened in the XAU Index (a proxy for gold stocks and silver stocks) shortly after the tech stock bubble burst last time.
What happened was that the mining stocks declined for about three months after the NASDAQ topped, and then they formed their final bottom that started the truly epic rally. And just like it was the case over 20 years ago, mining stocks topped several months before the tech stocks.
Mistaking the current situation for the true bottom is something that is likely to make a huge difference in one’s bottom line. After all, the ability to buy something about twice as cheap is practically equal to selling the same thing at twice the price. Or it’s like making money on the same epic upswing twice instead of “just” once.
And why am I writing about “half” and “twice”? Because… I’m being slightly conservative, and I assume that the history is about to rhyme once again as it very often does (despite seemingly different circumstances in the world). The XAU Index declined from its 1999 high of 92.72 to 41.61 – it erased 55.12% of its price.
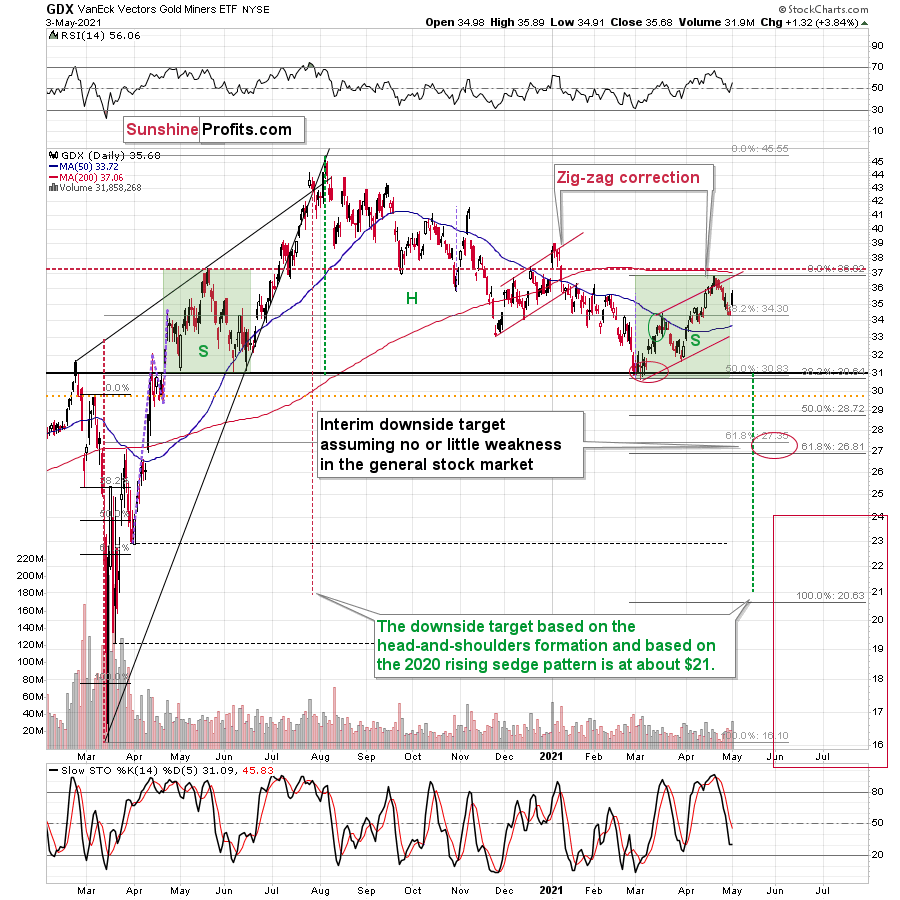
The most recent medium-term high in the GDX ETF (another proxy for mining stocks) was at about $45. Half of that is $22.5, so a move to this level would be quite in tune with what we saw recently.
And the thing is that based on this week’s slide in the NASDAQ that followed the weekly reversal and the invalidation, it seems that this slide lower has already begun.
Wait, you said something about three months?
Yes, that’s approximately how long we had to wait for the final buying opportunity in the mining stocks to present itself based on the stock market top.
The reason is that after the 1929 top, gold miners declined for about three months after the general stock market started to slide. We also saw some confirmations of this theory based on the analogy to 2008.
All in all, the precious metals sector would be likely to bottom about three months after the general stock market tops. If the last week’s highs in the S&P 500 and NASDAQ were the final highs, then we might expect the precious metals sector to bottom in the middle of the year – in late July or in August.
Thank you for reading our free analysis today. Please note that the above is just a small fraction of the full analyses that our subscribers enjoy on a regular basis. They include multiple premium details such as the interim targets for gold and mining stocks that could be reached in the next few weeks. We invite you to subscribe now and read today’s issue right away.
Sincerely,
Przemyslaw Radomski, CFA
Founder, Editor-in-chief -
Gold Behaves Like an Upset Friend - It’ll Get Over It
May 4, 2021, 9:06 AMBased on gold’s recent behavior, mood swings cannot be ruled out, but hormone levels are going to level off after the end of the market holidays.
Gold rallied visibly yesterday (May. 3) as the USD Index gave away some of Friday’s gains, sparking questions about whether this is actually bullish for gold. And rightfully so, after all, if a given market reacts to what it shouldn’t react to, it often tells us that the market wants to move in a certain direction. Let’s start with one of the questions I received:
Hi,
Thanks very much for your detailed reports. I just have a few observations and queries. On Friday we had the USD going up and Gold dropping a few dollars. Today we have again the USD continuing to go up, which is what you have been saying in your reports, but we also have Gold up $10. If you could help me understand why this is happening and how it fits into Gold going down as the USD goes up.
Thanks very much.
Let’s imagine that you’re about to go fishing with your friends, but you can’t ignore the fact that one of your friend’s behavior is odd, to say the least. While they’re usually fine with your selection of the fishing spot and the time you arrived, today they are annoyed by both. They don’t even like the road that your GPS system set for the drive, not to mention your driving skills. Whatever you say, it makes them complain. You might be tempted to think that this person is actually not that friendly at all and perhaps this friendship’s status has changed.
But… What actually happened was they were up all night as their heater broke, spilling water on the entire apartment, and since it was this friend that insisted on mounting it themselves, they didn’t want to brag about this result. They also didn’t have time to eat anything before they met with you this morning.
What is obvious based on the context might have been very misleading without it.
It seems to me that we have the same kind of situation in gold right now. The context here is that it’s the very final part of the consolidation – the right shoulder of a broad head-and-shoulders pattern, and, at such tops, markets can behave erratically.
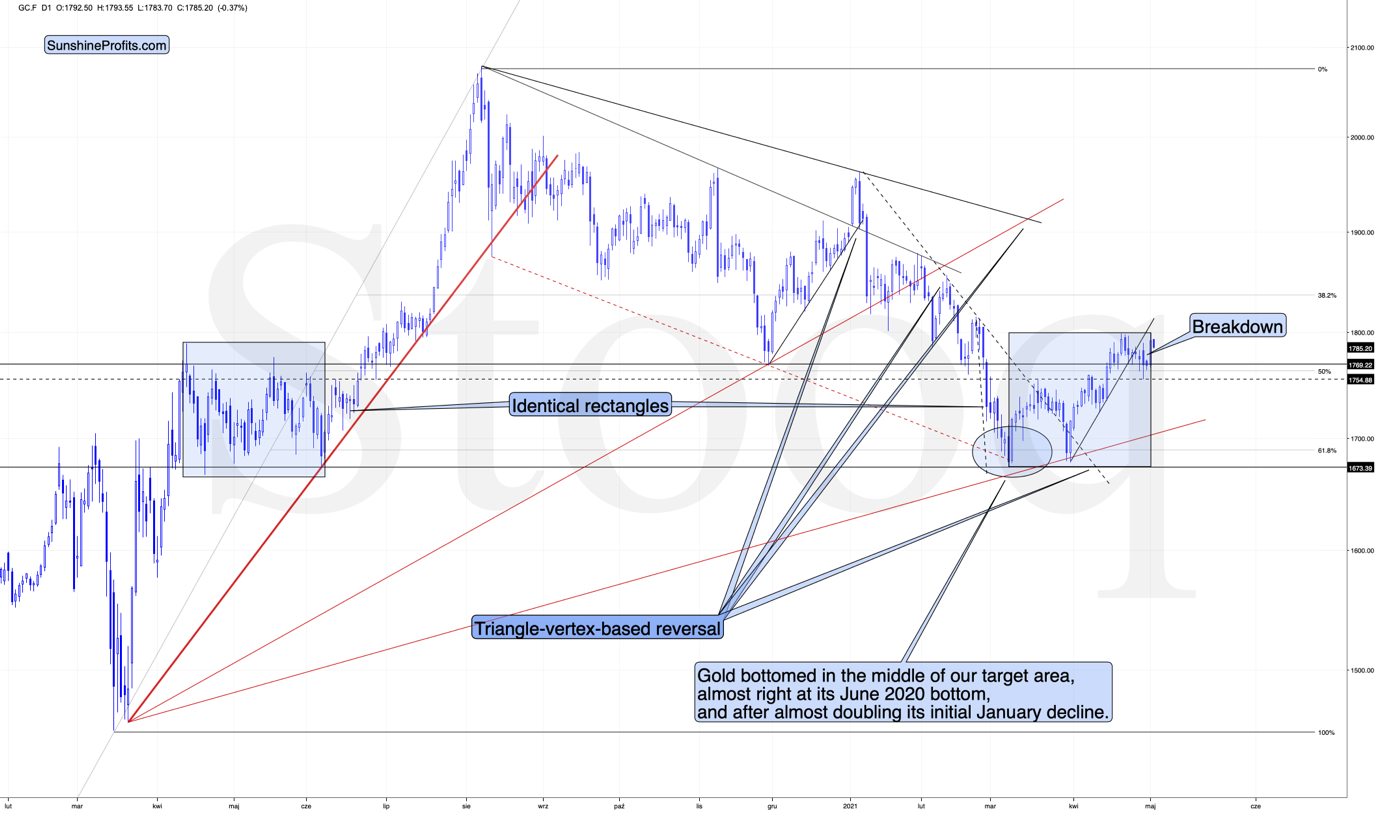
Based on the identical blue rectangles, it seems that we might have seen the end of the correction.
The breakdown below the short-term support line – along with its confirmation – provides us with bearish indications as well.
Did gold manage to break to new highs yesterday? No. So, did it change anything from the technical point of view? No, once again.
The only thing that might seem bullish here is gold’s performance relative to the USD Index, but if it is indeed the very end of the correction, then this kind of performance might be understandable. After all, that’s where the emotions are at the zenith.
Moreover, let’s keep in mind that yesterday was a bank holiday in some parts of the world, including one of the world’s financial centers – London. If there are any days during the year when the markets are much more likely to behave erratically than on other days, it’s during market holidays and options’ expiration days. We had the former yesterday.
The performance of some stock market indices seems to confirm that. For example, the Nasdaq (the previous strong leader) declined yesterday, while the broad market ended the day slightly higher (yesterday’s session in the S&P 500 was another daily reversal, though).
And how could that fit the situation in the USD Index?
Well, the USDX is after a massive breakout, which means that it’s no wonder it corrected the move yesterday. And as it did, it’s also no wonder that gold traders assumed the USD’s rally was over. But the interpretation of the situation is likely to change as the USDX is moving back up today, and it seems that it’s about to confirm its breakout.
Now, if the USD Index keeps rallying for days and gold continues to show strength for days, we might be on to something bullish here. For now, it’s too early to say that.
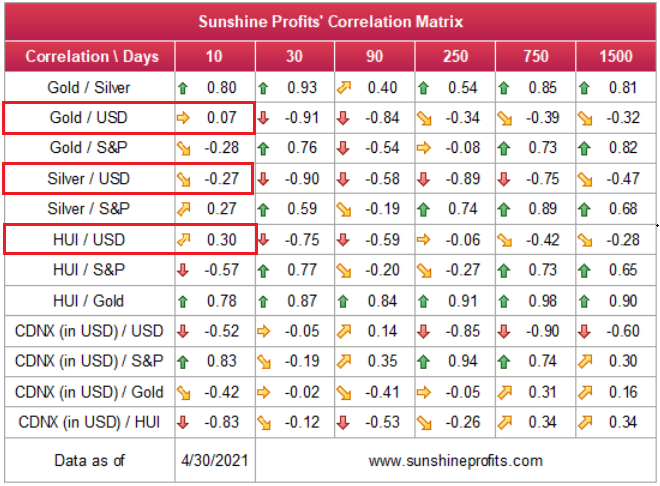
Moreover, the gold-USD dynamic is not the only one that matters. While the links between gold and the USD Index as well as between gold and gold stocks often require confirmations, silver’s outperformance of gold is something that we usually see on a very short-term basis, and it’s an important sell signal without additional confirmations.
And while gold moved close to the recent highs but didn’t exceed them, silver moved visibly above them.
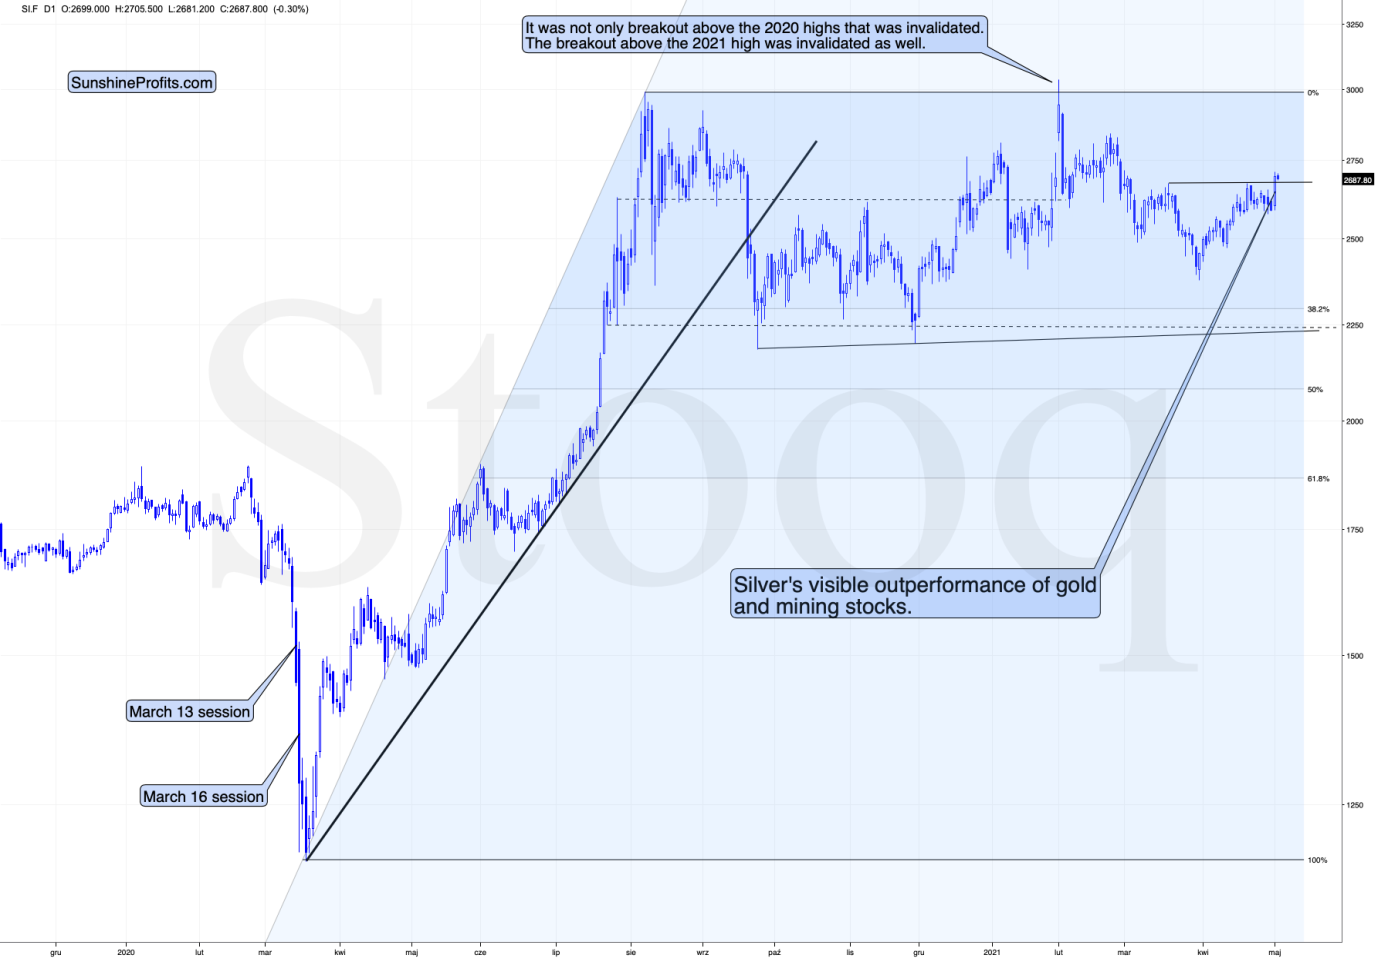
The silver price just outperformed gold on a very short-term basis, which is a great confirmation that yesterday’s session could have been the emotional peak – or a session that’s very close to such a peak.
While silver outperformed, miners underperformed.
Silver moved above its recent high, gold moved very close to it without breaking higher, and mining stocks didn’t move close back to the said highs. Consequently, gold stocks have underperformed gold.
Overall, the implications from the relative performance appear more bearish than bullish at this time, and they support other bearish factors that I’ve been discussing in my previous analyses.
Thank you for reading our free analysis today. Please note that the above is just a small fraction of the full analyses that our subscribers enjoy on a regular basis. They include multiple premium details such as the interim targets for gold and mining stocks that could be reached in the next few weeks. We invite you to subscribe now and read today’s issue right away.
Sincerely,
Przemyslaw Radomski, CFA
Founder, Editor-in-chief -
USDX, Gold Miners: The Lion and the Jackals
May 3, 2021, 9:37 AMThe USD Index let out a roar heard across all markets. The king of the financial jungle arrived, along with the greenback’s largest single-day gain.
Just as the African landscape sometimes needs to show the strongest of its inhabitants, so does the less remote but equally ferocious financial environment. This time, the USDX seems to have won the fight – its fangs and claws turned out to be the sharpest, and so are the rallies. There is nothing left for gold and its acquaintances than to run through the forest… run.
Sometimes, even jackals need to find shelter to lick their wounds in patience, waiting for a better time to come back to fight. However, they will come back eventually – they always do.
What About Gold, One of the Jackals?
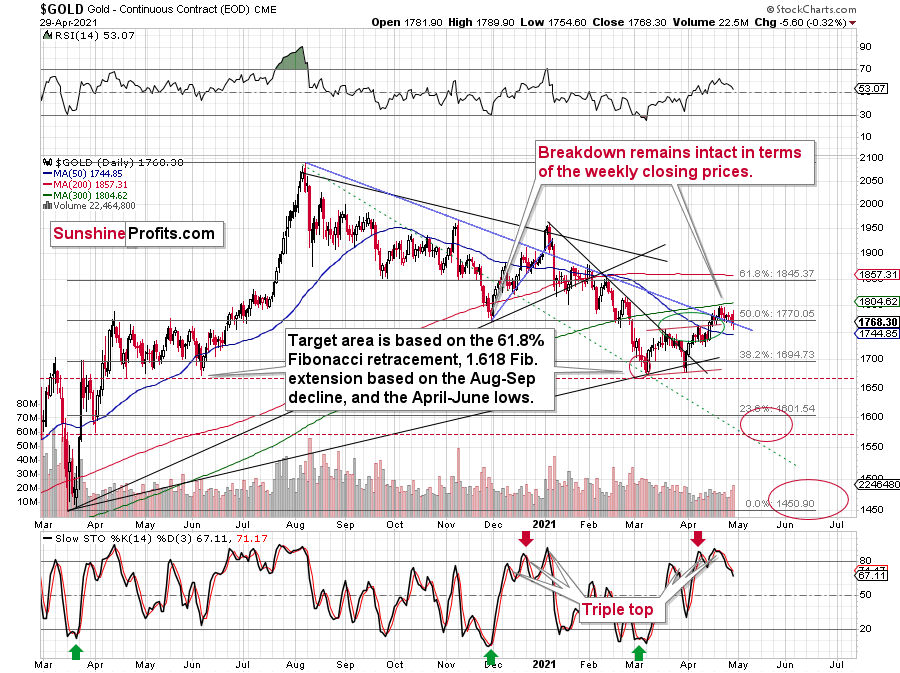
With a triple-top in gold’s stochastic oscillator akin to three warning signs of a nervous breakdown, the yellow metal is still recovering from last week’s crisis of confidence. And with the price action mirroring what we witnessed in early January – right before gold suffered a significant slide – the yellow metal could soon need therapy.
Please see below:
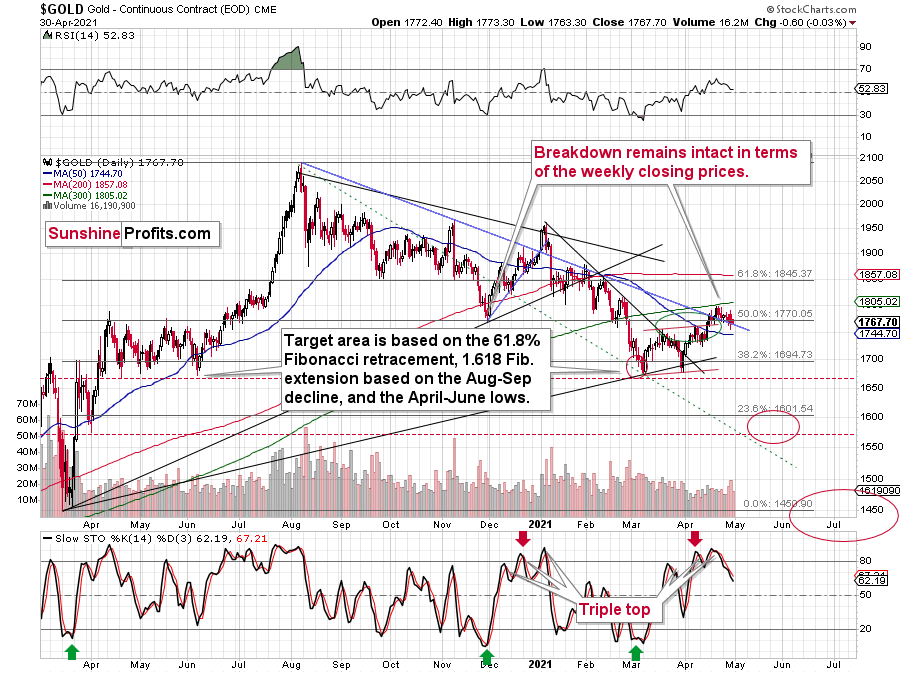
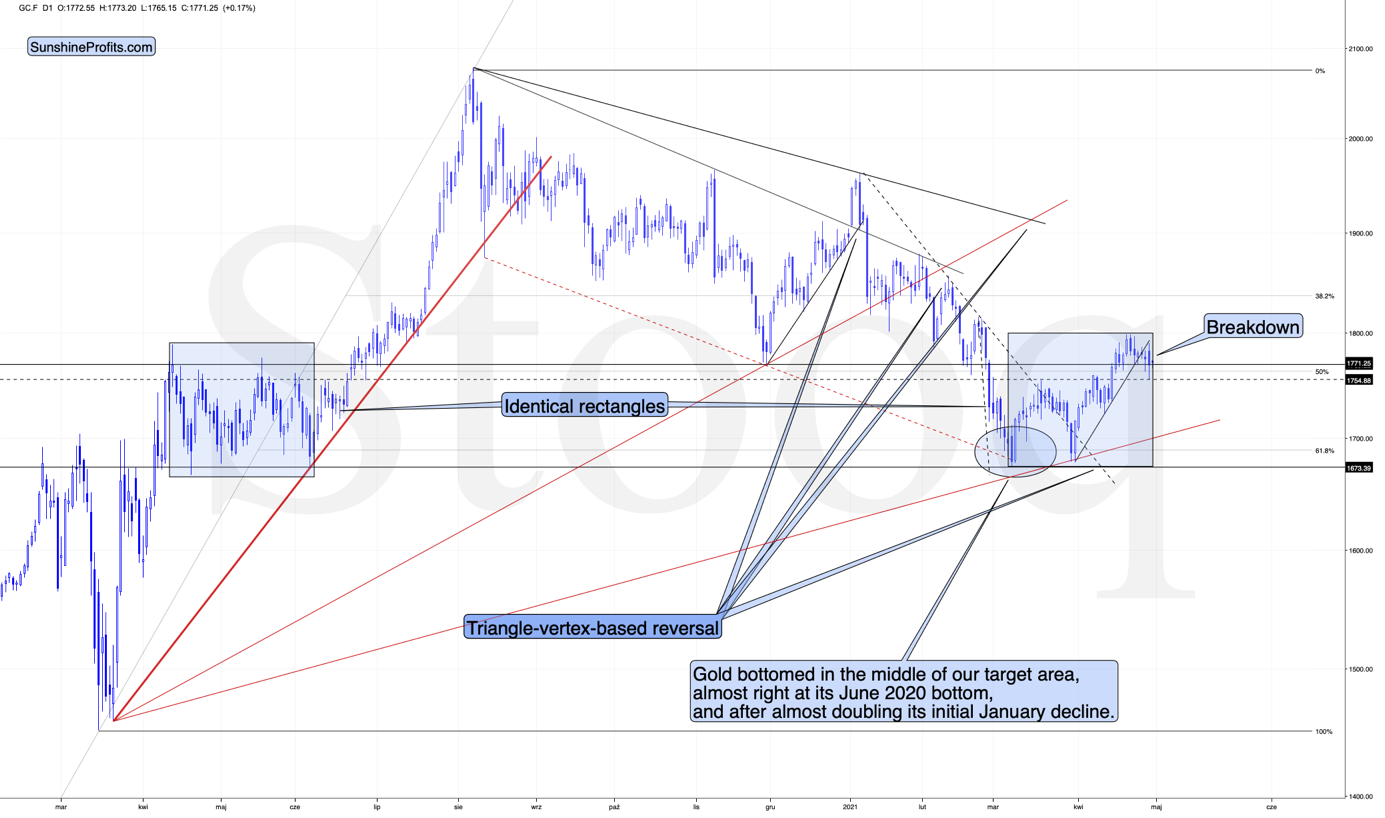
To explain, while gold’s corrective upswing was slightly bigger than I had anticipated, please note that the length thereof was in tune with the border of the green ellipse I used to mark the likely upside target area. In other words, the recent rally was not a game-changer. The yellow metal’s inability to crack $1,800 highlights the medium-term implications that I’ve been warning about. As a result, it’s become increasingly clear that gold’s recent strength was nothing more than a short-term upswing within a medium-term downtrend.
For more on the significance of gold’s stochastic oscillator, I wrote previously:
The first sell signal occurred slightly below the 80 level, the second was above it, and the same was the case with the third one.
Since back in early 2021, the stochastic indicator moved to new highs – and so far it hasn’t – and since the USD Index might even move slightly lower before finding its short-term bottom, gold could move slightly higher on a temporary basis, before topping. Perhaps (there are no certainties on any market, but this seems quite possible in the near term) it would be the round nature of the $1,800 level and the 300-day moving average that’s very close to it that would trigger a reversal and another massive decline. From the medium-term point of view, another $20 rally doesn’t really matter. It’s the few-hundred-dollar decline that’s likely to follow that really makes the difference.
In addition, it seems that gold is moving in a way that’s somewhat similar to what we saw between mid-April 2020 and mid-June 2020. It’s trading sideways below $1,800 but above ~$1,660. Back in 2020, the range of the back-and-forth movement (size of the short-term rallies and declines) was bigger, but the preceding move was also more volatile, so it’s normal to expect smaller short-term volatility this year (at least during this consolidation).
Why is this particularly interesting? Because both consolidations (the mid-April 2020 – mid-June 2020 one and the March 2021 – today one) could be the shoulders of a broad head-and-shoulders pattern, where the mid-June 2020 – early-March 2021 performance would be the head. The breakdown below the neck level – at about $1,660 – would be extremely bearish in this case because the downside target based on the pattern is created based on the size of the head. The target based on this broad pattern would be at about $1,350 (I marked it with a thin dashed red line on the chart below – you might need to click on it to expand it for this line to become visible). Is this level possible? It is. When gold soared above $2,000, almost nobody thought that it would decline back below its 2011 highs (well, you – my subscribers – did know that). Gold below $1,500 seems unthinkable now, but with rallying long-term rates and soaring USD Index, it could really happen.
The Lion - USD Index (USDX)
After delivering a ferocious 0.75% rally on Apr. 30 – the greenback’s largest single-day gain since Mar. 4 – the USD Index let out a roar that was heard across all corners of the financial markets. And while gold, silver and mining stocks are still cackling in disobedience – as evidenced by the trios’ decelerating correlations over the last 10 days – every once in a while, the lion has to show the jackals who he is.
To explain, as the USD Index’s recent plight elicits whispers of a new order in the currency kingdom, the greenback’s stoic behavior has been misjudged as weakness. And while the vultures circle and prophecies of the USD Index’s demise become louder, the lion is slowly moving to his feet.
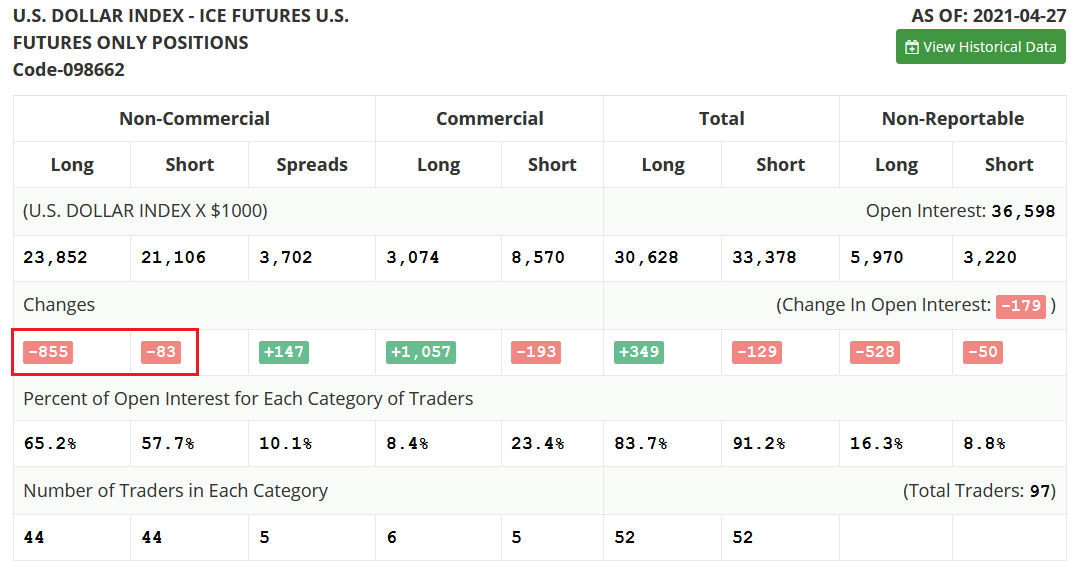
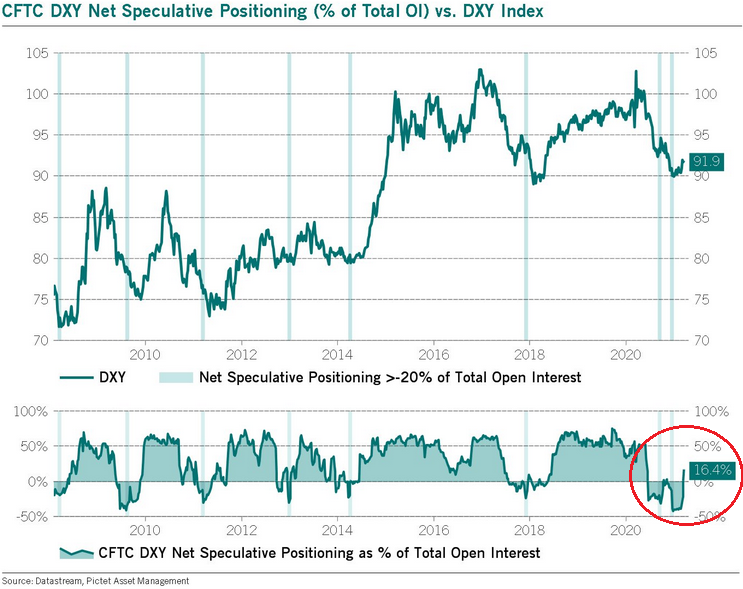
Case in point: with the zeitgeist forecasting new lows for the greenback, non-commercial (speculative) futures traders are still holding firm. Despite the greenback’s suffering, the immaterial decline in net-long positioning last week was relatively muted and highlights investors’ quiet respect for the U.S. dollar.
Please see below:
 Source: COT
Moreover, with prior periods of extreme pessimism followed by monumental rallies in the USD Index, unless ‘this time is different,’ it’s simply a matter of when, not if, the U.S. dollar feasts on the precious metals’ overconfidence.
To explain, I wrote previously:
When net-speculative short interest as a percentage of total open interest (based on the CoT data) became extremely high in 2014 and 2018, the USD Index recoded two of its sharpest rallies in history. How sharp? Well, let’s take a look at how things developed in the past – after all, history tends to rhyme.
Let’s focus on what happened when the net speculative positions were significantly (!)negative and then they became significantly (!) positive, without paying attention to any tiny moves (like the one that we saw last summer).
In short, rallies that followed periods of extreme pessimism include:
- The big 2008 rally (over 16 index points)
- The big 2009 – 2010 rally (over 14 index points)
- The 2011 – 2012 rally (over 11 index points)
- The 2013 rally (“only” over 5 index points)
- The big 2014 – 2015 rally (over 20 index points)
- The 2018 rally (over 15 index points)
The current rally started at about 89, so if the “normal” (the above shows what is the normal course of action) happens, the USD Index is likely to rally to at least 94, but since the 5-index point rally seems to be the data outlier, it might be better to base the target on the remaining 5 cases. Consequently, one could expect the USD Index to rally by at least 11 – 20 index points, based on the net speculative positions alone. This means the upside target area of about 105 – 114. Consequently, a comeback to the 2020 highs is not only very likely, but also the conservative scenario.
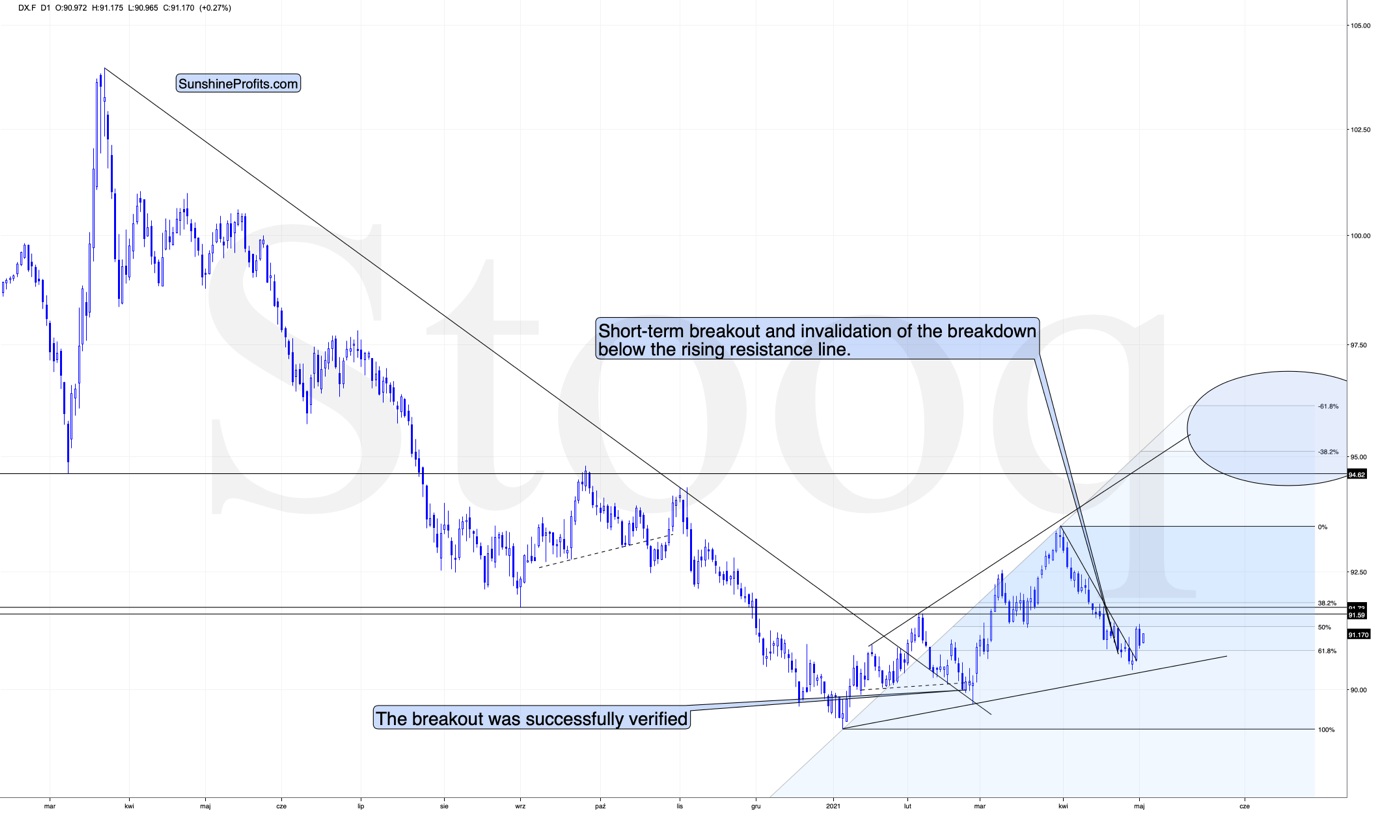
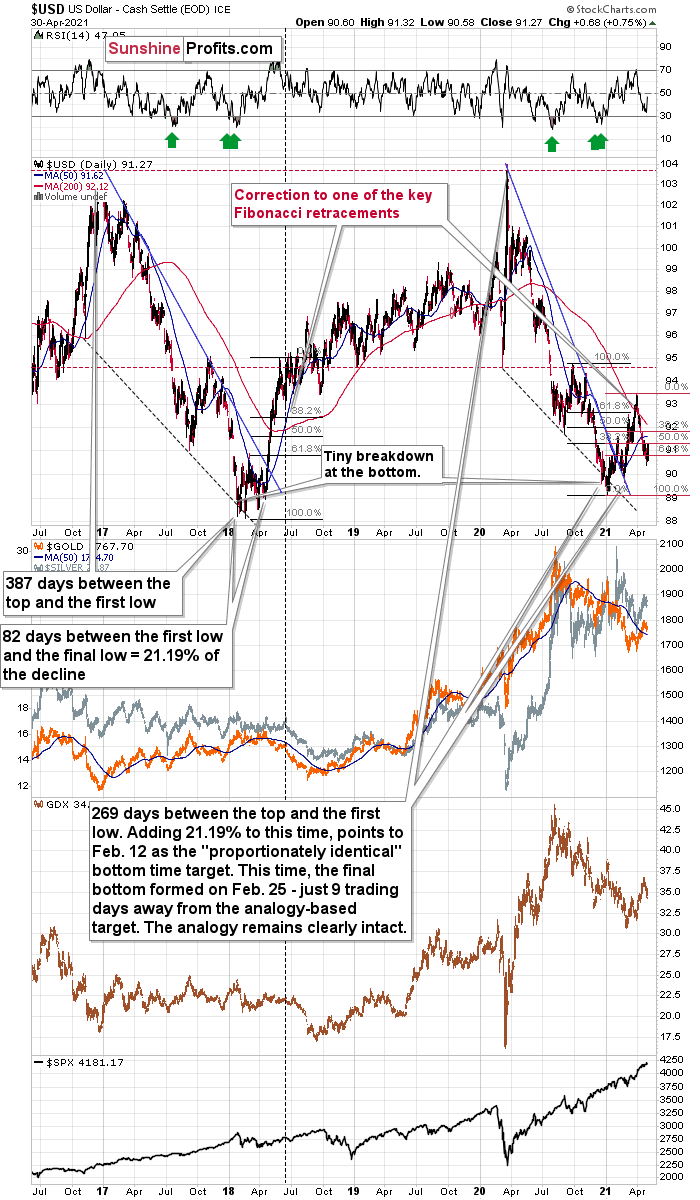
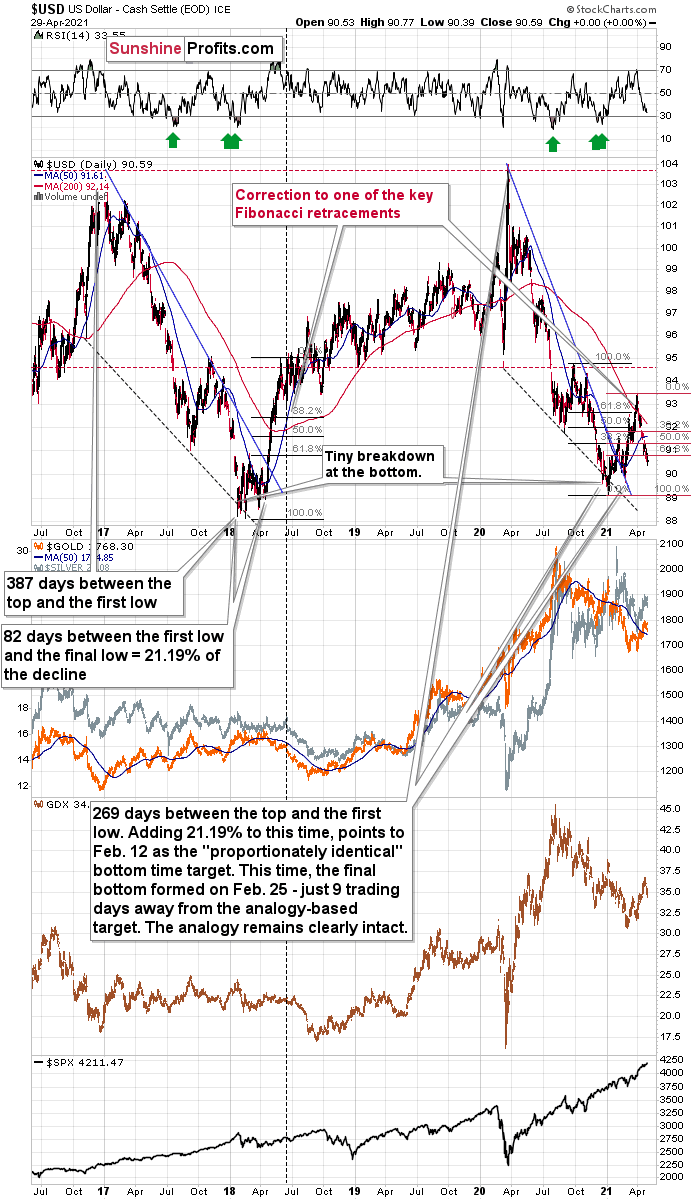
In addition, let’s keep in mind that the very bullish analogy to the 2018 rally remains intact. If you analyze the chart below, you can see that back in 2018, the USD Index rallied sharply and then corrected back to (roughly) the 38.2% Fibonacci retracement level. And while the current decline is of a much larger magnitude than what we saw in mid-April 2018, the USD Index is still following its June 2018 analogue by declining slightly below another critical Fibonacci retracement – the 61.8% one. Moreover, amid the greenback’s surge on Apr. 30 – which I warned was forthcoming – the USD Index invalidated its breakdown below the 61.8% Fibonacci retracement level. The bottom line? The sharp reversal is extremely bullish for the U.S. dollar.
More importantly, though, when the USD Index resumed its uptrend in June 2018 – marked by the vertical dashed line near the middle of the chart – the measured move higher also coincided with an accelerated drawdown of gold, silver and mining stocks.
Please see below:
To explain, I wrote on Apr. 21:
I marked the situation from 2018 that seems similar to what we see right now with a dashed, horizontal line. Back in 2018, the pullback ended when the USD Index moved to its first Fibonacci classic retracement level (the 38.2% one). In case of the current rally, it seems that another classic retracement worked – the 61.8% one.
The very important detail about the June 2018 decline (and bottom) is that while this was the moment after which the USD Index’s started to move higher at a slower pace, it was also the moment after which the precious metals market started to decline faster.
At the beginning of the year, I wrote that the precious metals market was likely to decline and that the preceding rally was likely fake. That’s exactly what happened.
Right now, I’m writing that the recent rally was also fake (a correction within a medium-term decline) and – even more importantly – it seems likely that the next downswing could take place at a higher pace than what we saw so far this year. And – just as was the case in 2018 – this upcoming (fast) decline is likely to lead to the final bottom in the precious metals sector.
As further evidence, I warned on Apr. 30 that the USD Index was ripe for a reversal. And while entering long positions in the USD Index is an appetizing thought, shorting the gold miners offers much more bang for our buck.
I wrote (with regard to possible long positions in the USD Index futures):
I would be looking to re-enter long positions as soon as the USD Index confirms the breakout above the declining resistance line. At the moment of writing these words, the USDX is already trading back above this line, so the only thing that it needs to do now is to stay there. Still, given today’s pre-market movement, it seems that we might even see an invalidation of the move below the 61.8% Fibonacci retracement. A weekly close above both levels would be very bullish for the short term and a sign for me to get back to the long positions.
But – that is all based on the assumption that I would want to have any position in the USDX. And I don’t because I think that having a short position in mining stocks provides a much better risk-to-reward ratio.
That’s exactly what we saw – a weekly close above both levels.
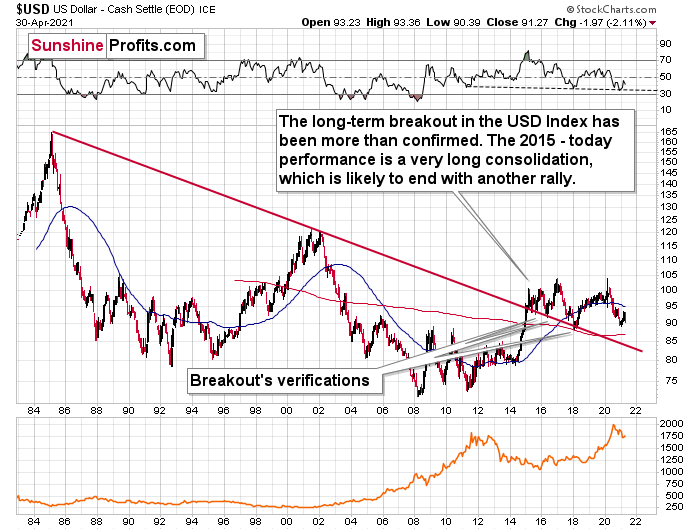
Adding even more ferocity to the USD Index’s roar, the recent downtrend has not invalidated its long-term breakout. And with the long-term implications taking precedence over the medium- and short-term ones, the USDX’s uptrend remains intact.
Please see below:
The bottom line?
Given the magnitude of the 2017-2018 upswing, ~94.5 is likely the USD Index’s first stop. In the months to follow, the USDX will likely exceed 100 at some point over the medium or long term.
Keep in mind though: we’re not bullish on the greenback because of the U.S.’ absolute outperformance. It’s because the region is doing (and likely to do) better than the Eurozone and Japan, and it’s this relative outperformance that matters, not the strength of just one single country or monetary area. After all, the USD Index is a weighted average of currency exchange rates, and the latter move on a relative basis.
In conclusion, with mischievous market participants nipping and clawing at the USD Index’s mane, it’s only a matter of time before the greenback strikes back with a vengeance. And while the precious metals consider the USD Index’s territory up for grabs, the greenback’s pride is unlikely to stay hidden for much longer. As a result, while gold, silver and mining stocks’ gaze across the grassland, the sun has likely set on their recent rallies. However, once the wet season washes away the litany of financial-market imbalances, the eventual bloom will allow the precious metals to grow stronger in the long run.
Thank you for reading our free analysis today. Please note that the above is just a small fraction of the full analyses that our subscribers enjoy on a regular basis. They include multiple premium details such as the interim targets for gold and mining stocks that could be reached in the next few weeks. We invite you to subscribe now and read today’s issue right away.
Sincerely,
Przemyslaw Radomski, CFA
Founder, Editor-in-chief -
Gold Can’t Wait to Fall – Even Without USDX’s Help
April 30, 2021, 9:05 AMGold started its decline without anyone’s assistance. And when the USDX takes off, that downhill tumble can only increase.
The USDX declines and the precious metals sit by idly, twiddling their thumbs. If they had the strength that’s being talked about, they should be soaring by now, or getting ready to. So, what’s their problem?
In the previous days, I discussed the signals coming from the precious metals market or for the precious metals market, as they kept on emerging, and we just received yet another round of indications. And yes, they also confirm the bearish outlook for the following weeks - or a few months.
Let’s start by looking at the USD Index.
On the above chart you can see that this week, the USD Index broke to new monthly lows. And you can also see that gold didn’t move to a new monthly high. In fact, it was not even close to doing so – it just closed the day below $1,770. This is a clearly bearish sign for gold.
And what about the USD Index?
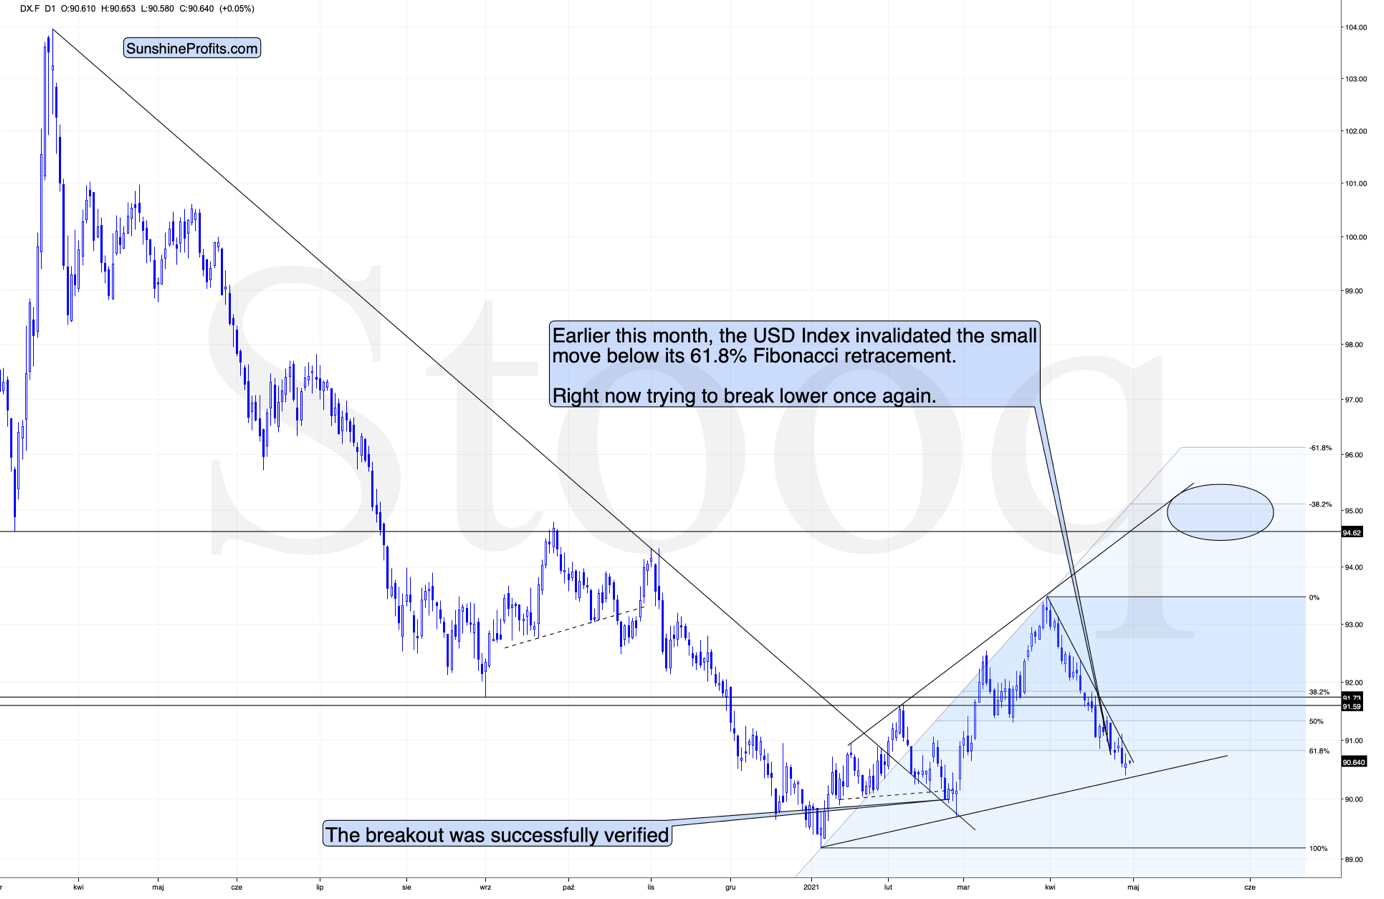
It’s making a second attempt to break below its 61.8% Fibonacci retracement level. Will it be successful? It might be, but… Another support level is just around the corner. Perhaps the proximity to the rising support line based on the January and February lows was actually enough to trigger the rebound yesterday. In this case, the bottom in the USDX is already in. But, we’ll know with much greater certainty when the USDX finally breaks above the declining resistance line and then confirms this breakout.
On the above 4-hour USD Index chart we see that the previous short-term breakout was invalidated, which triggered a substantial sell-off, but… Whatever was likely to happen based on this invalidation seems to have already happened. And it seems that we’re about to see another attempt to break higher. Will the USD Index be successful this time? That’s quite likely, but that’s not the most important thing from the precious metals investors’ and traders’ point of view.
PMs Play the Fiddle While USDX Burns
The key thing is that during the recent declines in the USDX (and during the move to new highs in case of the general stock market), gold, silver, and mining stocks didn’t soar. They “should have” if the situation was normal or bullish. They declined instead, which means it’s highly likely that even if the USD Index doesn’t break out now (but a bit later), the decline in the PMs will not be avoided but only delayed.
In fact, to be more precise, it’s unlikely to be delayed as well – what might be delayed is the increase in the pace at which gold, silver, and miners are about to slide. After all, gold and gold stocks are already moving lower (while silver is trading sideways).
By the way, silver’s lack of movement recently is perfectly normal in the early stage of a decline – the white metal tends to catch up big-time in the final part of a given move.
On the above gold chart, you can clearly see how gold moved back up to its rising short-term resistance line this week, and – instead of invalidating the breakdown – it bounced from it and declined once again. This is what verifications of breakdowns look like.
Also, let’s keep in mind that the situation now seems to be a mirror image of what we saw in April – June 2020, and at the same time it’s somewhat similar to what we saw at the beginning of the year. You can see the former (the rectangles are identical) on the above chart, and you can see the similarity to the early January action below.
Just as was the case in early January, we first saw a pause – a rebound – and the decline continued only thereafter. It seems that the Jan. 7, 2021 price action is quite similar to what we saw yesterday (Apr. 29). Moreover, please note that both happened just above the declining blue support line. It was the final pause before the move higher was invalidated.
Having said the above, let’s move to gold stocks:
Miners: GDX and GDXJ ETFs
In yesterday’s analysis, I described the GDX’s previous performance in the following way:
Gold stocks’ intraday recovery that we saw yesterday may seem profound, but not if we consider what happened in the USD Index and the general stock market. The former declined substantially while the latter was close to its all-time highs. This is a combination of factors that “should have” made gold miners move to new highs – and a daily gain of less than half percent is a sign of weakness, not strength.
In today’s pre-market trading the S&P 500 futures moved to new highs, and gold miners showed gains in the London trading, but they are nothing to write home about – and more importantly, nothing that would change the bearish forecast for gold I described more broadly previously.
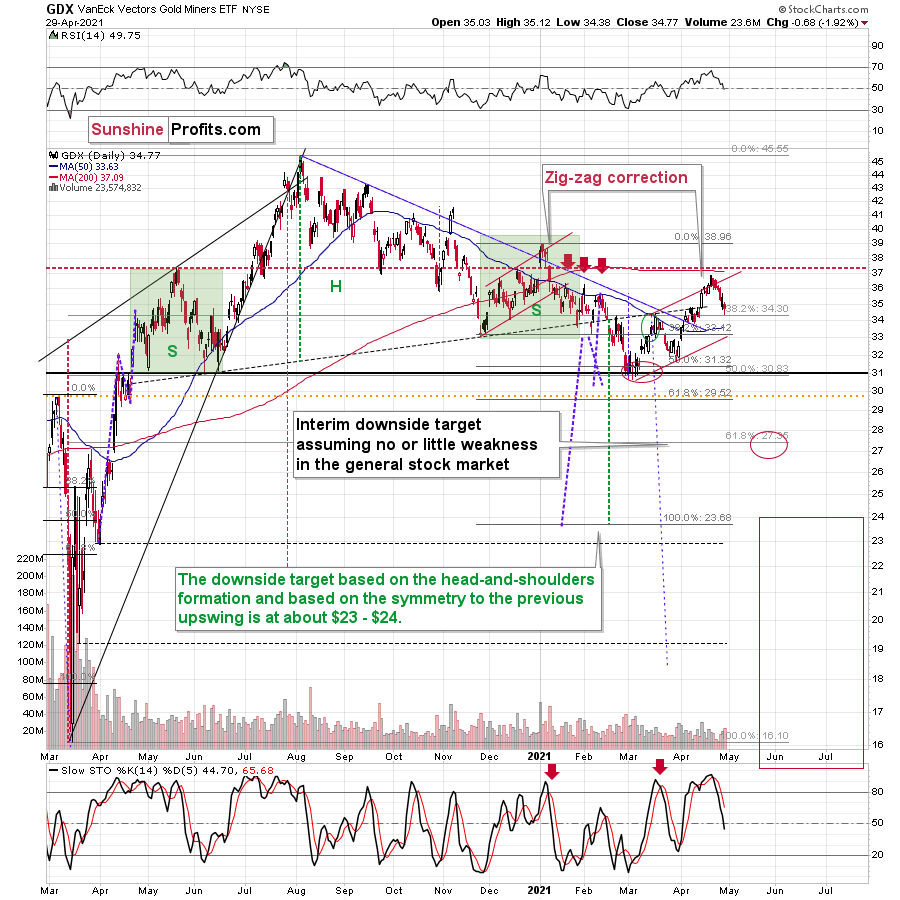
The bearish interpretation of the previous “strength” turned out to have been correct – the GDX ETF declined yesterday.
The decline was even more visible and important in the case of the GDXJ ETF, where we have trading positions.
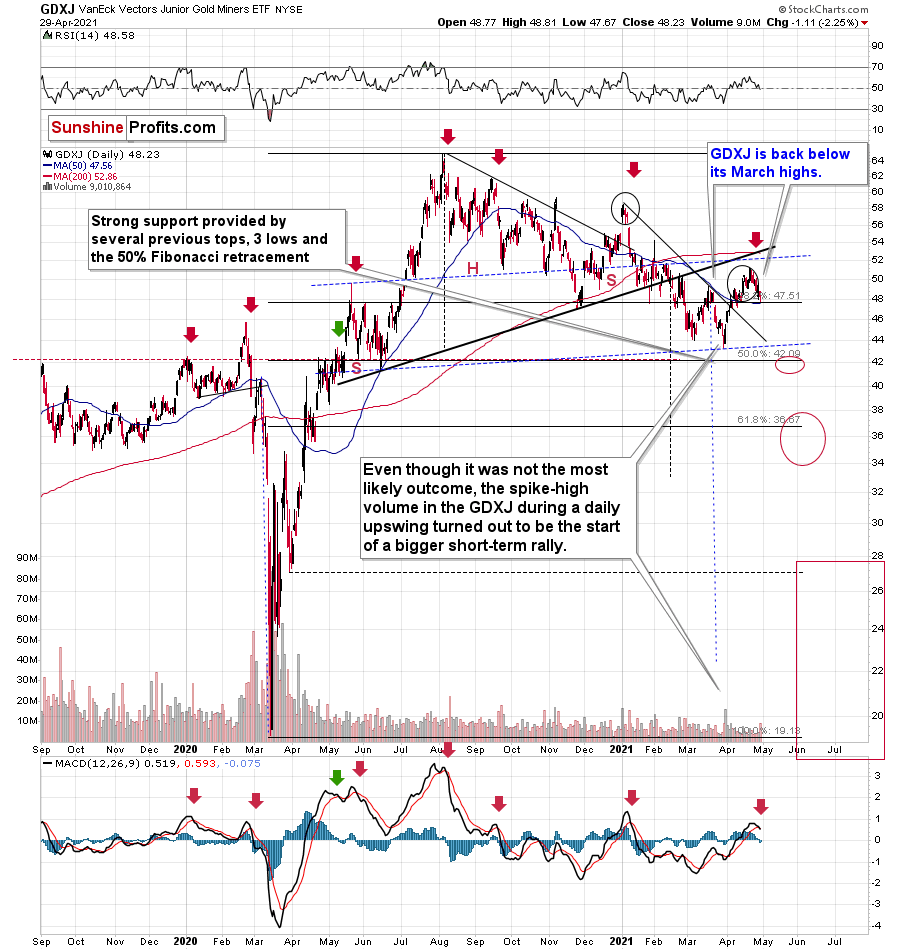
This ETF for junior gold and silver miners (gold miners have much bigger weight in it, though) moved and closed back below its March 2021 highs.
Consequently, we have a situation in which:
- The USD Index is about to reverse and rally.
- Gold signals that it just can’t wait for the USD Index to rally, and it’s already declining (the pace at which it declines is likely to greatly increase once the USD Index takes off).
- Gold miners behave relatively normally, which in this case means that they are declining more than gold does (GLD just closed 1.14% below the highest daily close of April, while the GDX just closed 5.59% below the highest daily close of April). Besides, their recent move back to the May 2020 highs and the subsequent decline further increases the odds that the decline is going to shape the right shoulder of a huge head and shoulders formation with extremely bearish implications (once completed).
- GDXJ is underperforming GDX just as I’ve been expecting it to. While GDX declined by 5.59% so far (in terms of the closing prices), GDXJ declined by 5.67%. This might seem an unimportant level of underperformance, but the perspective changes once one realizes that GDXJ is more correlated with the general stock market than GDX is. Consequently, GDXJ should be showing strength here, and it isn’t. If stocks don’t decline, GDXJ is likely to underperform by just a bit, but when (not if) stocks slide, GDXJ is likely to plunge visibly more than GDX.
The above combination tells me that we are very well positioned in case of our short position in the GDXJ.
Besides, as an analytical cherry on the bearish GDXJ cake, please note that we just saw a sell signal from the MACD indicator (lower part of the chart) while it was visibly above 0, and after a relatively big short-term rally. We saw this kind of performance only several times in the previous year, and it meant declines in almost all cases. We saw it only once before this year – in early January, and a sizable decline followed.
Thank you for reading our free analysis today. Please note that the above is just a small fraction of the full analyses that our subscribers enjoy on a regular basis. They include multiple premium details such as the interim targets for gold and mining stocks that could be reached in the next few weeks. We invite you to subscribe now and read today’s issue right away.
Sincerely,
Przemyslaw Radomski, CFA
Founder, Editor-in-chief


Gold Investment News
Delivered To Your Inbox
Free Of Charge
Bonus: A week of free access to Gold & Silver StockPickers.
Gold Alerts
More-
Status
New 2024 Lows in Miners, New Highs in The USD Index
January 17, 2024, 12:19 PM -
Status
Soaring USD is SO Unsurprising – And SO Full of Implications
January 16, 2024, 8:40 AM -
Status
Rare Opportunity in Rare Earth Minerals?
January 15, 2024, 2:06 PM

