
tools spotlight

-
USDX: Subtle Changes, Remarkable Outcomes
April 28, 2021, 8:54 AMEven the smallest moves can be of utmost importance to a number of investors. This time, the USDX was the one to give a subtle nod to the upcoming changes.
In yesterday’s analysis, I wrote about the subtle, yet very important short-term detail that likely indicated a major turnaround in the USD Index. This is huge news for the precious metals investors, as a major turnaround in the USDX (and the subsequent rallies) would be very likely to translate into a severe price slide.
The important change was that the situation regarded the USD’s 61.8% Fibonacci retracement.
Last week, I wrote the following:
I wouldn’t be surprised to see this week end without any major reversal, but we could see one on Monday. Some traders won’t be able to adjust their stop-loss levels at that time, so if anyone “big” wants to squeeze the profits out of individual traders shorting the USDX before the latter rallies, it would be a perfect time. The idea could be to trigger a small sell-off early on Monday, which would then trigger stop-loss selling, and it would allow the “big” market participant to re-enter the long positions at lower prices.
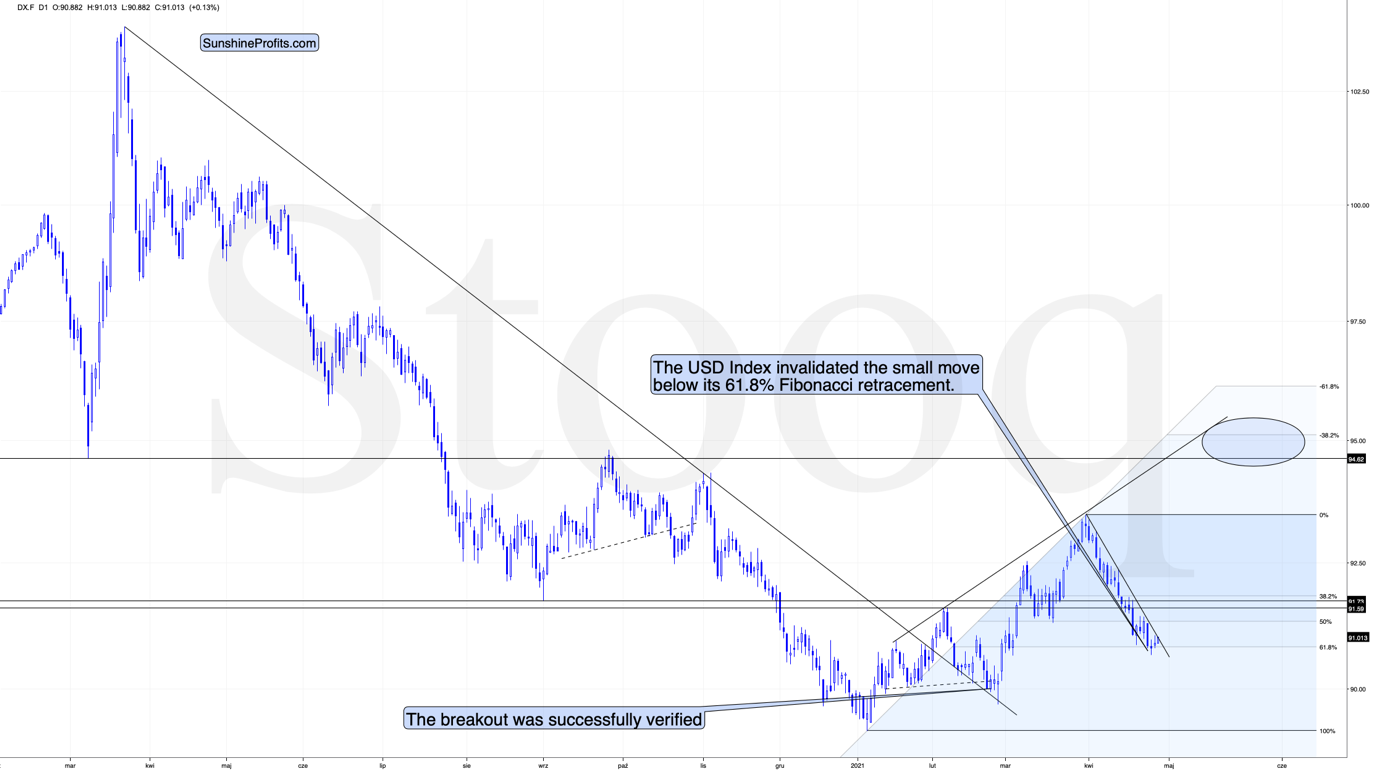
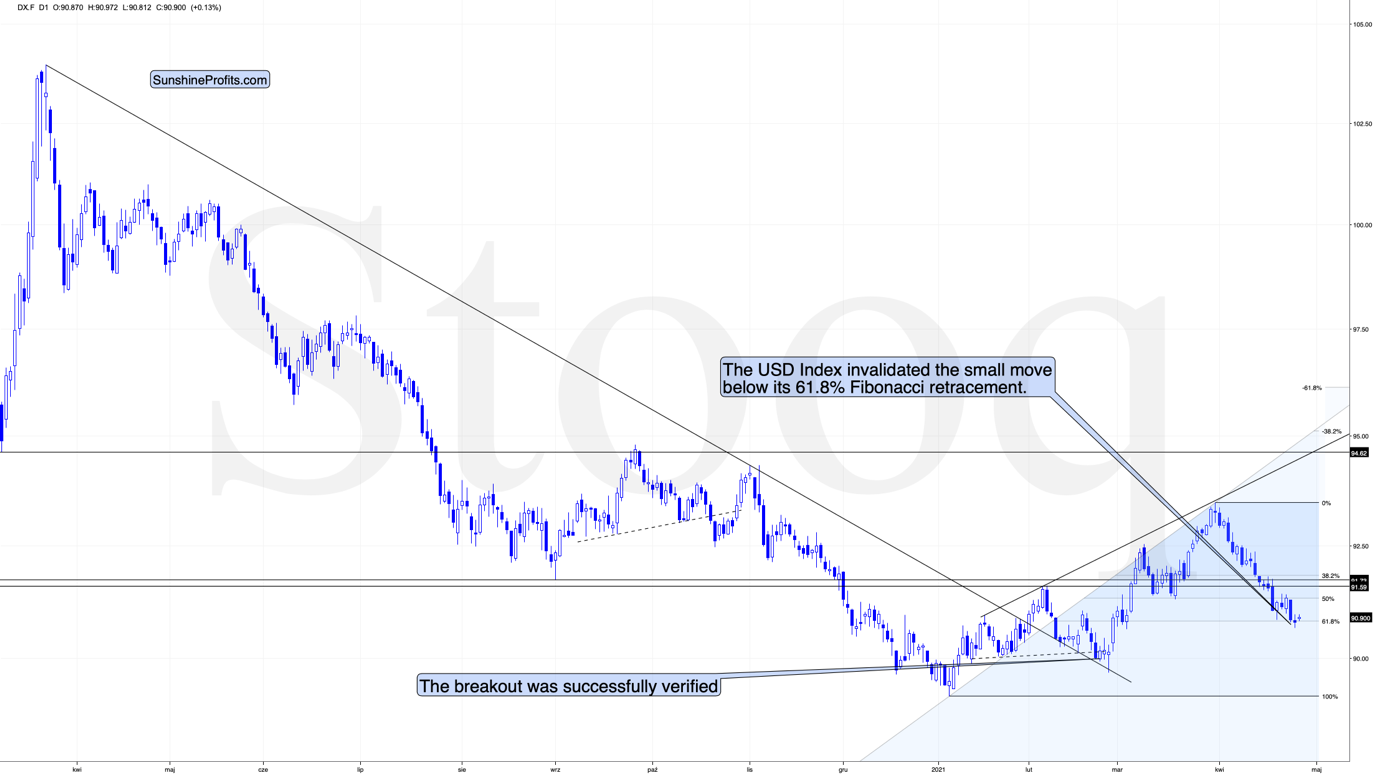
The fact that the USD Index moved slightly below its very important short-term support (the 61.8% Fibonacci retracement) on Monday (Apr. 26) and then it invalidated this breakdown yesterday (Apr. 27) perfectly fits the above quote.
The invalidation of the breakdown is a bullish phenomenon, and even though the price moves are still small, they already suggest that a bigger rally is likely just around the corner. In today’s pre-market trading, the USD Index moved higher once again, which means the invalidation was not accidental.
If we zoom in, we’ll see the full importance of what just happened on a short-term basis.
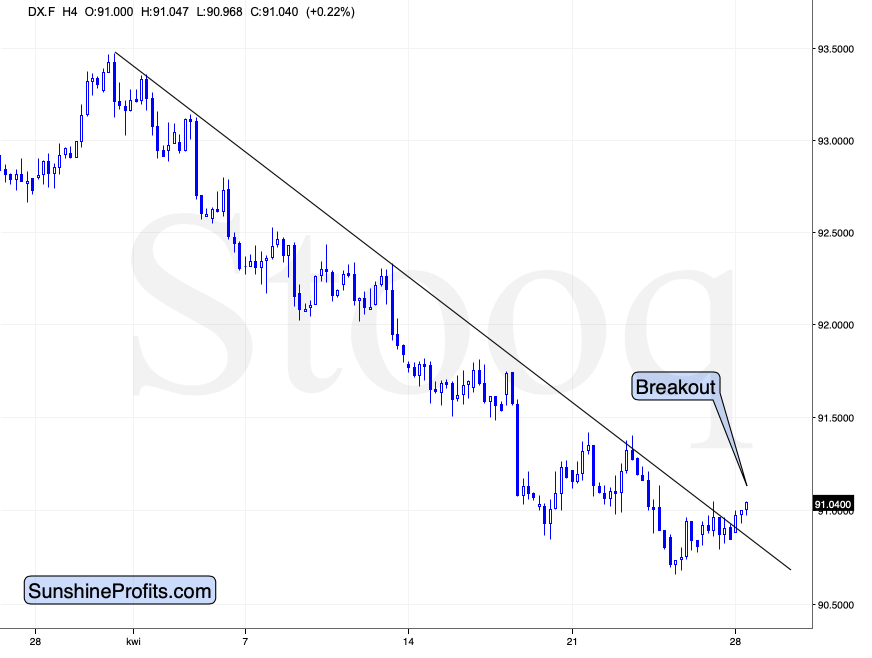
We just saw a short-term breakout! Finally, after many days of declines, the USD Index showed enough strength to rally above its short-term declining resistance line.
This is yet another sign that the recent price action – despite not being very visible – is a game-changer for the short term.
Naturally, the bullish situation in case of the USD Index has bearish implications for the precious metals market.
In fact, we can see the implications on the gold market already.
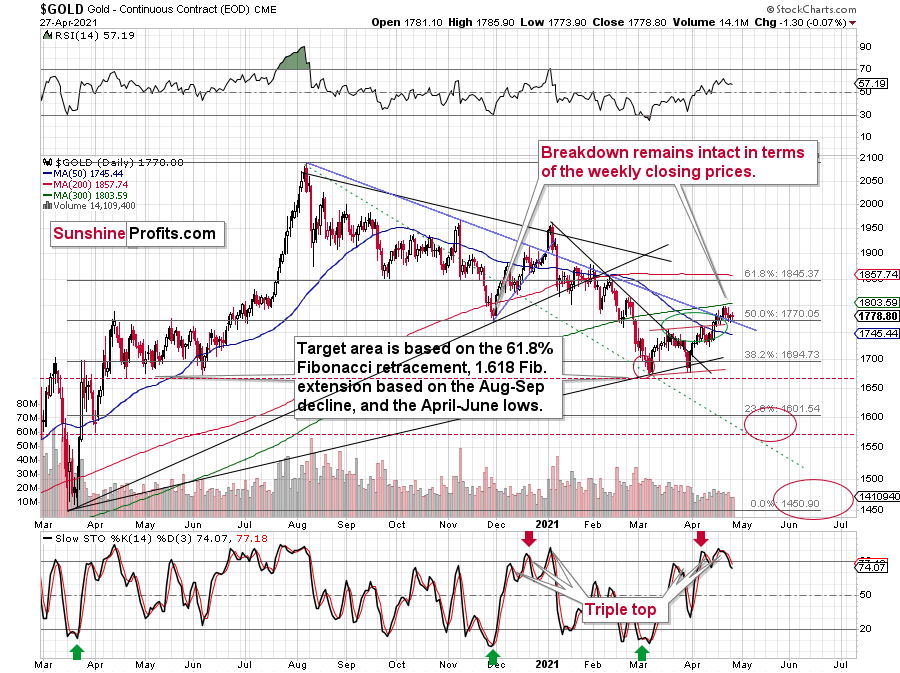
As the USD Index broke higher, gold broke below its rising support line, and at the moment of writing these words, it’s already trading below the $1,770 level. The odds that the final top was formed last week – at $1,798.40 – have further increased.
In the previous analyses, I wrote quite a lot about the broad head and shoulders pattern in the mining stocks. I discussed that in detail on Monday, so I don’t want to cover the same ground once again today, but as a quick reminder, the HUI Index (proxy for gold stocks) – based on this (hypothetical) pattern and the analogy to previous broad H&S patterns (ones preceding the 2008, 2013 slides) – was likely to form a top close to 300. It topped at 299.09.
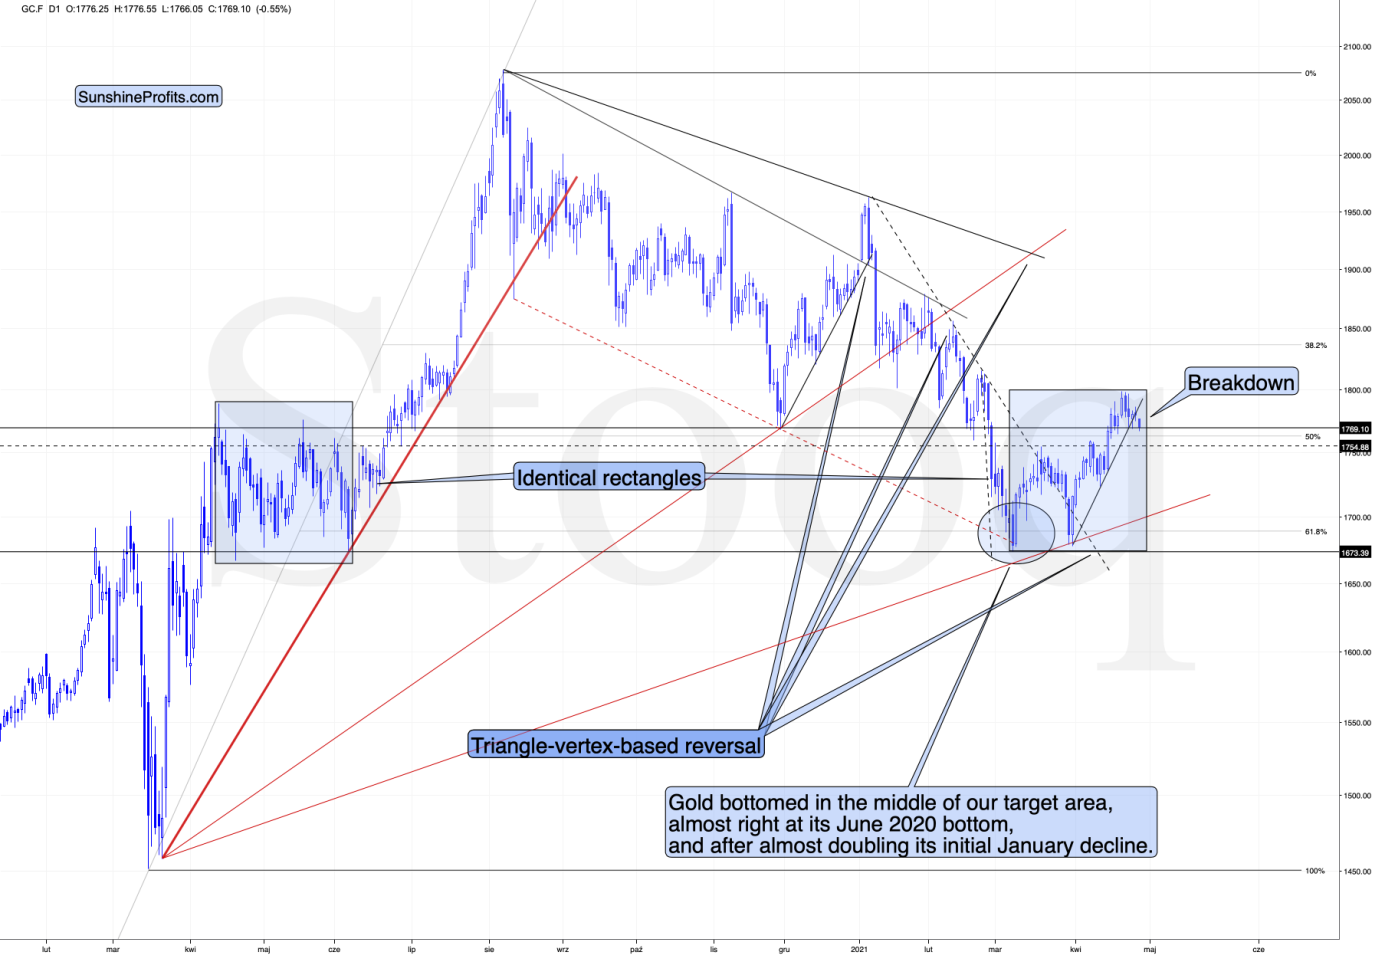
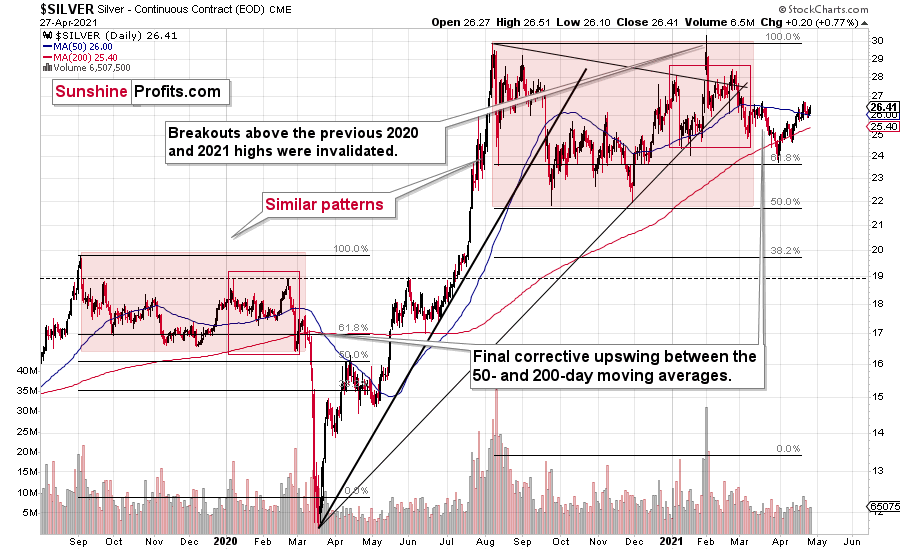
Now, the thing that I would like to add today is that we see a possibility of seeing a similar broad head-and-shoulders pattern in gold. I marked gold’s April – June 2020 performance with a blue rectangle, and I copied it to the current situation (the rectangles are identical). As you can see, the current price action and the recent short-term, corrective upswing are near-perfectly aligned.
Of course, back in 2020 the volatility was huge, and investors were very anxious due to the start of the pandemic-based lockdowns and their immediate follow-up. Consequently, it’s no wonder that back then we saw many back-and-forth movements, and this time – when investors calmed down – the correction is simply a zigzag.
We have an analogy in price and time, and a good reason to think that we shouldn’t have analogy in terms of shape. We can also see a breakdown in gold (and a breakout in the USD Index) suggesting that the correction is over.
Therefore, it’s likely that what we’re witnessing now will eventually (once gold moves to new yearly lows) turn out to be a broad head-and-shoulders pattern, with very bearish implications.
Relative Performance Sign
Those who have been following my analyses for some time know that right before bigger declines, the precious metals market tends to behave in a specific way. There’s also a specific way in which it behaves during a bottoming process. Consequently, I’m on a constant lookout for these relative signs in order to better forecast gold’s and silver’s outlook. The good news is that we just saw one, and it perfectly fits the rest of today’s analysis.
Namely, yesterday was the session during which the following happened at the same time:
Gold declined – but only slightly.
Gold stocks declined much more visibly, showing weakness relative to gold.
And silver showed strength by rallying somewhat.
This combination of silver’s outperformance of gold and mining stocks’ underperformance of gold is profoundly bearish for the short term. Consequently, it seems very likely to me that the corrective upswing in the precious metals market is already over and the final short-term top was formed last week.
Thank you for reading our free analysis today. Please note that the above is just a small fraction of the full analyses that our subscribers enjoy on a regular basis. They include multiple premium details such as the interim targets for gold and mining stocks that could be reached in the next few weeks. We invite you to subscribe now and read today’s issue right away.
Sincerely,
Przemyslaw Radomski, CFA
Founder, Editor-in-chief -
USDX, S&P GSCI: Flip It Upside Down and See How Gold Falls
April 27, 2021, 9:59 AMIt’s a dance of death between the USDX and S&P GSCI. When the former goes up, the latter does the exact opposite - and gold may follow.
Gold, silver, and mining stocks did next to nothing yesterday, and practically everything that I wrote previously remains up-to-date. Consequently, today’s technical part will be limited to just one chart – with one implication being both important and subtle – but today’s more fundamental part will be longer.
Let’s jump right into the chart featuring… The USD Index, as that’s the market that contains the important change.
The important change is that the situation relates to the USD’s 61.8% Fibonacci retracement.
Last week, I wrote the following:
I wouldn’t be surprised to see this weekend without any major reversal, but we could see one on Monday. Some traders won’t be able to adjust their stop-loss levels at that time, so if anyone “big” wants to squeeze the profits out of individual traders shorting the USDX before the latter rallies, it would be a perfect time. The idea could be to trigger a small sell-off early on Monday, which would then trigger stop-loss selling, and it would allow the “big” market participant to re-enter the long positions at lower prices.
The fact that the USD Index moved slightly below its very important short-term support (the 61.8% Fibonacci retracement) on Monday and that it invalidated this breakdown earlier today perfectly fits the above quote.
The invalidation of the breakdown is a bullish phenomenon, and even though the price moves are still small, they already suggest that a bigger rally is likely just around the corner. Naturally, the bullish situation in case of the USD Index has bearish implications for the precious metals market.
Having said that, let’s take a look at the markets from a more fundamental angle.
The Paradox of Inflation
Hiding in plain sight for the last several months, warnings of rising inflation have officially gone mainstream. Case in point: please see the headline from CNBC on Apr. 24:
 Source: CNBC
And while I’ve been warning about the prospect for some time now, when CNBC initiates coverage, you know that the cat is out of the bag. But why is rising inflation such an important variable when analyzing the PMs? Well, because higher inflation is a precursor to higher interest rates. And with the domino effect of rising input costs, leading to rising output prices, leading to a rising U.S. 10-Year Treasury yield … well, gold has nightmares just thinking about it.
Please see below:
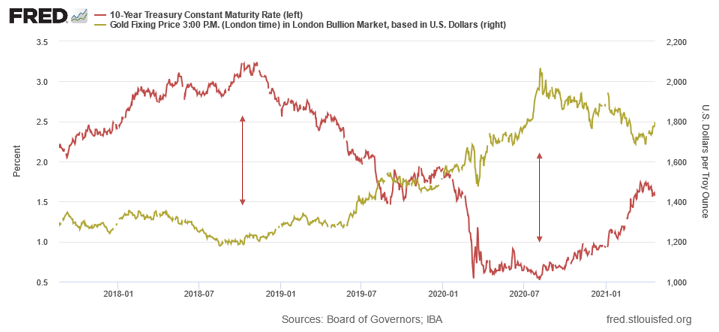
However, it’s important to remember that two different paths can lead to the same destination. On one side of the road, you have demand-pull inflation: this occurs when unemployment is low, prosperity is high, wages are rising, and corporate profits follow suit. On the other side of the road, cost-push inflation occurs when demand is dormant, but rising input costs lead to price hikes by corporate executives. Think about it: when faced with a dilemma of accepting lower profit margins or raising output prices, which path do you think they’ll choose?
Moreover, it’s no secret that the U.S. Federal Reserve (FED) has unleashed a tsunami of liquidity. In turn, the spending has also unleashed a tsunami of financial-market speculation. And when meme stocks like GameStop move from $4 to $400, it has no effect on the real economy. However, when excessive speculation cascades from the stock market to the commodities market, it has a profound effect on the real economy.
Case in point: lumber prices have risen by more than 356% over the last year (and are up by more than 200% from their pre-COVID 19 highs), while gasoline prices have risen by more than 205% (and are up by more than 18% from their pre-COVID 19 highs). If that wasn’t enough, corn prices have recently gone vertical, hitting ‘limit up’ on Apr. 26. For context, ‘limit up’ means that the contract rose so rapidly that regulators were forced to suspend trading for the day.
Please see below:
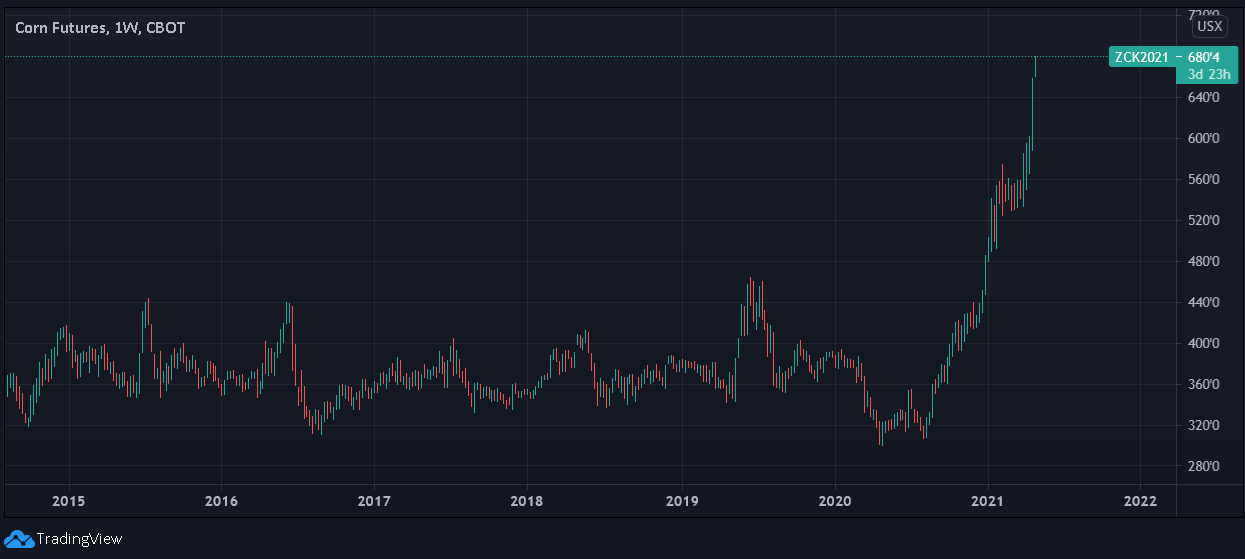
As a result, when destabilizing moves occur in the commodities market, manufacturers incur higher input costs, while consumers are also forced to pay more for finished goods.
The bottom line?
Unlike demand-pull inflation, where consumer spending leads to increased business investment and is followed by healthy inflation, the current environment is the exact opposite. With excessive speculation leading to explosions in the commodities market, rising inflation is occurring alongside extremely high unemployment.
Case in point: after investors celebrated April’s ‘blowout’ jobs report – with the unemployment rate falling to 6% – the zeitgeist proclaimed that the economic renaissance finally began. And with the economy ‘booming,’ what’s wrong with rising inflation expectations and a rising U.S. 10-Year Treasury yield?
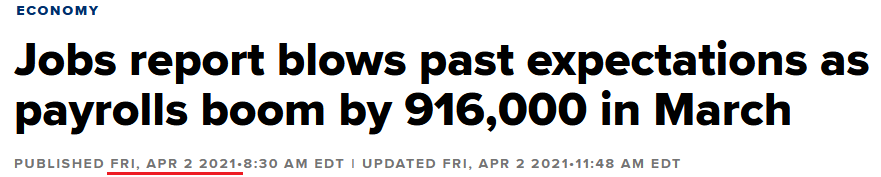 Source: CNBC
Well, like most fairy tales, they often require a lot of imagination. To explain, the FED believes that reverse-engineering a recovery – by letting prices lead economic activity – will give off the appearance of a demand-pull recovery. However, the reality on the ground is much different. If you analyze the chart below, you can see that the U.S. economy has only recovered 62% of the jobs lost during the pandemic.
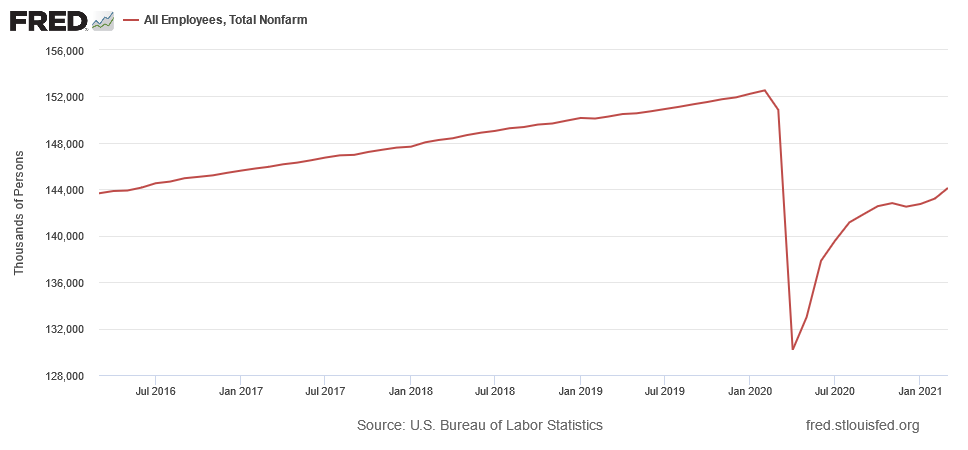
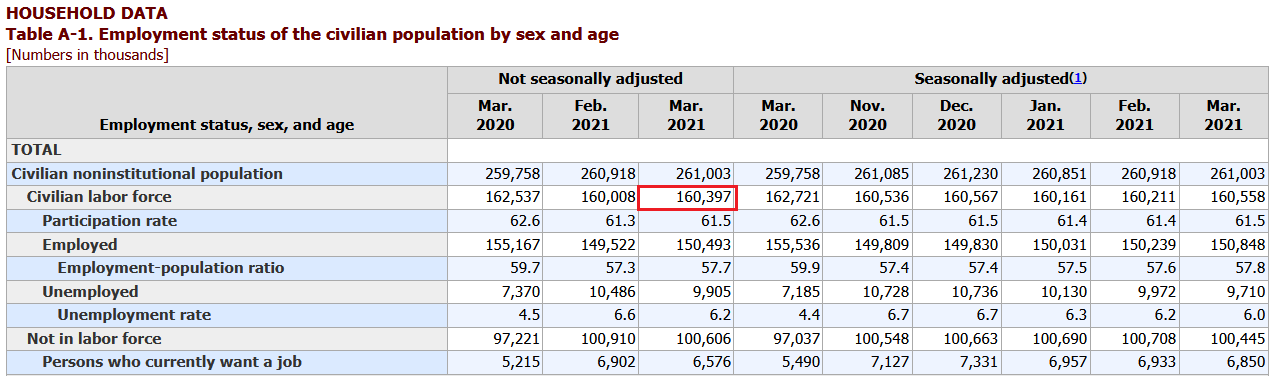
Even more accurate, the U.S. Bureau of Labor Statistics (BLS) revealed that the civilian labor force consists of more than 160 million people (as of March 2021).
 Source: BLS
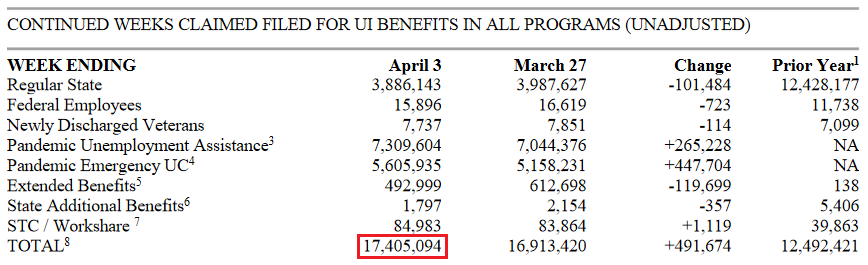
Likewise, the U.S. Department of Labor (DOL) revealed on Apr. 22 that more than 17 million people are still collecting some form of unemployment.
 Source: DOL
Thus, doing a little math (17.405/160.397) the real unemployment rate is 10.9% (rounded). Think about it: if the U.S. government eliminates the Pandemic Unemployment Assistance and Pandemic Emergency UC programs, do you think that nearly 14 million people will be boasting about a ‘booming’ economy?
Therefore, while I spend a lot of time discussing the prevalence and importance of inflation, it’s not because the U.S. is an economic utopia. Quite the contrary, the U.S. – like the Eurozone – is actually headed toward stagflation. For context, stagflation is a period of both high inflation and high unemployment. More importantly, though, once the illusion of demand-pull inflation is finally seen as its destructive twin, cost-push inflation, investors’ vision of a commodity super cycle could eventually fade to black. Gold would be likely to slide, at least initially, and then rally in the long run – just like it had done in the 1970s during the stagflationary environment.
To that point, gold may have already signaled its demise.
Please see below:
The Importance of the S&P GSCI
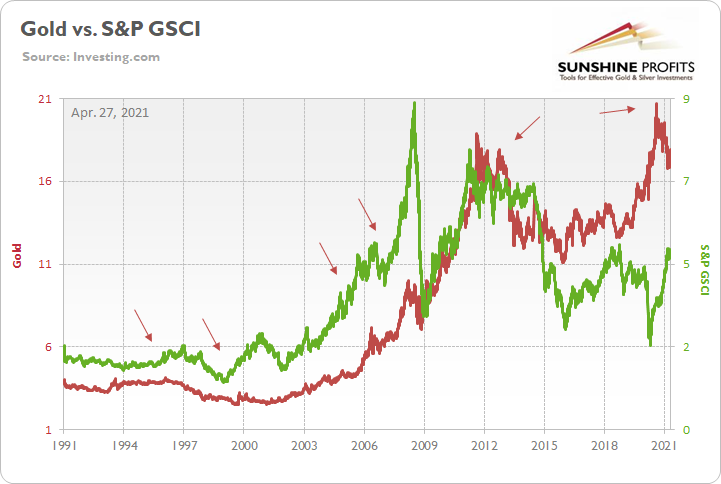
To explain, the red line above tracks the gold price, while the green line above tracks the S&P Goldman Sachs Commodity Index (S&P GSCI). For context, the S&P GSCI contains 24 commodities from all sectors: six energy products, five industrial metals, eight agricultural products, three livestock products and two precious metals. More importantly, though, gold has already sent an ominous signal. If you analyze the arrows above, you can see that gold nearly always peaks in advance of the S&P GSCI (except for in 2011).
In addition, the pair’s current behavior is mirroring their historical scripts. Back in 2020, gold bottomed on Mar. 18, while the S&P GSCI bottomed on Apr. 21. However, like their five historical analogues, the S&P GSCI has continued to make new highs, while gold peaked on Aug. 7. As a result, the yellow metal has already sounded the alarm.
Please see below:
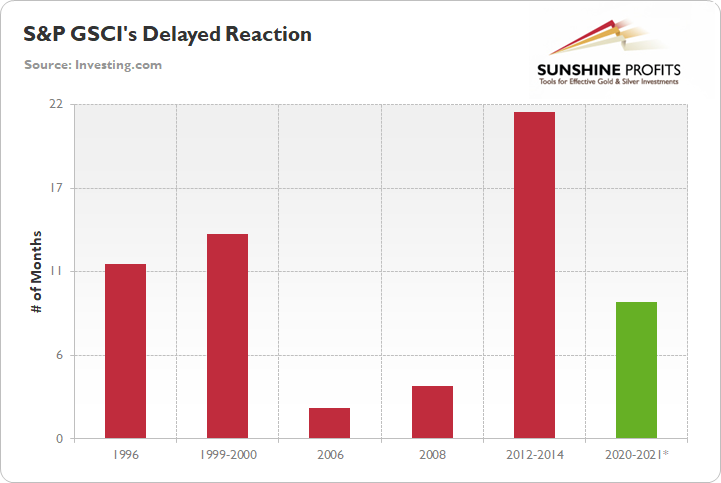
To explain, the red bars above depict the number of months between gold’s peak and the eventual peak in the S&P GSCI. As you can see, the data ranges from a follow-through of two months to a delay of 21 ½ months. However, with the S&P GSCI rolling over 11 ½ and 13 ½ months after gold in 1996 and 1999-2000, the current timeline – the S&P GSCI’s rally has gone on for roughly nine months (the green bar) – signals that a severe shock could occur over the medium term.
But why is the behavior of the S&P GSCI so important?
Well, if you analyze the chart below, you can see that the S&P GSCI’s pain is often the USD Index’s gain.
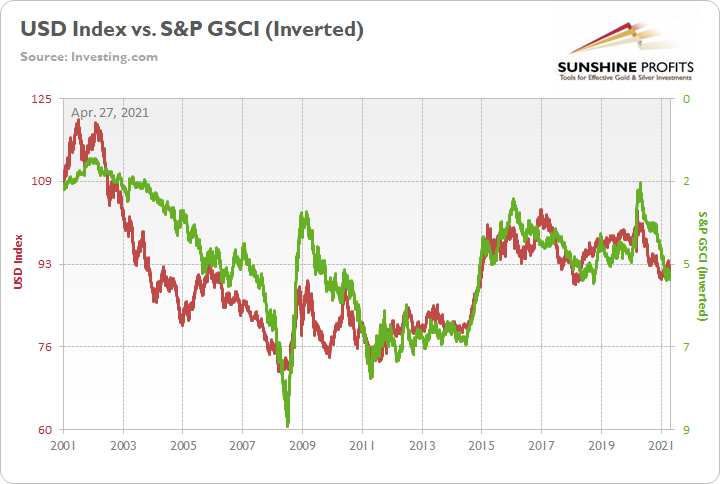
To explain, the red line above tracks the USD Index, while the green line above tracks the inverted S&P GSCI. For context, “inverted” means that the S&P GSCI’s scale is flipped upside down and that a rising green line represents a falling S&P GSCI, while a falling green line represents a rising S&P GSCI. More importantly, though, the two have a history of following in each other’s footsteps, and since 2010 it’s been almost a spitting image. As a result, if the S&P GSCI is about to meet its maker, a surging USD Index could eventually drop the guillotine on the PMs.
In addition, while the EUR/USD’s recent ascension has dollar bulls doubting their eyesight, the currency pair’s latest rerating is still fraught with peril. For one, it was less than four months ago that the EUR/USD was trading at 1.235. And despite the recent rise in optimism, the currency pair – which accounts for nearly 58% of the movement of the USD Index – is at a point where it needs to certify its status.
Please see below:
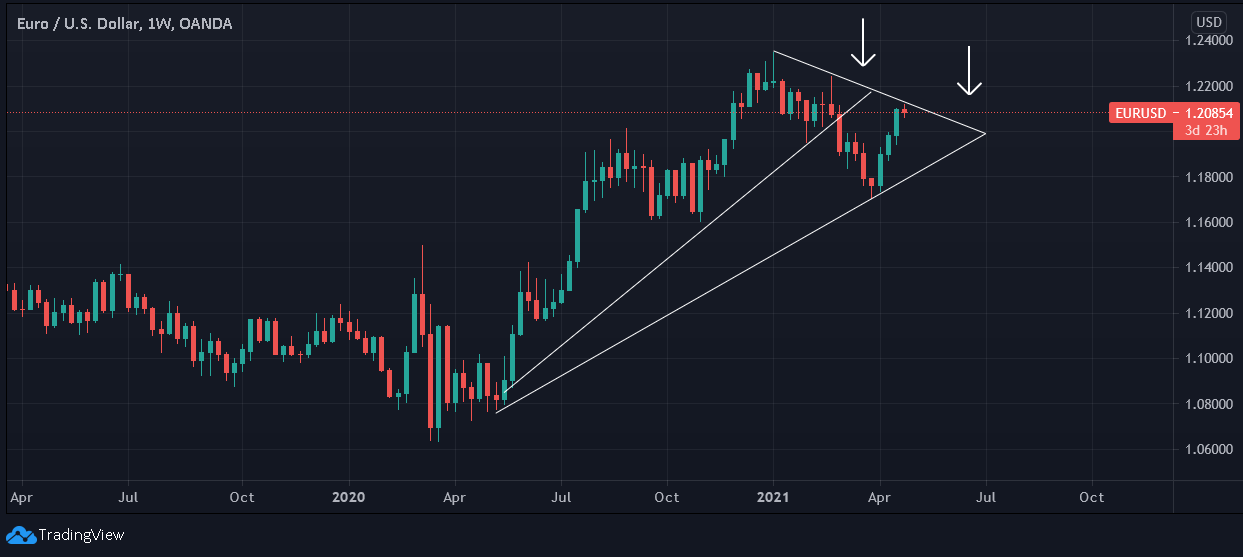
The European Connection
To explain, after attempting to break above its declining resistance line in February, the EUR/USD eventually rolled over and broke below its rising support line. Similarly, after approaching its declining resistance line again on Apr. 26, investors rejected the attempted breakthrough. As a result, the EUR/USD’s pathway higher has already become more difficult.
Furthermore, I’ve discussed at length the connection between the USD Index’s current price action and its 2017-2018 analogue. But not to be outdone, the EUR/USD is also following the same historical script.
Please see below:
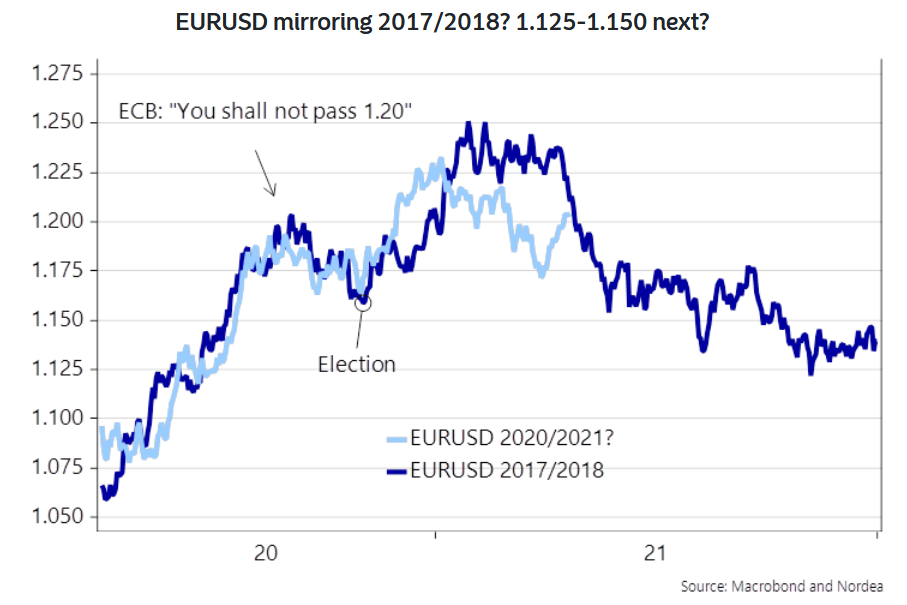
To explain, the light blue line above tracks the EUR/USD’s current price action, while the dark blue line above tracks the currency pair’s movement in 2017-2018. As you can see, up until recently, the EUR/USD was following the historical analogue to a tee. Moreover, while the light blue line has moved sharply higher in recent weeks, notice how fits and starts were also a part of the story in 2017-2018? If you analyze the middle of the chart, you can see that the dark blue line moved below 1.225 and above 1.250 before rolling over eventually. As a result, the current bounce from below 1.175 to above 1.200 is nothing to write home about.
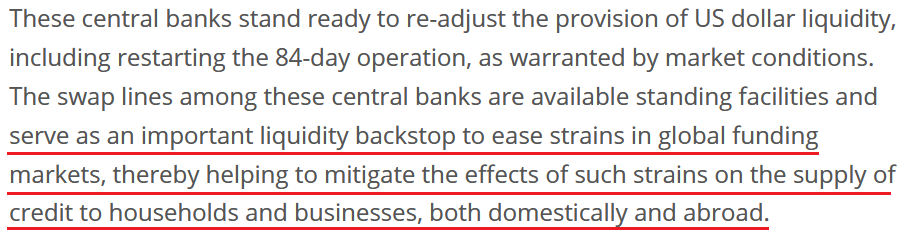
Furthermore, there seems to be some confusion about the European Central Bank’s (ECB) – and other major central banks’ – suspension of their 84-day U.S. dollar liquidity operations. For context, the swap facility was created to ensure that U.S. dollars remained abundant during the coronavirus crisis.
Please see below:
 Source: ECB
However, keep in mind that “an important liquidity backstop to ease strains in global funding markets,” is code for avoiding a large spike in the U.S. dollar. Essentially, if the swap lines didn’t exist in March 2020, global central banks would have been forced to purchase U.S. dollars on the open market. In turn, this would have increased the value of the USD Index. The bottom line? The suspension of the facility is not bearish for the greenback, if anything, it’s bullish because it reduces the available supply of U.S. dollars.
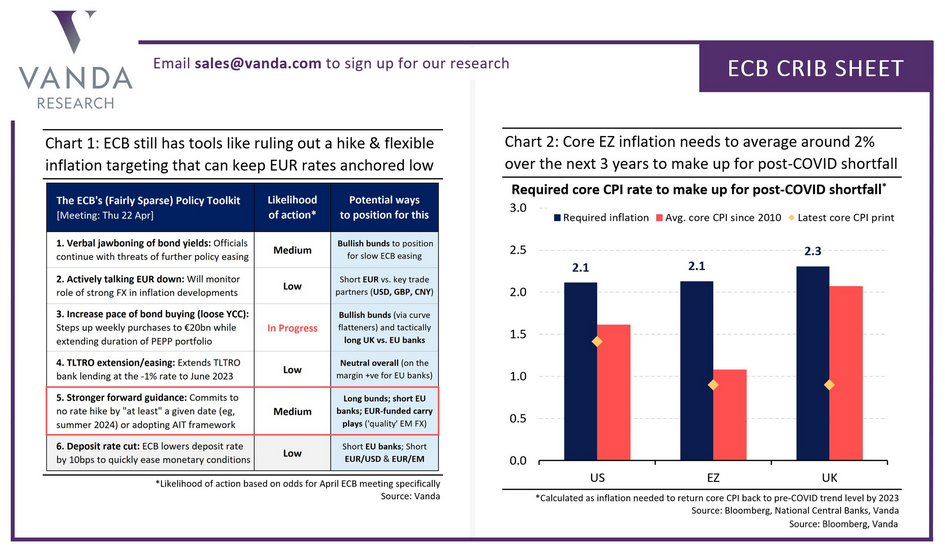
If that wasn’t enough, recent whispers of the ECB tapering its bond-buying program are extremely premature. With the European economy still drastically underperforming the U.S., it’s actually more likely that the ECB increases the pace of its bond-buying program. Case in point: while the EUR/USD ignores the reality, last week’s PEPP purchases (€22.2 billion) by the ECB were the highest since June 2020. Moreover, since its March meeting, the ECB has increased its average daily PEPP purchases per week from €2.90 billion to €3.60 billion.
Please see below:
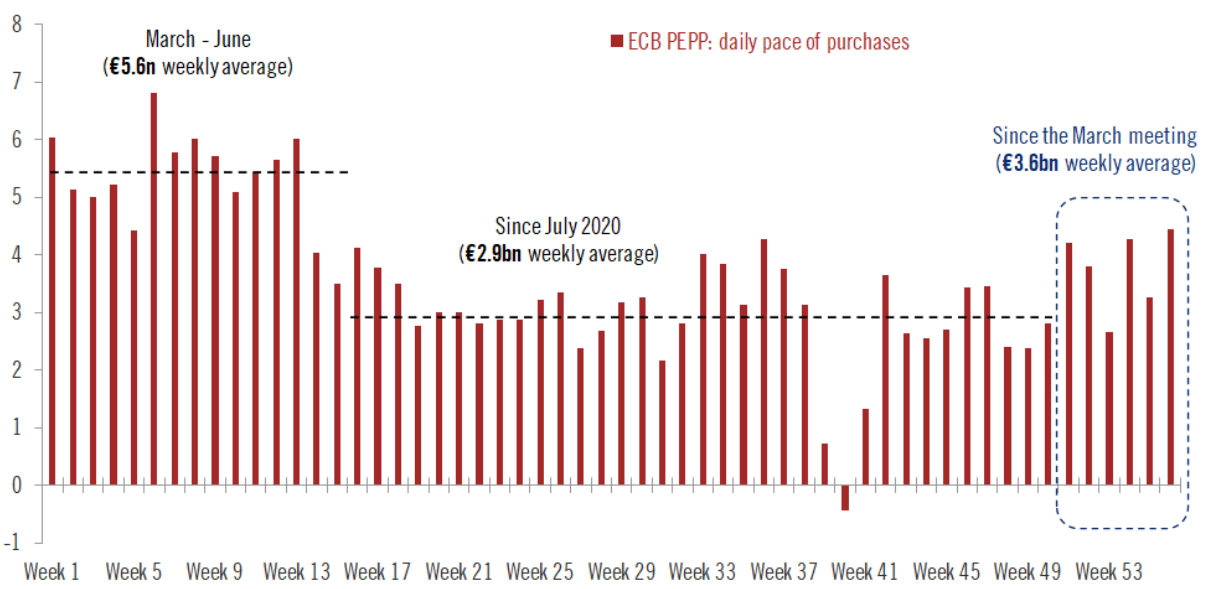 Source: ECB/Frederik Ducrozet
Likewise, with the ECB stuck between a rock and a hard place, the central bank is likely to elicit stronger forward guidance. For context, the ECB could pledge to keep interest rates low until a certain date or refuse to scale back its bond-buying program until other criteria have been met. And with the former making the euro an even more attractive funding currency for the carry trade, the prospect is fundamentally bearish for the EUR/USD.
Please see below:
For context, the carry trade is an arbitrage strategy where an investor borrows money in one currency and invests the proceeds in the bonds (usually) of another currency. In addition, because the carry trade incurs interest charges, lower Eurozone interest rates (relative to the U.S.) means that it’s cheaper to use the euro as the funding currency.
Regarding the Eurozone economy, future ‘expectations’ were the primary driver of the EUR/USD’s recent rally. With hope overpowering reality, the daily deluge of weak economic data was overruled by investors’ ‘optimism’ for the future. However, with the ifo Business Expectations Index – a monthly indicator of economic sentiment in Germany (Europe’s largest economy) – falling to 99.5 (from 100.3 and missing the consensus estimate of 101.2), even hope is beginning to fade.
Please see below:
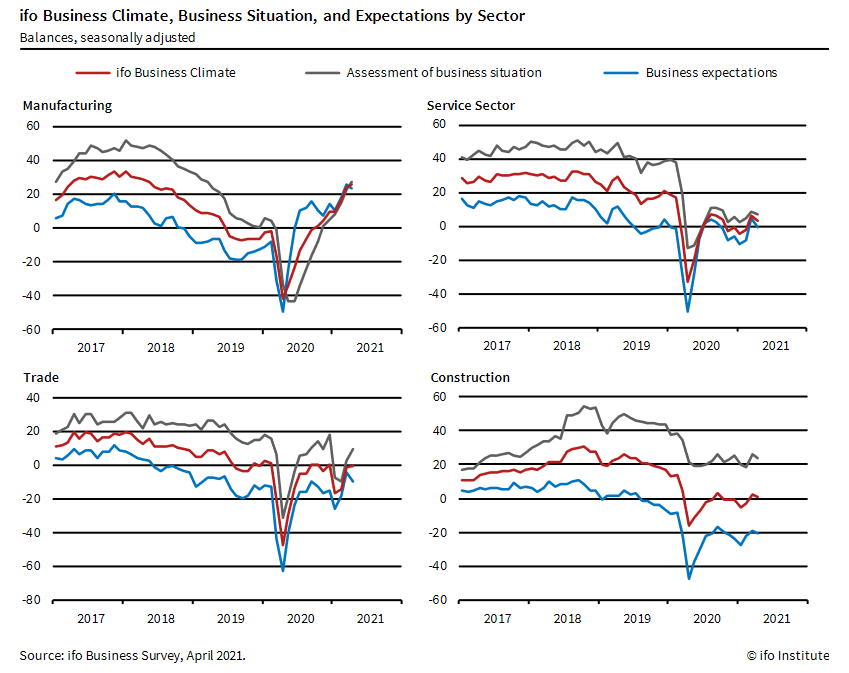
To explain, if you analyze the light blue lines on all four charts, notice how manufacturing, services, trade and construction expectations have all moved lower? Even more revealing, according to ifo, German businesses are “no longer quite so optimistic about the coming six months.”
Last but not least, not only is Bank of America short the EUR/USD and long the USD/JPY, but its Global Research team expects the USD Index to move “moderately higher” in the not-so-distant future.
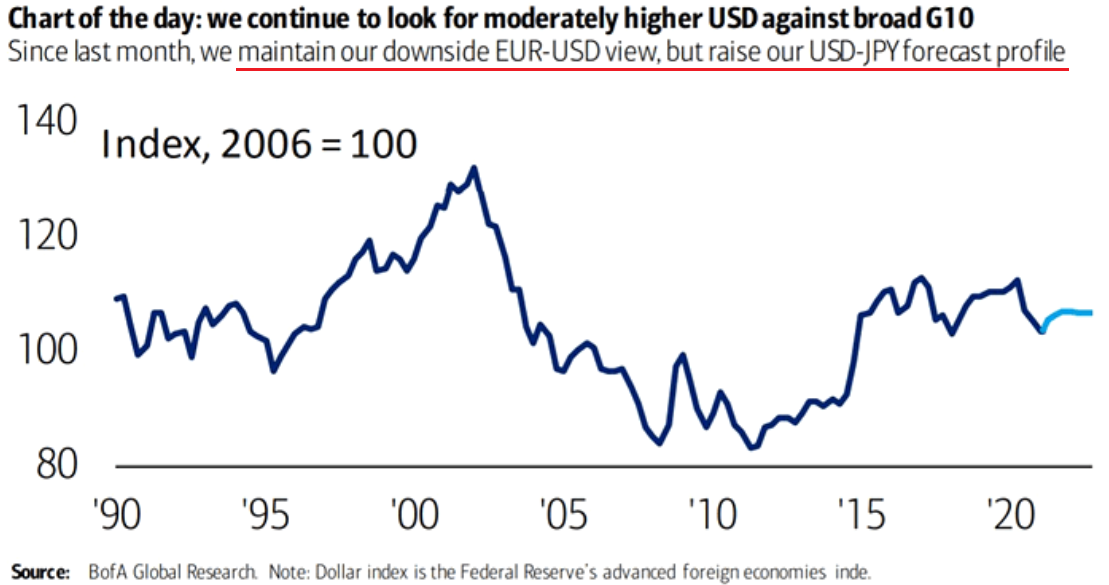
Please note that the price of gold is quite closely correlated with the performance of the USD/JPY pair (inversely), so – while they didn’t say it – in my opinion, the above could be translated into “Bank of America is now even more bearish on gold’s price than it was previously.”
In conclusion, while it may look like the USD Index is staring into the dead of night, as Gotham’s White Knight once said, “The night is darkest just before the dawn. And I promise you, the dawn is coming.” And while the sun currently shines on nearly every asset except for the greenback, the negative consequences of cost-push inflation signals that a material reversal could be on the horizon (in fact, it has already happened when looking at things from the medium-term point of view).
Moreover, with the PMs’ exhibiting a strong negative correlation with the U.S. dollar, the prospect is unlikely to elicit a positive response. The bottom line? With the PMs’ dodging bullets from the U.S. 10-Year Treasury yield and the USD Index liable to add further ammunition, their medium-term outlook remains bearish. However, once the financial markets resemble the realistic state of economic affairs, the PMs will be ready to shine once again.
Thank you for reading our free analysis today. Please note that the above is just a small fraction of the full analyses that our subscribers enjoy on a regular basis. They include multiple premium details such as the interim targets for gold and mining stocks that could be reached in the next few weeks. We invite you to subscribe now and read today’s issue right away.
Sincerely,
Przemyslaw Radomski, CFA
Founder, Editor-in-chief -
Gold Miners: Were Upswings Just an Exhausting Sprint?
April 26, 2021, 9:47 AMIndicators are pointing to gold and mining ETFs running out of breath. They don’t seem to have what it takes to the move to the finish line.
Despite gold, silver and mining stocks’ recent corrective upswings, the precious metals are running out of steam. After bursting off of the lows – while failing to recognize that it’s a marathon and not a sprint – the precious metals’ late-week breather signals that their stamina isn’t what it used to be.
Moreover, with false breakouts and sanguine sentiment causing an adrenaline rush that’s likely to fade, the precious metals’ transformation from stalwart to sloth could leave investors feeling increasingly dejected.
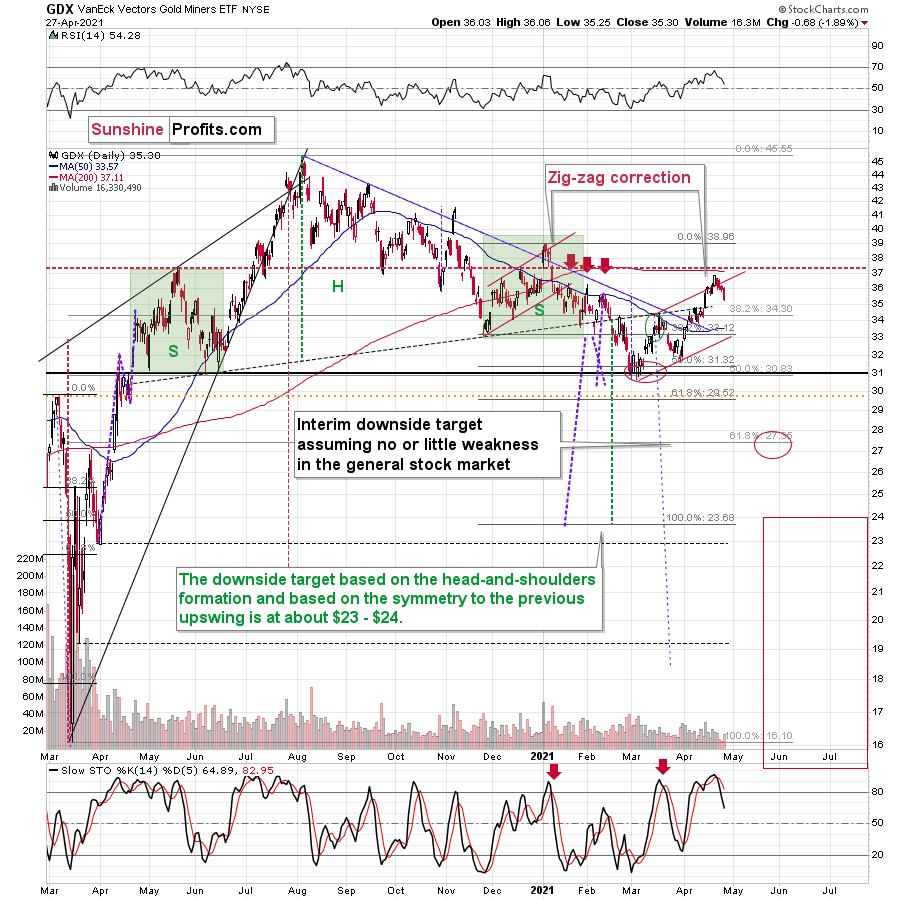
Case in point: with the HUI Index (a proxy for gold mining stocks) already verifying the breakdown below the neckline of its bearish H&S pattern – which didn’t occur until later in 2008 – the miners’ outlook is actually more bearish now than it was then.
Please see below:

To explain, note that the 2007 – 2008 and the 2009 – 2012 head and shoulders patterns didn’t have the right shoulders all the way up to the line that was parallel to the line connecting the bottoms. I marked those lines with green in the above-mentioned formations. In the current case, I marked those lines with orange. Now, in both cases, the final top – the right shoulder – formed close to the price where the left shoulder topped. And in early 2020, the left shoulder topped at 303.02.
That’s why I previously wrote that “it wouldn’t be surprising to see a move to about 300 in the HUI Index”. And that’s exactly what we saw – the recent high was slightly above 299.
This means that the recent rally is not a game-changer, but rather a part of a long-term pattern that’s not visible when one focuses on the short-term only.
The thing is that the vast majority of individual investors and – sadly – quite many analysts focus on the trees while forgetting about the forest. During the walk, this might result in getting lost, and the implications are no different in the investment landscape.
From the day-to-day perspective, a weekly – let alone monthly – rally seems like a huge deal. However, once one zooms out and looks at the situation from a broad perspective, it’s clear that:
“What has been will be again, what has been done will be done again; there is nothing new under the sun.” (-Ecclesiastes 1:9)
The rally is very likely the right shoulder of a broad head and shoulders formation. “Very likely” and not “certainly”, because the HUI Index needs to break to new yearly lows in order to complete the pattern – for now, it’s just potential. However, given the situation in the USD Index (i.a. the positions of futures traders as seen in the CoT report, and the technical situation in it), it seems very likely that this formation will indeed be completed. Especially when (not if) the general stock market tumbles.
In addition, three of the biggest declines in the mining stocks (I’m using the HUI Index as a proxy here), all started with broad, multi-month head-and-shoulders patterns. And in all three cases, the size of the decline exceeded the size of the head of the pattern.
Can we see gold stocks as low as we saw them last year? Yes.
Can we see gold stocks even lower than at their 2020 lows? Again, yes.
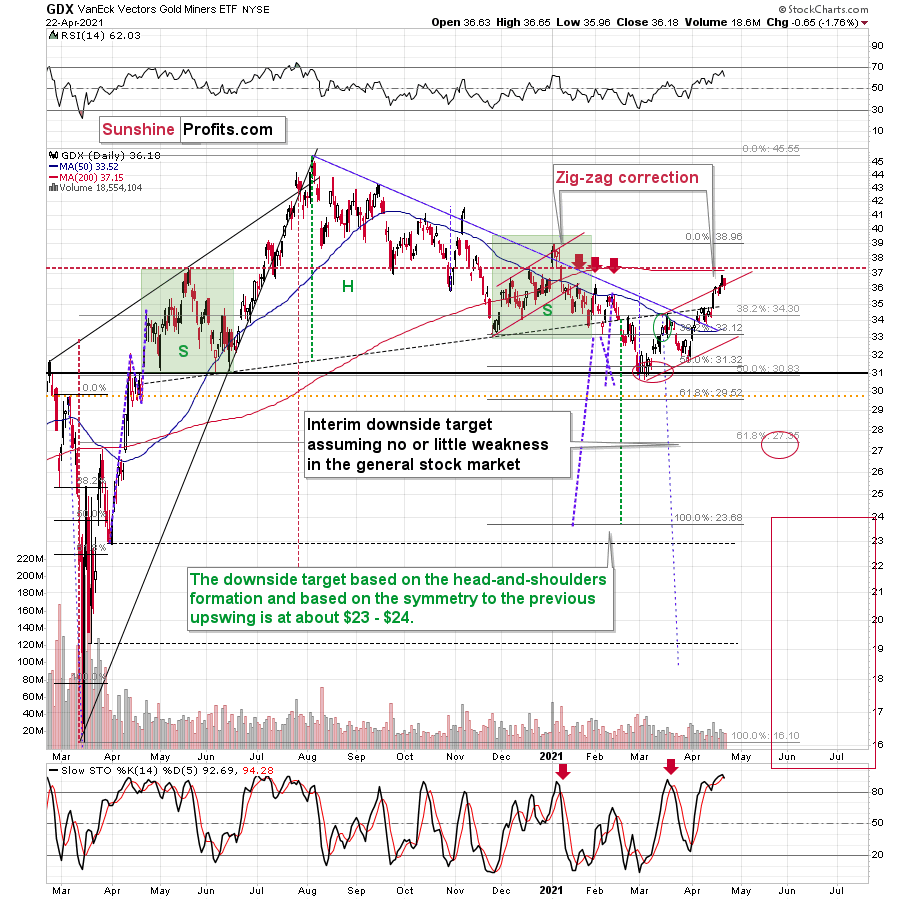
Of course, it’s far from being a sure bet, but the above chart shows that it’s not irrational to expect these kind of price levels before the final bottom is reached. This means that a $24 target on the GDX ETF is likely conservative.
In addition, mining stocks are currently flirting with two bearish scenarios:
- If things develop as they did in 2000 and 2012-2013, gold stocks are likely to bottom close to their early 2020 high.
- If things develop like in 2008 (which might be the case, given the extremely high participation of the investment public in the stock market and other markets), gold stocks could re-test (or break slightly below) their 2016 low.
I know, I know, this seems too unreal to be true… But wasn’t the same said about silver moving below its 2015 bottom in 2020? And yet, it happened.
Keep in mind though: scenario #2 most likely requires equities to participate. In 2008 and 2020, the sharp drawdowns in the HUI Index coincided with significant drawdowns of the S&P 500. However, with the words ‘all-time high’ becoming commonplace across U.S. equities, the likelihood of a three-peat remains relatively high.
Senior Miners: GDX ETF
Moving on to the GDX ETF, the senior miners were unable to hold the upper trendline of their corrective zigzag pattern. Similar to the price action in late 2020/early 2021, the GDX ETF rallied slightly above the upper trendline of its roughly one-and-a-half-month channel before eventually rolling over. More importantly, though, the GDX ETF’s failure in early 2021 ended up being a prelude to the senior miners’ severe drawdown.
Please see below:
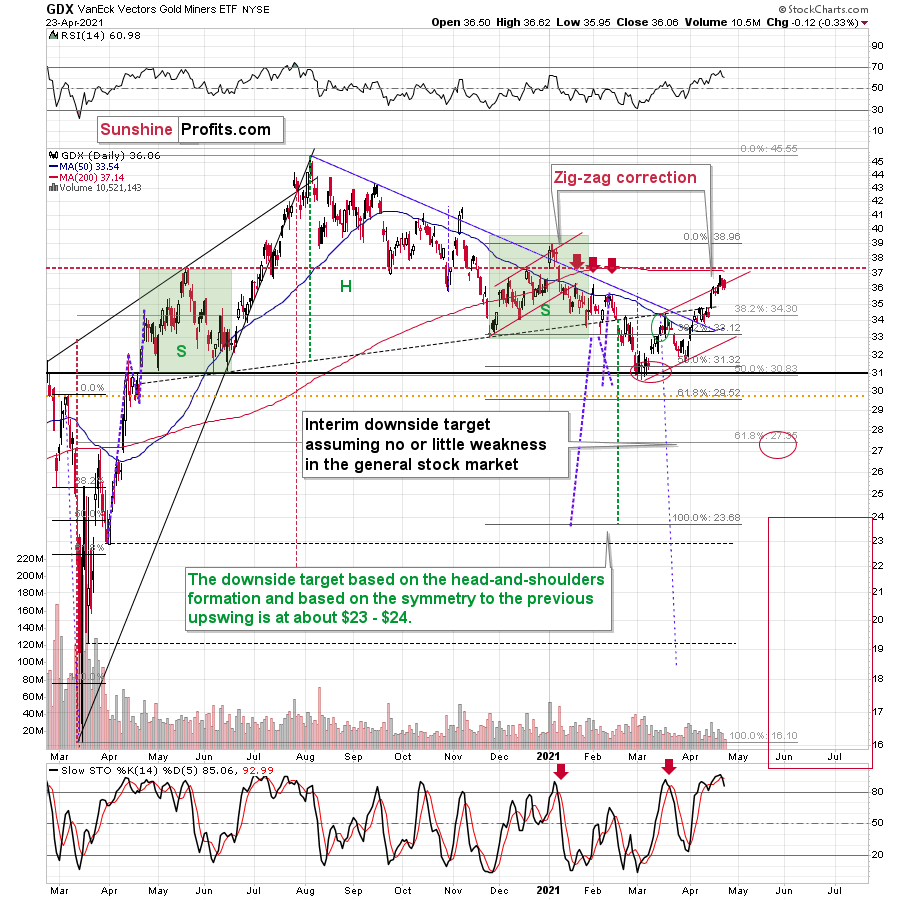
Furthermore, with the senior miners likely to peak in the coming days, the GDX ETF is poised to move from the right shoulder of its bearish H&S pattern. Following in the HUI Index’s footsteps, the GDX ETF’s correction back to the high of its left shoulder signals that the upward momentum has likely run its course.
If that wasn’t enough, the GDX ETF’s stochastic oscillator is also flashing a clear sell signal. If you analyze the two red arrows positioned at the bottom of the chart above, you can see that the black line has once again crossed the red line from above. As a result, the GDX ETF’s days are likely numbered.
Junior Miners: GDXJ ETF
As further evidence on this bearish scenario, let’s take a look at other proxies for the mining stocks. When analyzed through the lens of the GDXJ ETF, the junior miners remain significant underperformers.
Please see below:
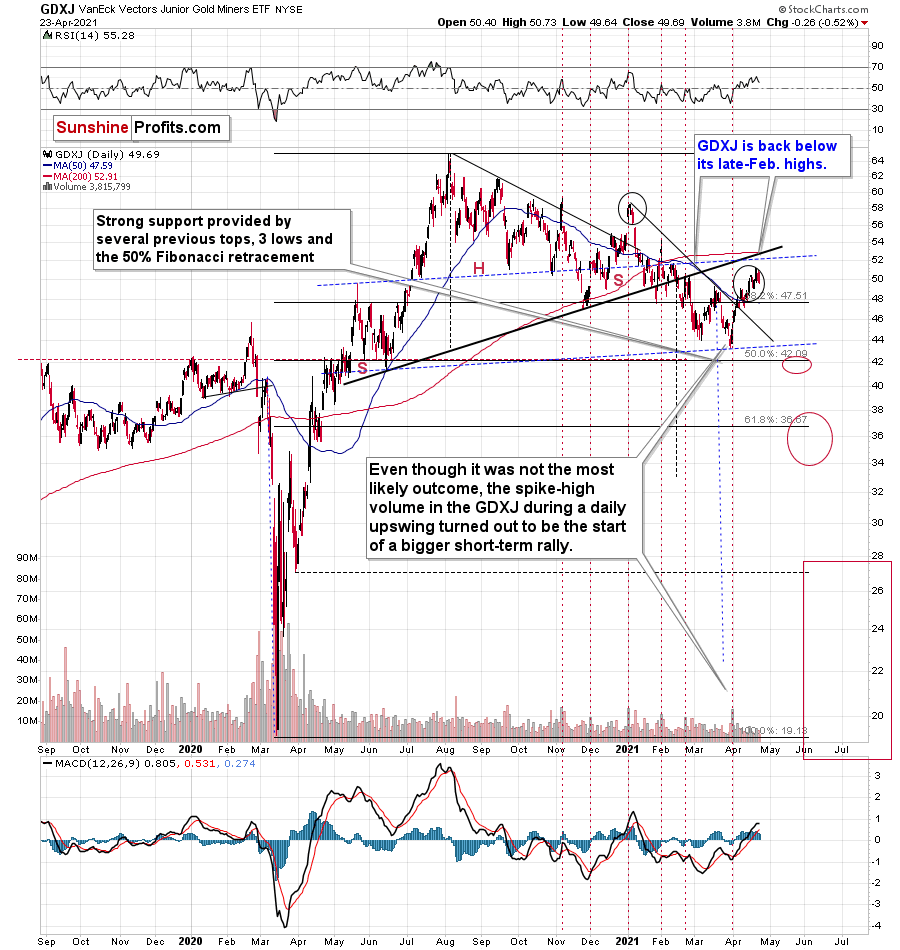
To explain, the GDXJ ETF is now back below its late-Feb. highs - please note how weak it remains relative to other proxies for mining stocks. Unlike the HUI or the GDX, the GDXJ didn’t move visibly above its late-Feb. highs and it had already invalidated this small breakout.
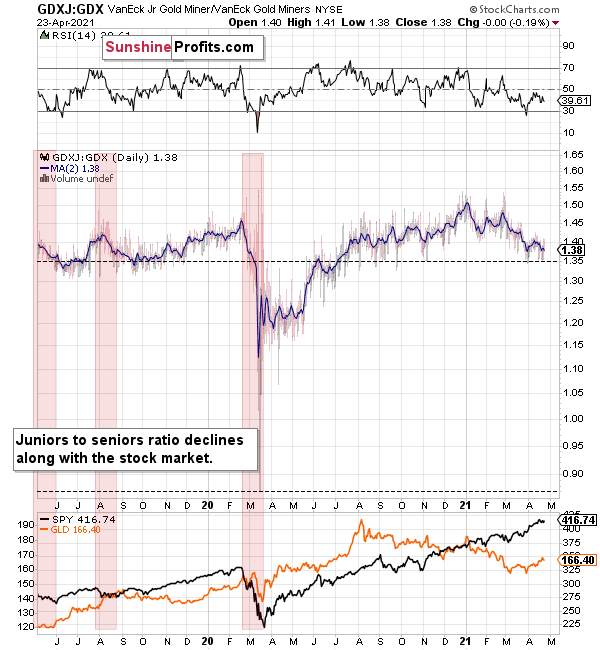
Moreover, the GDXJ/GDX ratio has been declining since the beginning of the year, which is remarkable because the general stock market hasn’t plunged yet. This tells us that when stocks finally slide, the ratio is likely to decline in a truly profound manner – perhaps similarly to what we saw last year.
So, how low could the GDXJ ETF go?
Well, absent an equity rout, the juniors could form an interim bottom in the $34 to $36 range. Conversely, if stocks show strength, juniors could form the interim bottom higher, close to the $42.5 level. For context, the above-mentioned ranges coincide with the 50% and 61.8% Fibonacci retracement levels and the GDXJ ETF’s previous highs (including the late-March/early-April high in case of the lower target area). Thus, the S&P 500 will likely need to roll over for the weakness to persist beyond these levels.
Also, contrasting the GDX ETF’s false breakout, both the HUI and the XAU indices ended the week below the necklines of their previous (based on the rising necklines) bearish H&S patterns. Moreover, if you analyze the right side of the charts below, while both the HUI and XAU indices initially bounced above their necklines, investors quickly sold the rallies.
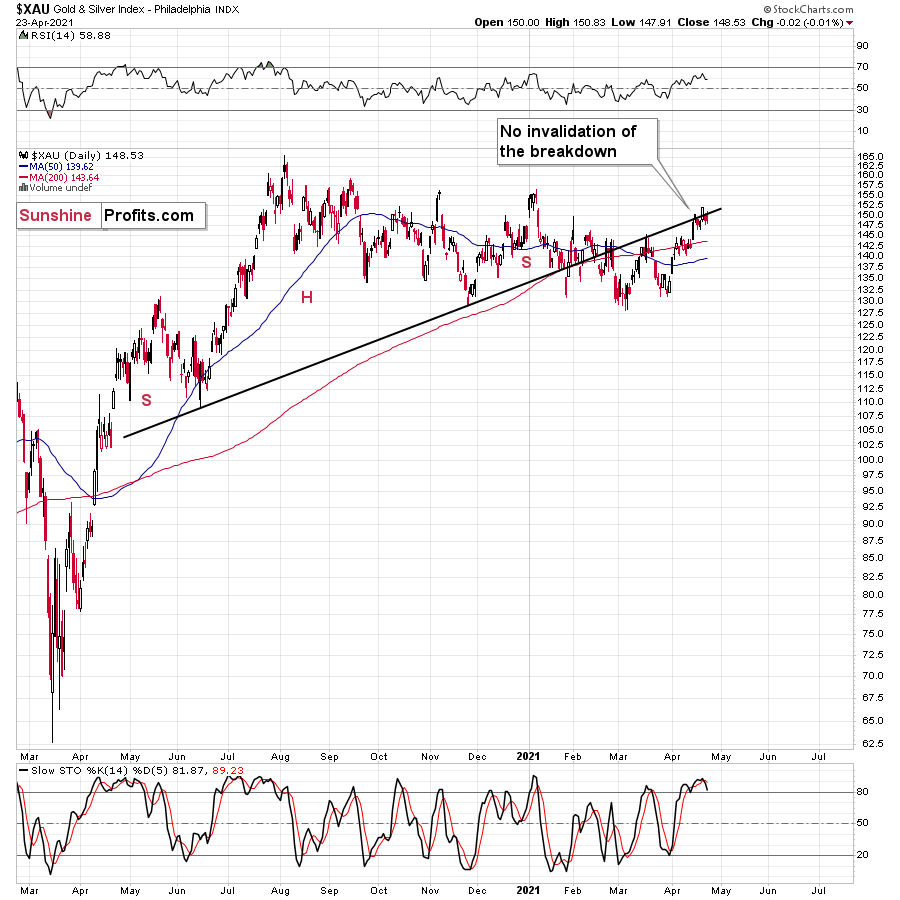
Mirroring the GDX ETF, both indices are also eliciting sell signals from their stochastic oscillators. And with the GDX ETF the only wolf still howling at the moon, expect the senior miners to follow the rest of the pack lower in the near future.
Also, eliciting bearish undertones, the HUI Index/S&P 500 ratio has recorded a major, confirmed breakdown. And with the ratio nowhere near recapturing its former glory, it’s another sign that the GDX ETF is a significant outlier.
Please see below:
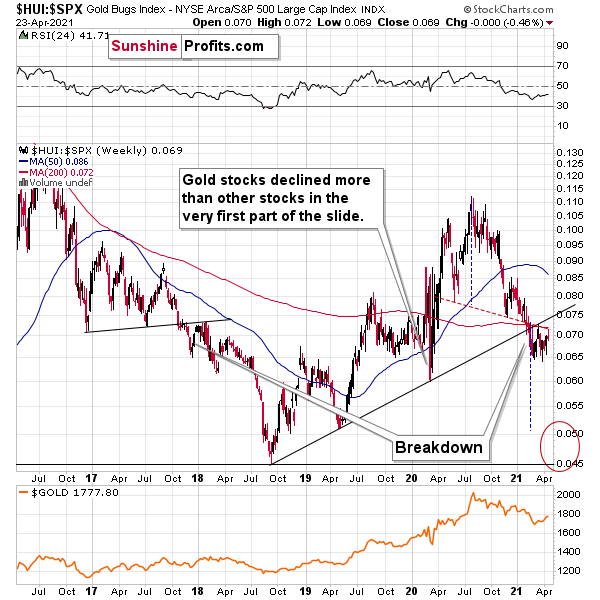
When the ratio presented on the above chart above is rising, it means that the HUI Index is outperforming the S&P 500. When the line above is falling, it means that the S&P 500 is outperforming the HUI Index. If you analyze the right side of the chart, you can see that the ratio has broken below its rising support line. For context, the last time a breakdown of this magnitude occurred, the ratio plunged from late-2017 to late-2018. Thus, the development is profoundly bearish.
Playing out as I expected, a sharp move lower was followed by a corrective upswing back to the now confirmed breakdown level (which is now resistance). Mirroring the behavior that we witnessed in early 2018, after breaking below its rising support line, the HUI Index/S&P 500 ratio rallied back to the initial breakdown level (which then became resistance) before suffering a sharp decline. And with two-thirds of the analogue already complete, the current move lower still has plenty of room to run. Likewise, the early-2018 top in the HUI Index/S&P 500 ratio is precisely when the USD Index began its massive upswing. Thus, with history likely to rhyme, the greenback could spoil the miners’ party once again.
In addition, the HUI to S&P 500 ratio broke below the neck level (red, dashed line) of a broad head-and-shoulders pattern and it verified this breakdown by moving temporarily back to it. The target for the ratio based on this formation is at about 0.05 (slightly above it). Consequently, if the S&P 500 doesn’t decline, the ratio at 0.05 would imply the HUI Index at about 196. However, if the S&P 500 declined to about 3,200 or so (its late-2020 lows) and the ratio moved to about 0.05, it would imply the HUI Index at about 160 – very close to its 2020 lows.
All in all, the implications of mining stocks’ relative performance to gold and the general stock market are currently bearish.
But if we’re headed for a GDX ETF cliff, how far could we fall?
Well, there are three reasons why the GDX ETF might form an interim bottom at roughly ~$27.50 (assuming no big decline in the general stock market):
- The GDX ETF previously bottomed at the 38.2% and 50.0% Fibonacci retracement levels. And with the 61.8% level next in line, the GDX ETF is likely to garner similar support.
- The GDX ETFs late-March 2020 high should also elicit buying pressure.
- If we copy the magnitude of the late-February/early-March decline and add it to the early-March bottom, it corresponds with the GDX ETF bottoming at roughly $27.50.
Keep in mind though: if the stock market plunges, all bets are off. Why so? Well, because when the S&P 500 plunged in March 2020, the GDX ETF moved from $29.67 to below $17 in less than two weeks. As a result, U.S. equities have the potential to make the miners’ forthcoming swoon all the more painful.
The Gold Miners Bullish Percent Index ($BPGDM)
As another reliable indicator (in addition to the myriads of signals coming not only from mining stocks, but from gold, silver, USD Index, stocks, their ratios, and many fundamental observations) the Gold Miners Bullish Percent Index ($BPGDM) isn’t at levels that trigger a major reversal. The Index is now approaching 47. However, far from a medium-term bottom, the latest reading is still more than 37 points above the 2016 and 2020 lows.
Back in 2016 (after the top), and in March 2020, the buying opportunity didn’t present itself until the $BPGDM was below 10.
Thus, with the sentiment still relatively elevated, it will take more negativity for the index to find the true bottom.
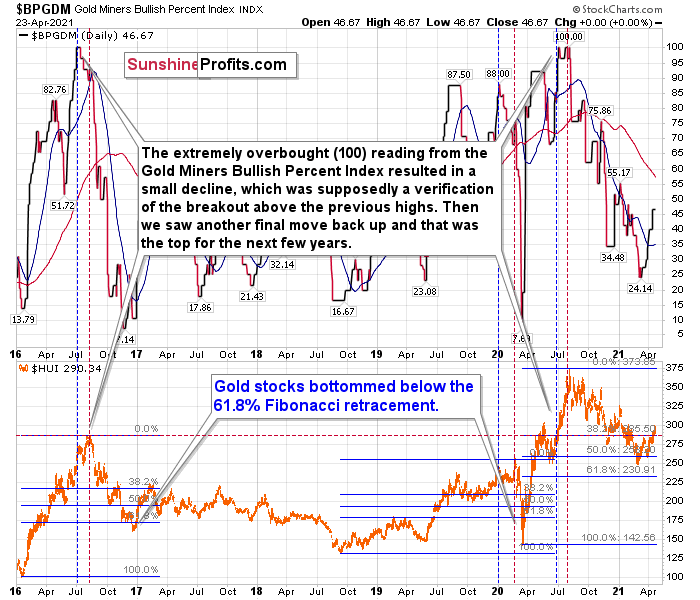
The excessive bullishness was present at the 2016 top as well and it didn’t cause the situation to be any less bearish in reality. All markets periodically get ahead of themselves regardless of how bullish the long-term outlook really is. Then, they correct. If the upswing was significant, the correction is also quite often significant.
Please note that back in 2016, there was an additional quick upswing before the slide and this additional upswing caused the $BPGDM to move up once again for a few days. It then declined once again. We saw something similar also in the middle of 2020. In this case, the move up took the index once again to the 100 level, while in 2016 this wasn’t the case. But still, the similarity remains present.
Back in 2016, when we saw this phenomenon, it was already after the top, and right before the big decline. Based on the decline from above 350 to below 280, we know that a significant decline is definitely taking place.
But has it already run its course?
Well, in 2016 and early 2020, the HUI Index continued to move lower until it declined below the 61.8% Fibonacci retracement level. The emphasis goes on “below” as this retracement might not trigger the final bottom. Case in point: back in 2020, the HUI Index undershot the 61.8% Fibonacci retracement level and gave back nearly all of its prior rally. And using the 2016 and 2020 analogues as anchors, this time around, the HUI Index is likely to decline below 231. In addition, if the current decline is more similar to the 2020 one, the HUI Index could move to 150 or so, especially if it coincides with a significant drawdown of U.S. equities.
The NASDAQ
Circling back to the NASDAQ Composite, the unwinding of excessive speculation could deliver a fierce blow to the gold miners. Case in point: when the dot-com bubble burst in 2000, the NASDAQ lost nearly 80% of its value, while the gold miners lost more than 50% of their value.
Please see below:
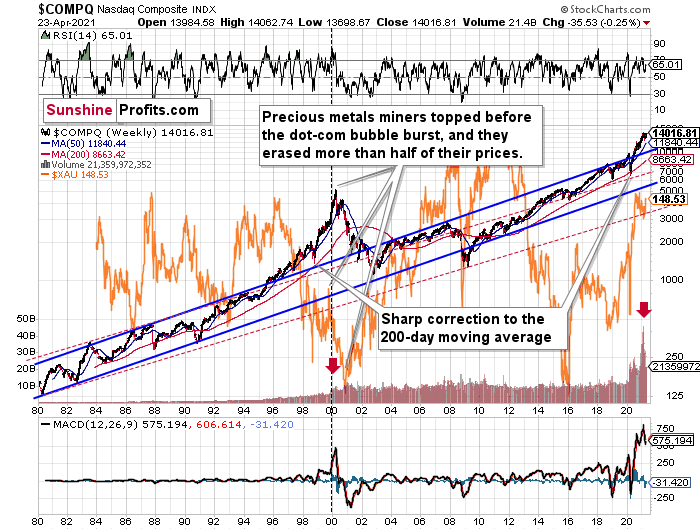
Right now, the two long-term channels above (the solid blue and red dashed lines) show that the NASDAQ is trading well above both historical trends.
Back in 1998, the NASDAQ’s last hurrah occurred after the index declined to its 200-day moving average (which was also slightly above the upper border of the rising trend channel marked with red dashed lines).
And what happened in the first half of 2020? Well, we saw an identical formation.
The similarity between these two periods is also evident if one looks at the MACD indicator. There has been no other, even remotely similar, situation where this indicator would soar so high.
Furthermore, and because the devil is in the details, the gold miners’ 1999 top actually preceded the 2000 NASDAQ bubble bursting. It’s clear that miners (the XAU Index serves as a proxy) are on the left side of the dashed vertical line, while the tech stock top is on its right side. However, it’s important to note that it was stocks’ slide that exacerbated miners’ decline. Right now, the mining stocks are already declining, and the tech stocks continue to rally. Two decades ago, tech stocks topped about 6 months after miners. This might spoil the party of the tech stock bulls, but miners topped about 6 months ago…
Also supporting the 2000 analogue, today’s volume trends are eerily similar. If you analyze the red arrows on the chart above, you can see that the abnormal spike in the MACD indicator coincided with an abnormal spike in volume. Thus, mounting pressure implies a cataclysmic reversal could be forthcoming.
Interestingly, two decades ago, miners bottomed more or less when the NASDAQ declined to its previous lows, created by the very first slide. We have yet to see the “first slide” this time. But, if the history continues to repeat itself and tech stocks decline sharply and then correct some of the decline, when they finally move lower once again, we might see THE bottom in the mining stocks. Of course, betting on the above scenario based on the XAU-NASDAQ link alone would not be reasonable, but if other factors also confirm this indication, this could really take place.
Either way, the above does a great job at illustrating the kind of link between the general stock market and the precious metals market (gold, silver, and mining stocks) that I expect to see also this time. PMs and miners declined during the first part of the stocks’ (here: tech stocks) decline, but then they bottomed and rallied despite the continuation of stocks’ freefall.
Even more ominous, the MACD indicator is now flashing a clear sell signal. And because the current reading is analogous to the one that preceded the dot-com bust, the NASDAQ Composite – and indirectly, the PMs – continues to sail toward the perfect storm.
With all of that said: how will we know when a medium-term buying opportunity presents itself?
We view price target levels as guidelines and the same goes for the Gold Miners Bullish Percent Index (below 10), but the final confirmation will likely be gold’s strength against the ongoing USDX rally. At many vital bottoms in gold, that’s exactly what happened, including the March bottom.
In conclusion, with the gold miners running low on strength, stamina and staying power, their fragile foundation is already crumbling beneath the surface. With the HUI, XAU and GDXJ proxies unable to match wits with the GDX ETF, the lone survivor is unlikely to put up much of a fight going forward. Moreover, with the USD Index poised to bounce off of the 61.8% Fibonacci retracement level (the precious metals have a strong negative correlation with the U.S. dollar), the foursome are likely to huff and puff their way to lower prices. However, after a period of medium-term recovery, the precious metals will be ready to run with the bulls once again.
Thank you for reading our free analysis today. Please note that the above is just a small fraction of the full analyses that our subscribers enjoy on a regular basis. They include multiple premium details such as the interim targets for gold and mining stocks that could be reached in the next few weeks. We invite you to subscribe now and read today’s issue right away.
Sincerely,
Przemyslaw Radomski, CFA
Founder, Editor-in-chief -
Will Treasury Yield’s Climb Cause Gold’s Fall?
April 23, 2021, 9:22 AMWith its inverse correlation with the yellow metal, the next move in the 10-Year-Treasury yield can cause gold to have a rough time.
Gold declined yesterday (Apr. 22), and the GDXJ is back below its late-Feb. highs. All things considered, the rallies in both appear to be over or almost over.
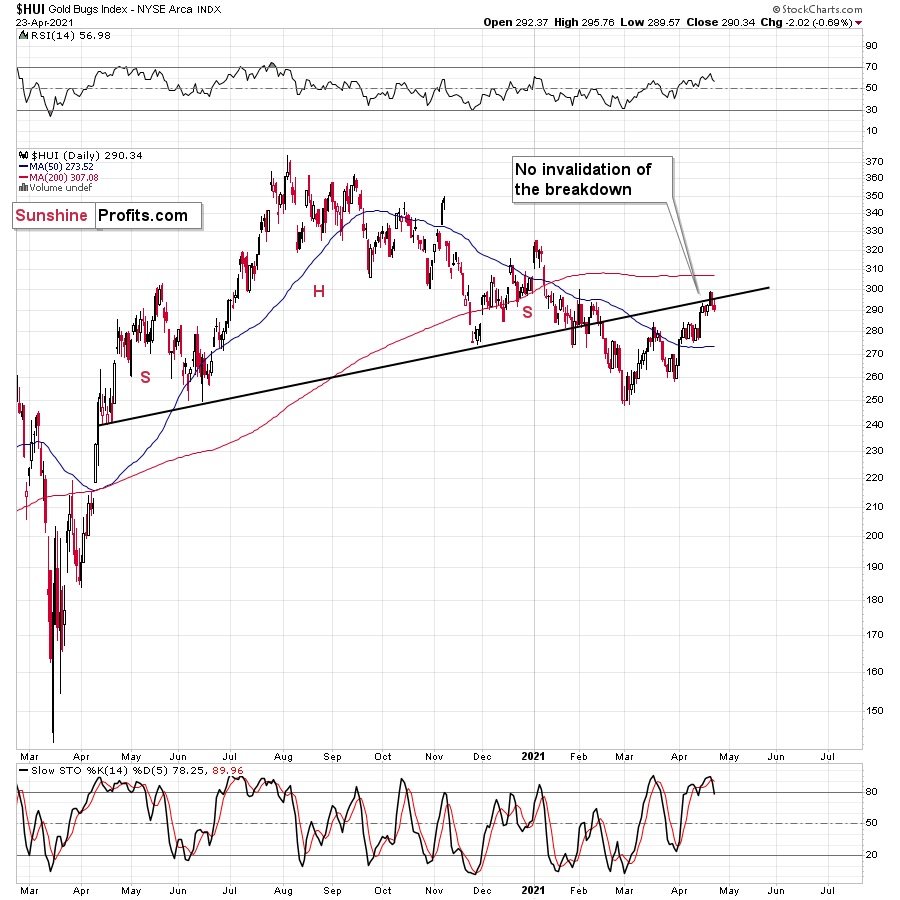
Just as I did yesterday, I will start the analysis with the long-term picture of the HUI Index – the flagship proxy for gold stocks.

Please note that the 2007 – 2008 and the 2009 – 2012 head and shoulders pattern didn’t have the right shoulders all the way up to the line that was parallel to the line connecting the bottoms. I marked those lines with green in the above-mentioned formations. In the current case, I marked those lines with orange.
Now, even though the above wasn’t the case, in both cases, the final top – the right shoulder formed close to the price where the left shoulder topped. The left shoulder that formed in early 2020 topped at 303.02.
I previously wrote that it wouldn’t be surprising to see a move to about 300 in the HUI Index, and that’s exactly what we saw – this week’s high was slightly above 299.
This means that the recent rally is not a game-changer, but rather a part of a long-term pattern that’s not visible when one focuses on the short-term only.
The thing is that the vast majority of individual investors and – sadly – quite many analysts focus on the trees while forgetting about the forest. During the walk, this might result in getting lost, and the implications are no different in the investment landscape.
From the day-to-day perspective, a weekly – let alone monthly – rally seems like a huge deal. However, once one zooms out and looks at the situation from a broad perspective, it’s clear that:
What has been will be again, what has been done will be done again; there is nothing new under the sun. (-Ecclesiastes 1:9)
The rally is very likely the right shoulder of a broad head and shoulders formation. “Very likely” and not “certainly”, because the HUI Index needs to break to new yearly lows in order to complete the pattern – for now, it’s just potential. However, given the situation in the USD Index (i.a. the positions of futures traders as seen in the CoT report, and the technical situation in it), it seems very likely that this formation will indeed be completed. Especially when (not if) the general stock market tumbles.
Miners: GDX and GDXJ
As far as the GDX ETF is concerned, I previously wrote that it could move slightly above $37, and even if it did, it would not invalidate the broad head and shoulders pattern. Well, the GDX didn’t move to $37, but it was quite near to doing so. It was close enough for this rally to be very similar to what we saw in May, 2020.
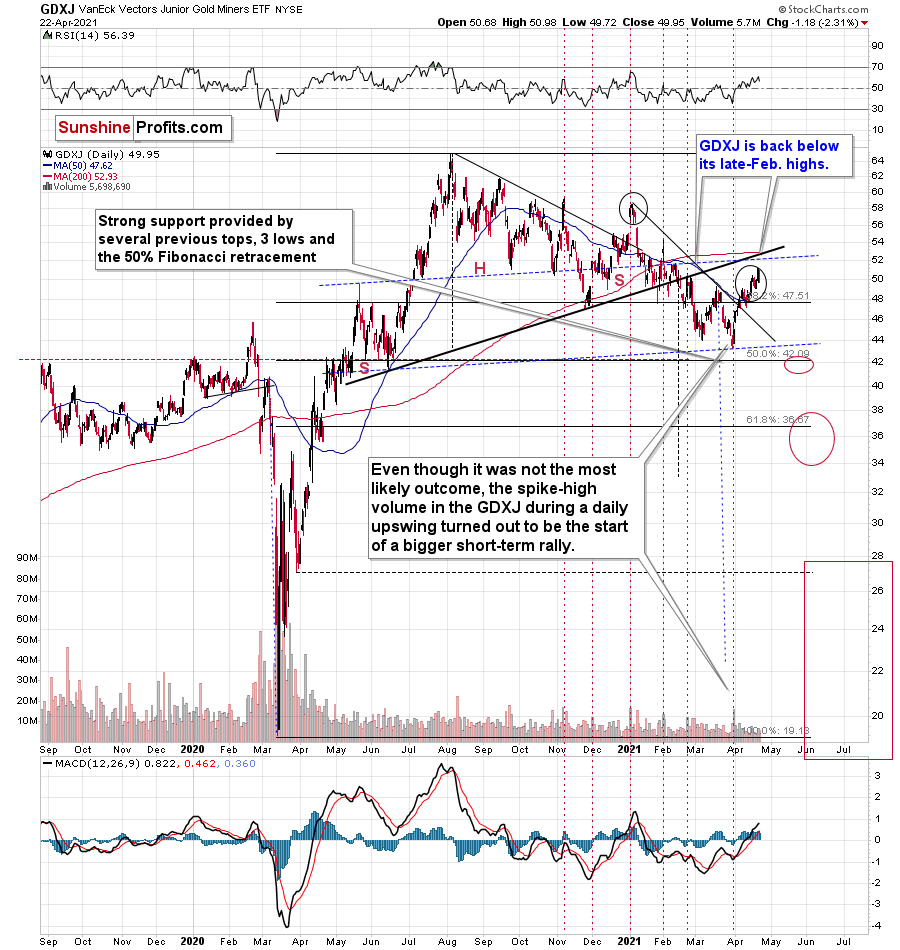
The GDXJ – a proxy for junior mining stocks – declined yesterday, and it’s now back below its late-Feb. highs - please note how weak it remains relative to other proxies for mining stocks. Unlike the HUI or the GDX, the GDXJ didn’t move visibly above its late-Feb. highs and it had already invalidated this small breakout.
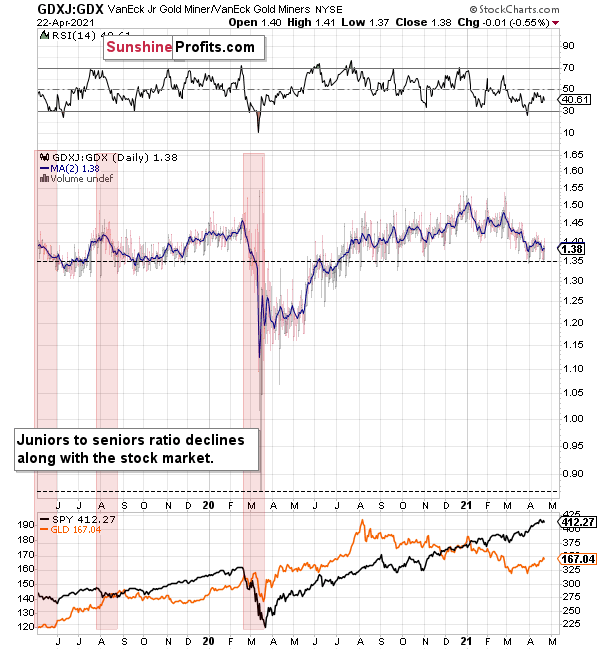
The ratio between the two ETFs has been declining since the beginning of the year, which is remarkable because the general stock market hasn’t plunged yet. This tells us that when stocks finally slide, the ratio is likely to decline in a truly profound manner – perhaps similarly to what we saw last year.
Gold: Is the Top In?
Now, as far as gold is concerned, we saw a move lower after an attempt to rally above the psychologically important (due to it being a round number) $1,800 level and the 300-day moving average (at $1,801.39).
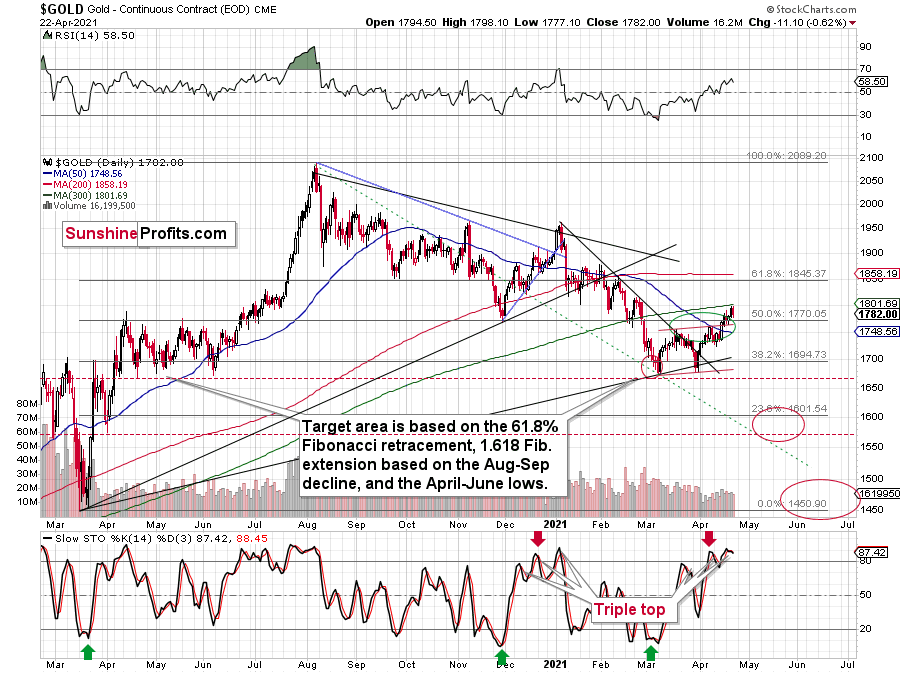
The sell signal in the stochastic indicator continues to signal that gold is about to move much lower – just like it did in early 2021.
This perfectly fits the scenario in which the HUI Index will start to decline soon, thus completing the broad head and shoulders formation so similar to the patterns that triggered the massive 2008 and 2013 slides.
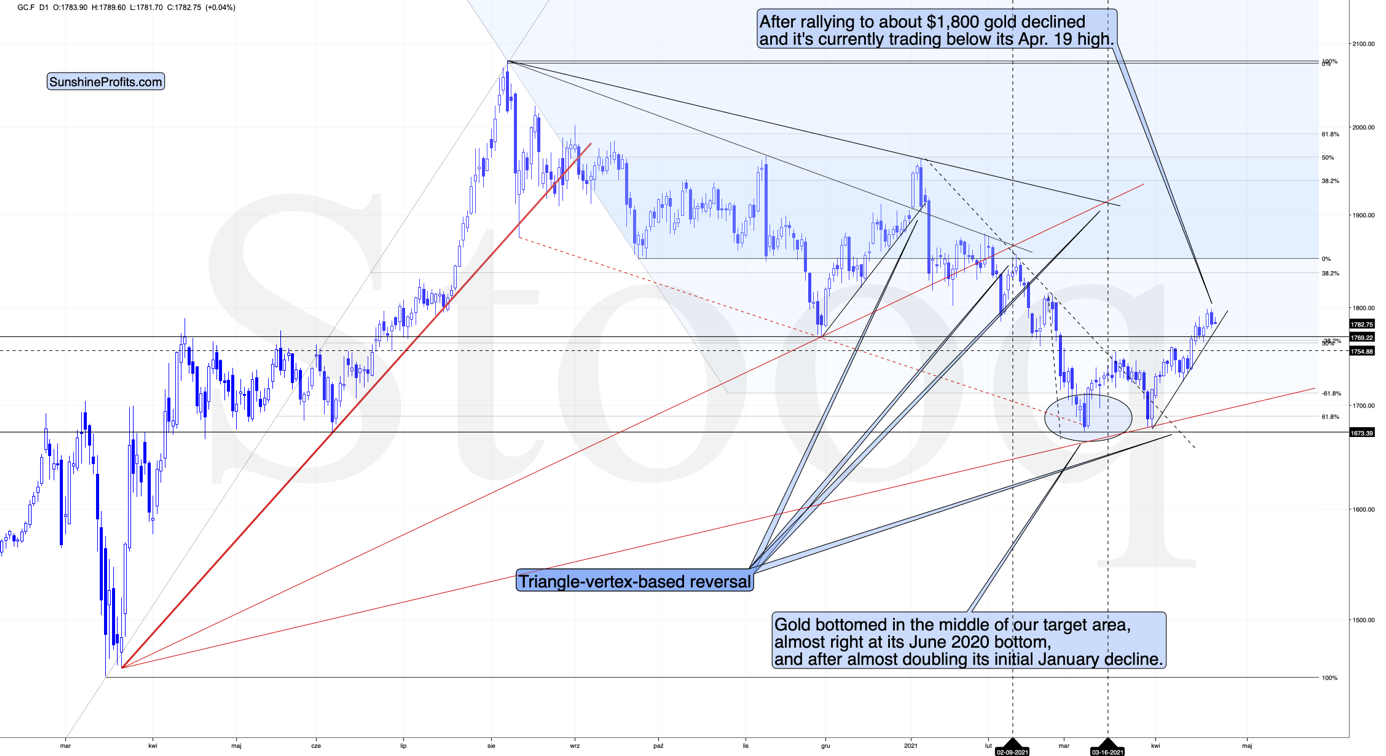
Interestingly, gold didn’t rally today despite the pre-market lowering in the USD Index, which suggests that the top might have already been formed.
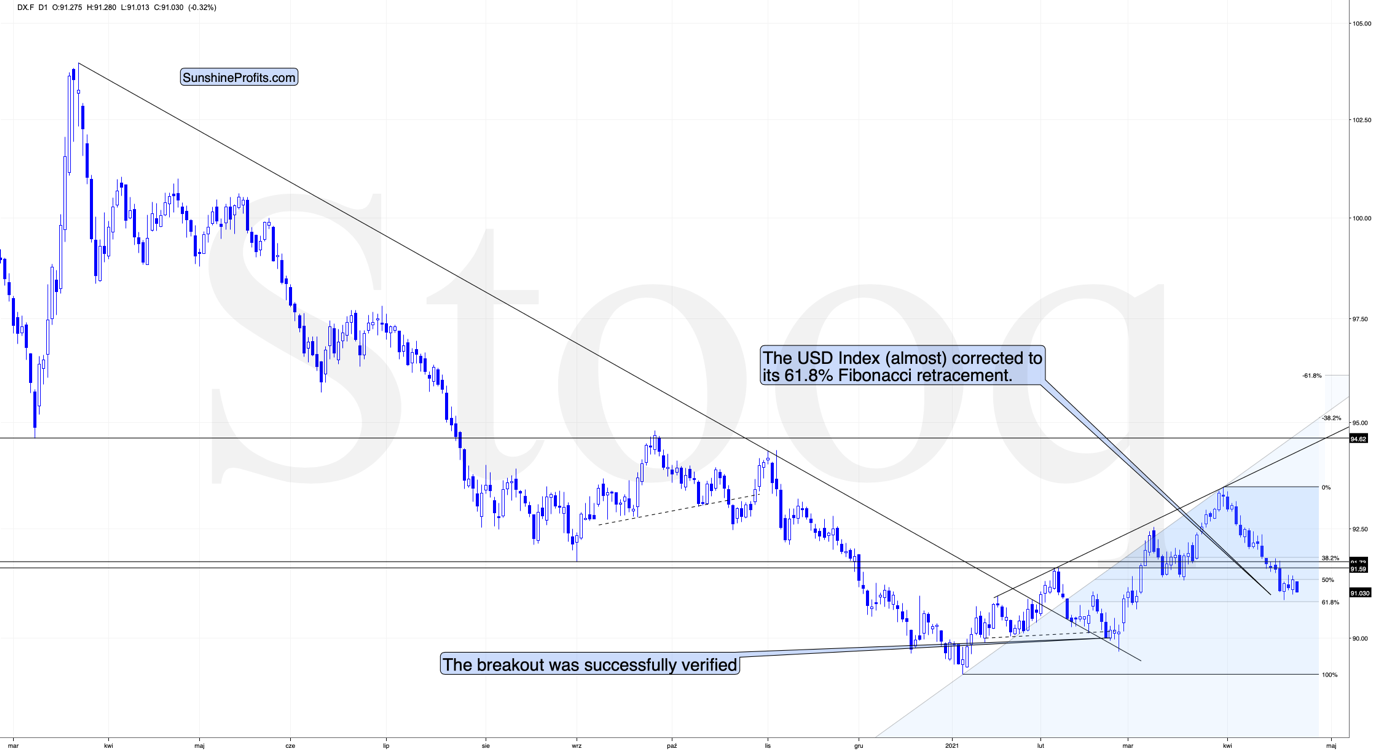
USD Index
Indeed, the USD Index declined once again, and traders likely thought that the short-term correction was over, so they got back in the sell-USDX mood. However, the 61.8% Fibonacci retracement was not broken, and, consequently, it’s likely to stop the current attempt to move lower once again.
Please note that during the previous important short-term bottom – in late Feb. 2021 – the USD Index’s bottom took a few days and ended with a very brief – intraday – slide. This was the thing that triggered the next big upswing in the USDX, and the sizable downswing in the PMs. This time the following rally is likely to be even bigger.
I wouldn’t be surprised to see this weekend without any major reversal, but we could see one on Monday. Some traders won’t be able to adjust their stop-loss levels at that time, so if anyone “big” wants to squeeze the profits out of individual traders shorting the USDX before the latter rallies, it would be a perfect time. The idea could be to trigger a small sell-off early on Monday, which would then trigger stop-loss selling, and it would allow the “big” market participant to re-enter the long positions at lower prices. I’m not saying that it’s the most likely scenario, though, only that it wouldn’t surprise me to see something like that.
Having said that, let’s take a look at the markets from a more fundamental angle:
The Ball Is In Your Court
With a late-afternoon freak-out on Apr. 22 – incited by U.S. President Joe Biden’s rumored increase in the region’s capital gains tax – ushering gold back below $1,790, investors’ ‘get me out of here’ attitude was the first real bout of volatility that we’ve witnessed in over a month.
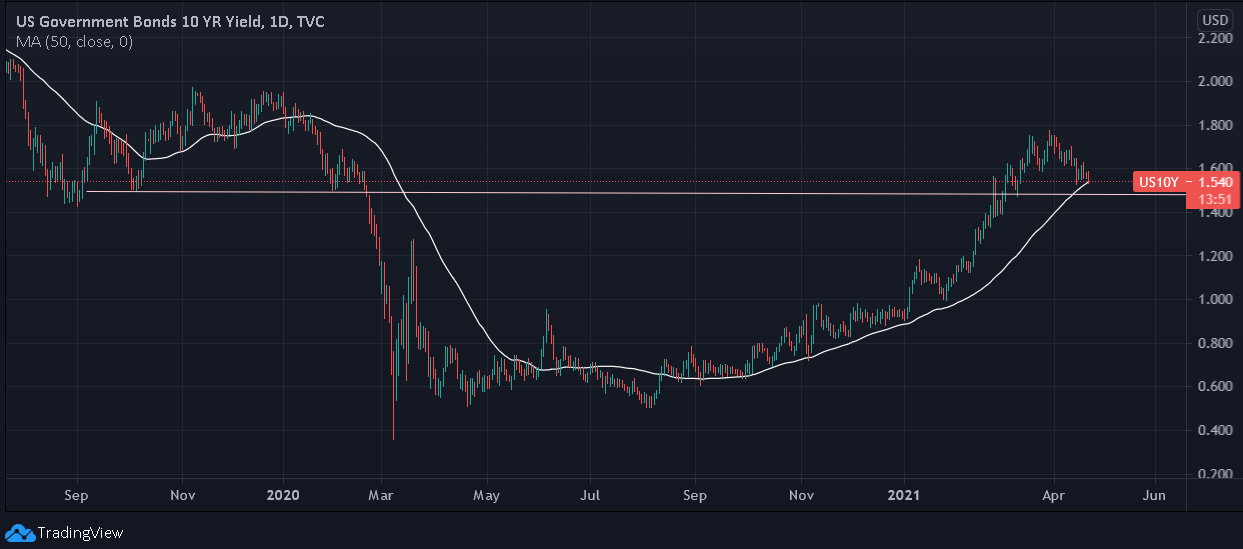
However, while Biden’s new-found fondness for austerity garnered all of the headlines, a slightly more important event was already unfolding. Case in point: despite the weakness in U.S. equities causing a bid for U.S. Treasuries, the U.S. 10-Year Treasury yield still managed to hold its 50-day moving average (MA). Moreover, with the October 2019 and January 2020 lows not far behind, the U.S. 10-Year Treasury yield may be only five basis points away from forming a lasting bottom.
Please see below:
Along for the ride, the U.S. Treasury 10-2 spread fell to 1.39% on Apr. 22. More importantly, though, the milestone marks a 20-basis-point decline from its March peak, and if the bottom is in, the duration from peak to trough has reached 18 trading days.
Please see below:
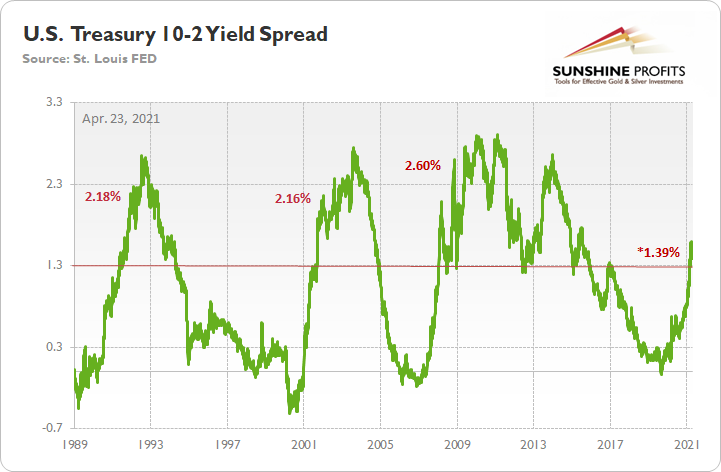
To explain the significance, I wrote on Apr. 20:
When the green line above is rising, it means that the U.S. 10-Year Treasury yield is increasing at a faster pace or declining at a slower pace than the U.S. 2-Year Treasury yield. Conversely, when the green line above is falling, it means that the U.S. 2-Year Treasury yield is increasing at a faster pace or declining at a slower pace than the U.S. 10-Year Treasury yield.
If you analyze the horizontal red line, 1.30% is where historical roads got a little rocky. However, after recording a major bottom, rallying above 1.30% and then suffering a meaningful correction, the 10-2 spread proceeded to rally to 2.18% (1991), 2.16% (2002) and 2.60% (2008) before suffering a second meaningful correction.
Moreover, the behavior of the 10-2 spread in 1991 and 2001/2002 is nearly identical to the current behavior: after reaching an interim peak in 1991, the 10-2 spread declined by 26 basis points over a 24-day stretch. Likewise, in 2001, the 10-2 spread declined by 20 basis points over a 17-day stretch. Conversely, the 10-2 spread followed its 1991 swoon by rallying by 80 basis points over the following 57 days. Similarly, the 10-2 spread followed its 2001 swoon by rallying by 105 basis points over the following 97 days (into 2002).
Thus, with the 10-2 spread’s current behavior mirroring 2001, a bottom could be imminent. Moreover, while the 1991 analogue implies immaterial weakness continuing into next week, whenever the 10-2 spread officially bottoms, historical precedent implies that we’ll see a significant rally off of the lows. Furthermore, while an equity rout has the potential to disrupt the timeline – as a safe-haven bid for U.S. Treasuries often coincides with meaningful stock market pullbacks – the PMs are unlikely to elicit strength once the equity market falters.
The bottom line? Once the U.S. 10-Year Treasury yield forms a medium-term bottom, expect the PMs to form a medium-term top.
And why is that?
Well, gold and the U.S. 10-Year Treasury yield have demonstrated an inverse relationship for quite some time. Case in point: back in October 2018, the yellow metal’s bottom occurred alongside the U.S. 10-Year Treasury yield’s top. Similarly, in August 2020, the yellow metal’s top occurred alongside the U.S. 10-Year Treasury yield’s bottom.
Please see below:
In addition, if you analyze the right side of the chart, you can see that battle lines have officially been drawn. With gold moving higher amid the U.S. 10-Year Treasury yield’s recent consolidation, the yellow metal has exuded confidence. However, with the current divergence occurring at a time when gold is near its historical highs and the U.S. 10-Year Treasury yield is near its historical lows, August’s reversal of fortunes is likely far from over.
But what’s stopping the U.S. 10-Year Treasury yield from moving lower?
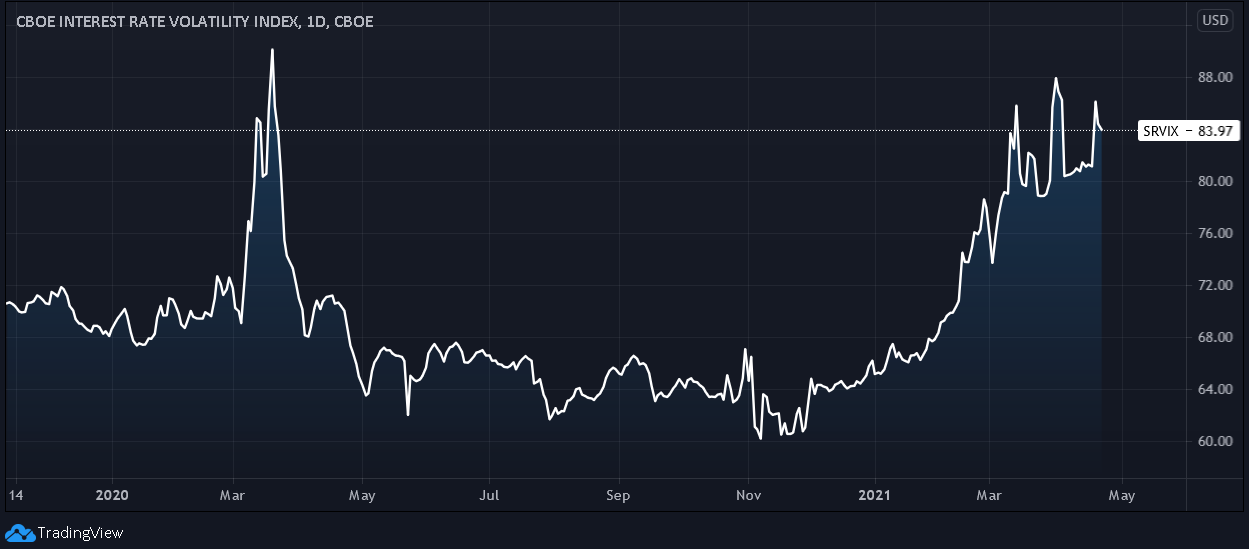
Well, adding to the historical precedent that I already outlined above, the Cboe Interest Rate Swap Volatility Index (SRVIX) remains on high alert. After surging by another 6.14% on Apr. 20, the SRVIX has barely come down from the recent spike.
Please see below:
And with Coca-Cola announcing on Apr. 19 that the company will raise prices to offset higher commodity costs, I warned on Apr. 20 that inflation jitters are unlikely to abate anytime soon.
I wrote:
When asked about the company’s response to the inflationary pressures – during Coca-Cola’s first-quarter earnings call on Apr. 19 – CFO John Murphy had this to say:
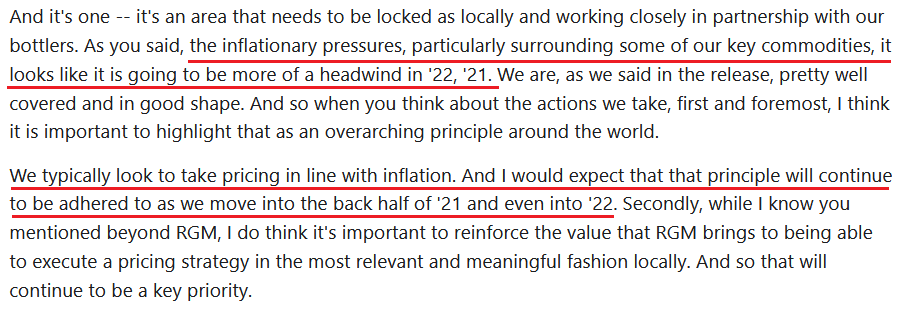 Source: Coca-Cola/The Motley Fool
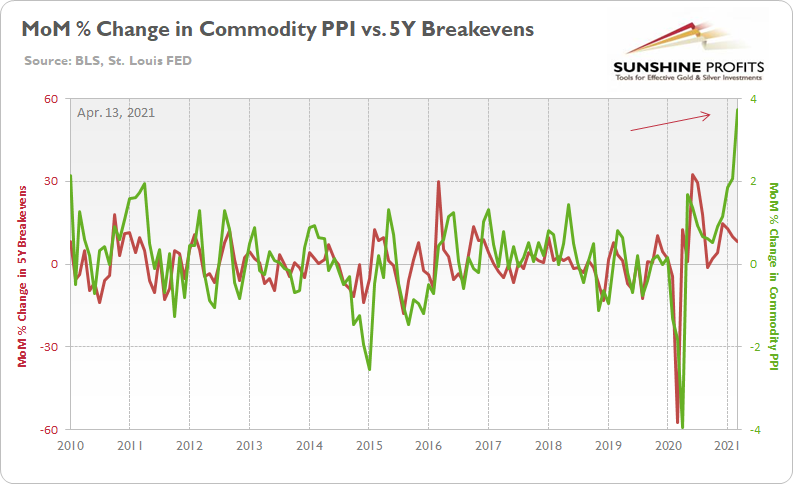
So, let’s connect the dots: commodity inflation has surged and Murphy expects “pricing in line with inflation.” As a result, doesn’t the 5-Year breakeven inflation rate look more and more like a sleeping giant?
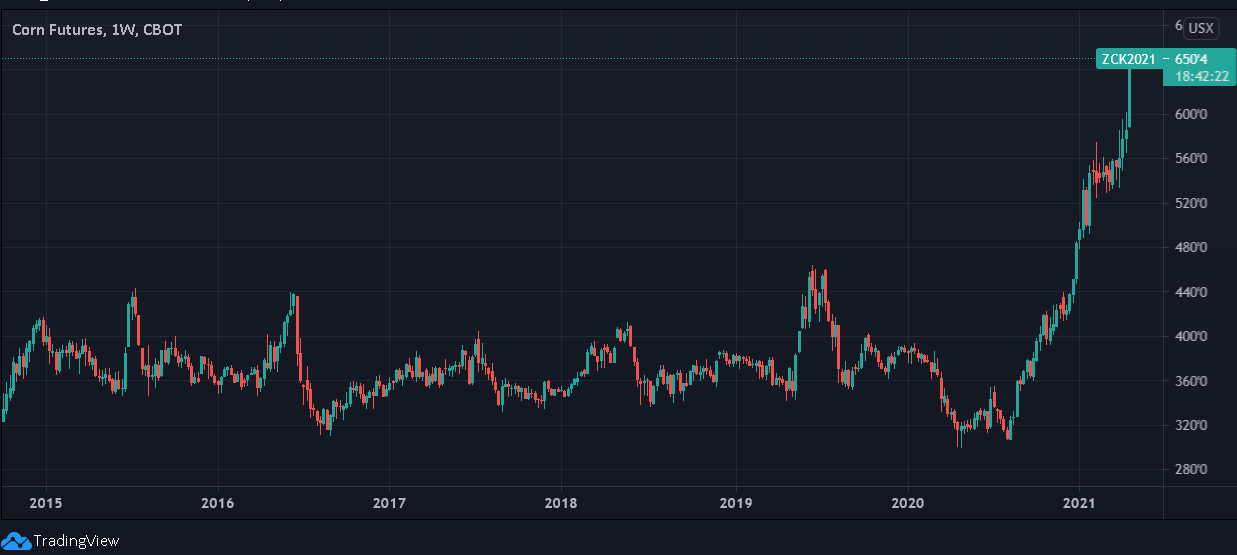
If that wasn’t enough, with lumber futures hitting ‘limit up’ on Apr. 19 – meaning that the contract rose so rapidly that regulators were forced to suspend trading for the day – we’ve witnessed a more than 50% rise in less than four months. But not to be outdone, corn futures have already surged by more than 11% this week (as of the Apr. 22 close).
Please see below:
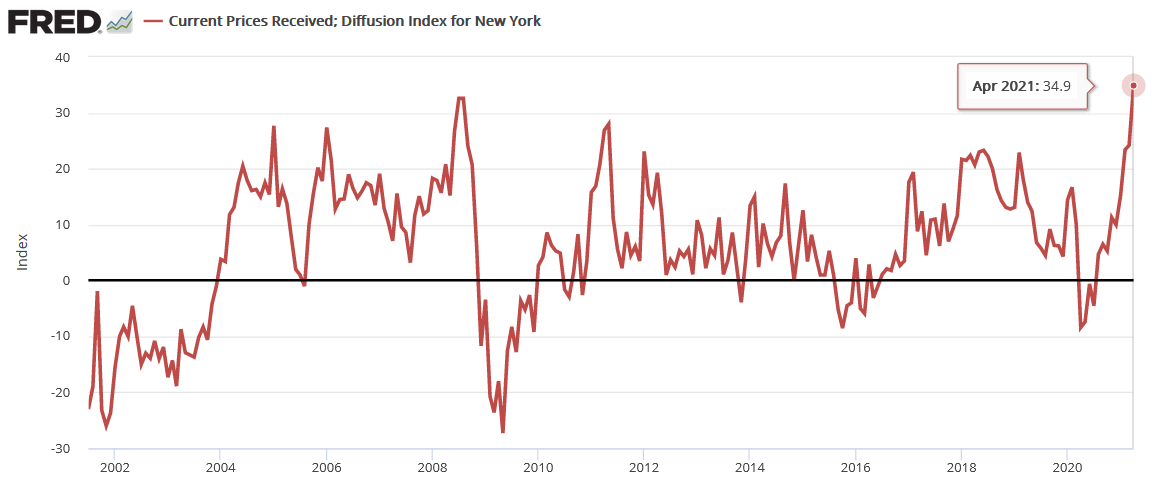
Continuing the theme, the Empire State Manufacturing Survey – a monthly survey of business conditions conducted by the New York Federal Reserve (FED) – revealed that not only are manufacturers’ input costs rising, but their output prices have hit an all-time high.
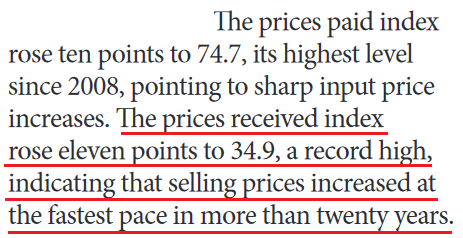 Source: New York FED
Furthermore, if you analyze the chart below, you can see that the record print is sharply higher than any other comparable reading since the Global Financial Crisis (GFC).
And looking to front-run the action, clients of JP Morgan have pushed their U.S. 10-Year Treasury short positions to their highest level since 2018.
Please see below:
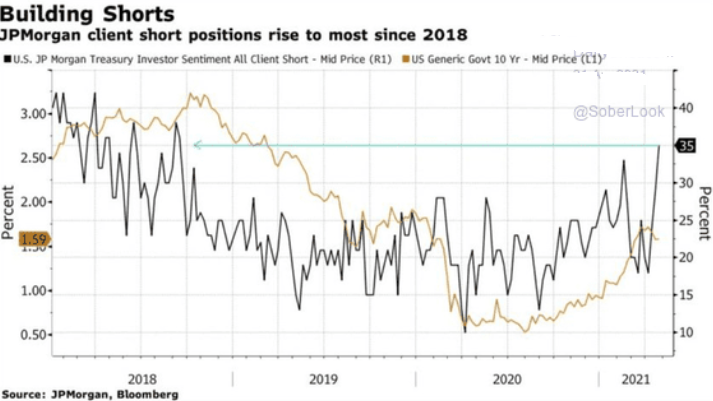
To explain, the brown line above tracks the U.S. 10-Year Treasury yield (the mid-price), while the black line above tracks the proportion of JP Morgan’s clients that short the U.S. 10-Year Treasury. If you analyze the right side of the chart, you can see that even amid the U.S. 10-Year Treasury yield’s recent consolidation, JP Morgan’s clients have been aggressively adding to their short positions.
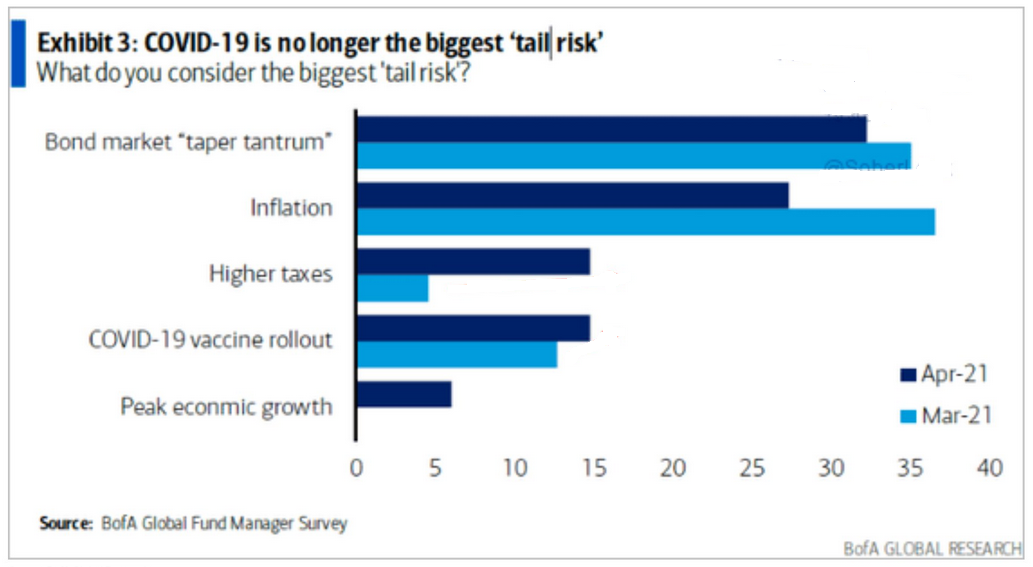
Furthermore, with Bank of America’s latest Global Fund Manager Survey revealing what we already know, institutional investors remain increasingly fearful of a bond market sell-off. With inflation fears and a potential taper tantrum still accounting for roughly 60% of what keeps institutional investors up at night, if the prospect unfolds, the PMs won’t be the only assets affected by the unwind.
In conclusion, while Thursday (Apr. 22) afternoon was quite entertaining, the PMs’ fireworks have yet to begin. With the USD Index catching a bid on Apr. 22 and the U.S. 10-Year Treasury yield already aligning with technical and historical support, the road ahead for the PMs could become increasingly treacherous. Furthermore, while the European Central Bank’s (ECB) Thursday meeting was largely uneventful, The Governing Council said that PEPP purchases are still going to be “conducted at a significantly higher pace than during the first months of the year.” Thus, despite the EUR/USD’s muted reaction, the ‘same old, same old’ remains USD bullish, as relative outprinting and Eurozone-U.S. growth differentials should weigh on the currency pair over the medium term. As a result, the USD Index is poised to be the main beneficiary, while the PMs will likely be stuck with the short end of the stick.
Thank you for reading our free analysis today. Please note that the above is just a small fraction of the full analyses that our subscribers enjoy on a regular basis. They include multiple premium details such as the interim targets for gold and mining stocks that could be reached in the next few weeks. We invite you to subscribe now and read today’s issue right away.
Sincerely,
Przemyslaw Radomski, CFA
Founder, Editor-in-chief -
HUI Index: Always Look at the Bigger Picture
April 22, 2021, 8:30 AMIf the HUI Index behaves like it did historically, the reversal could be nearer than most analysts think.
It’s said that “fortune favors the bold”. It’s also said that “patience is a virtue”. In reality, it depends on the situation, and under present circumstances, some patience is required in order to fully benefit from the upcoming moves in gold.
Not much changed on the precious metals market yesterday (Apr. 21), at least after I sent out the intraday Alert. Consequently, I will base today’s analysis on the latter. Just as I did yesterday, I will start the analysis with the long-term picture of the HUI Index – the flagship proxy for gold stocks.
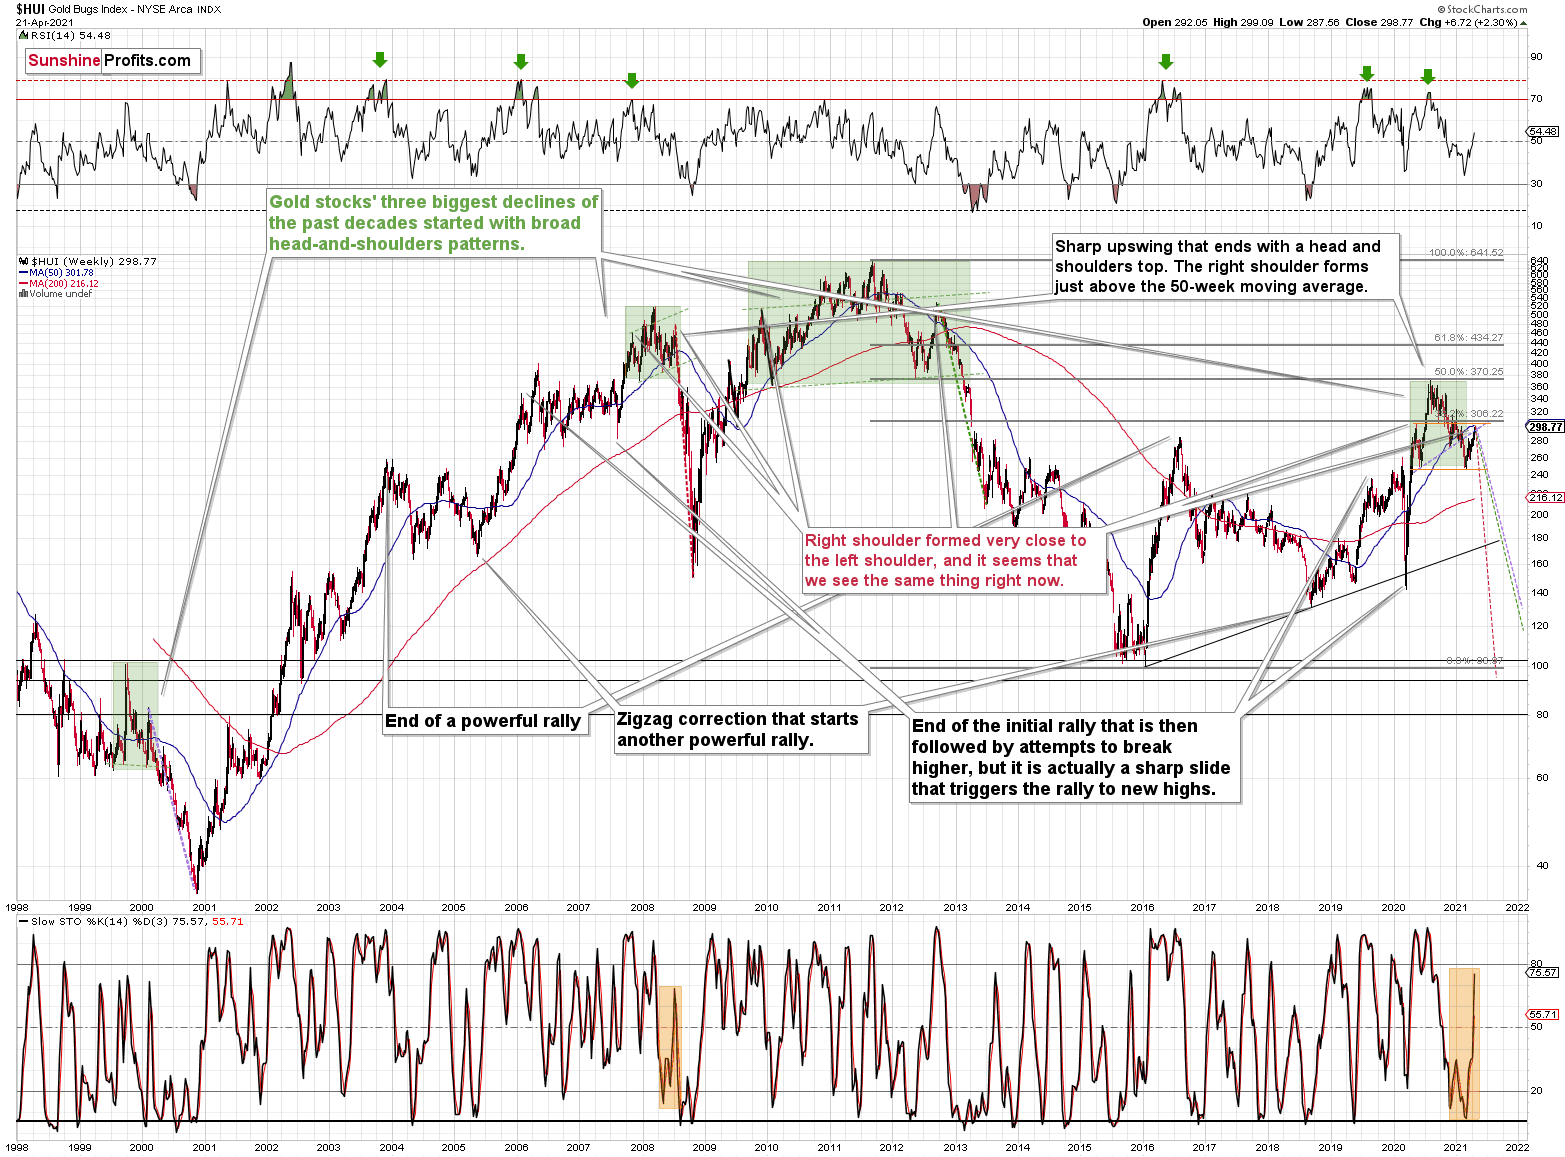
Please note that the 2007 – 2008 and the 2009 – 2012 head and shoulders pattern didn’t have the right shoulders all the way up to the line that was parallel to the line connecting the bottoms. I marked those lines with green in the above-mentioned formations. In the current case, I marked those lines with orange.
Now, even though the above wasn’t the case, in both cases, the final top – the right shoulder formed close to the price where the left shoulder topped. The left shoulder that formed in early 2020 topped at 303.02.
Consequently, it wouldn’t be surprising to see a move to about 300 in the HUI Index, despite all the bearish indications that I outlined so far today.
Yes, I realize that this is not a pleasant piece of news, as we would all prefer to have the market move in our preferred direction right away, but this time it seems that the wait will be – in my opinion – extremely worth it.
The HUI Index at 299 perfectly fits the above, and that’s yesterday’s intraday high (299.09). This means that the recent rally is not a game-changer, but rather a part of a long-term pattern that’s not visible when one focuses on the short-term only.
The thing is that the vast majority of individual investors and – sadly – quite many analysts focus on the trees while forgetting about the forest. During the walk, this might result in getting lost, and the implications are no different in the investment landscape.
From the day-to-day perspective, a weekly – let alone monthly – rally seems like a huge deal. However, once one zooms out and looks at the situation from a broad perspective, it’s clear that:
What has been will be again, what has been done will be done again; there is nothing new under the sun. (-Ecclesiastes 1:9)
The rally is very likely the right shoulder of a broad head and shoulders formation. “Very likely” and not “certainly”, because the HUI Index needs to break to new yearly lows in order to complete the pattern – for now, it’s just potential. However, given the situation in the USD Index (i.a. the positions of futures traders as seen in the CoT report, and the technical situation in it), it seems very likely that this formation will indeed be completed. Especially when (not if) the general stock market tumbles.
Thank you for reading our free analysis today. Please note that the above is just a small fraction of the full analyses that our subscribers enjoy on a regular basis. They include multiple premium details such as the interim targets for gold and mining stocks that could be reached in the next few weeks. We invite you to subscribe now and read today’s issue right away.
Sincerely,
Przemyslaw Radomski, CFA
Founder, Editor-in-chief


Gold Investment News
Delivered To Your Inbox
Free Of Charge
Bonus: A week of free access to Gold & Silver StockPickers.
Gold Alerts
More-
Status
New 2024 Lows in Miners, New Highs in The USD Index
January 17, 2024, 12:19 PM -
Status
Soaring USD is SO Unsurprising – And SO Full of Implications
January 16, 2024, 8:40 AM -
Status
Rare Opportunity in Rare Earth Minerals?
January 15, 2024, 2:06 PM

