

Briefly: in our opinion, full (300% of the regular position size) speculative short positions in mining stocks are justified from the risk/reward point of view at the moment of publishing this Alert.
In yesterday’s (Apr. 8) analysis, I put the following in bold:
Please keep in mind that since gold might reverse today, it could rally a bit first – this would not be bullish, but relatively normal.
Here’s what happened in gold yesterday:
And here’s what’s happening in today’s pre-market trading:
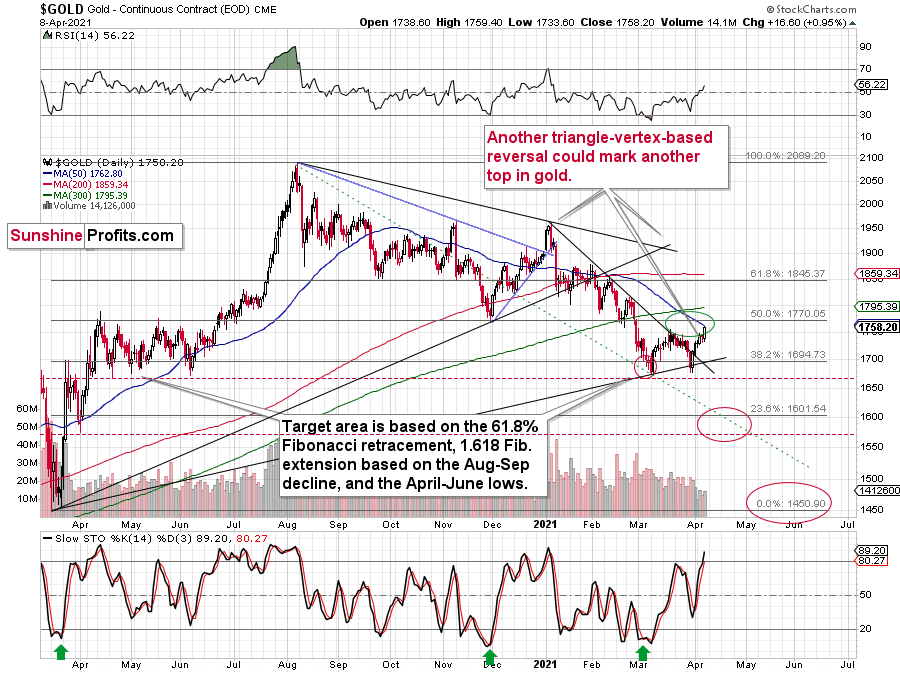
Simply put, gold rallied yesterday, and it seems to have topped right at its triangle-vertex-based reversal.
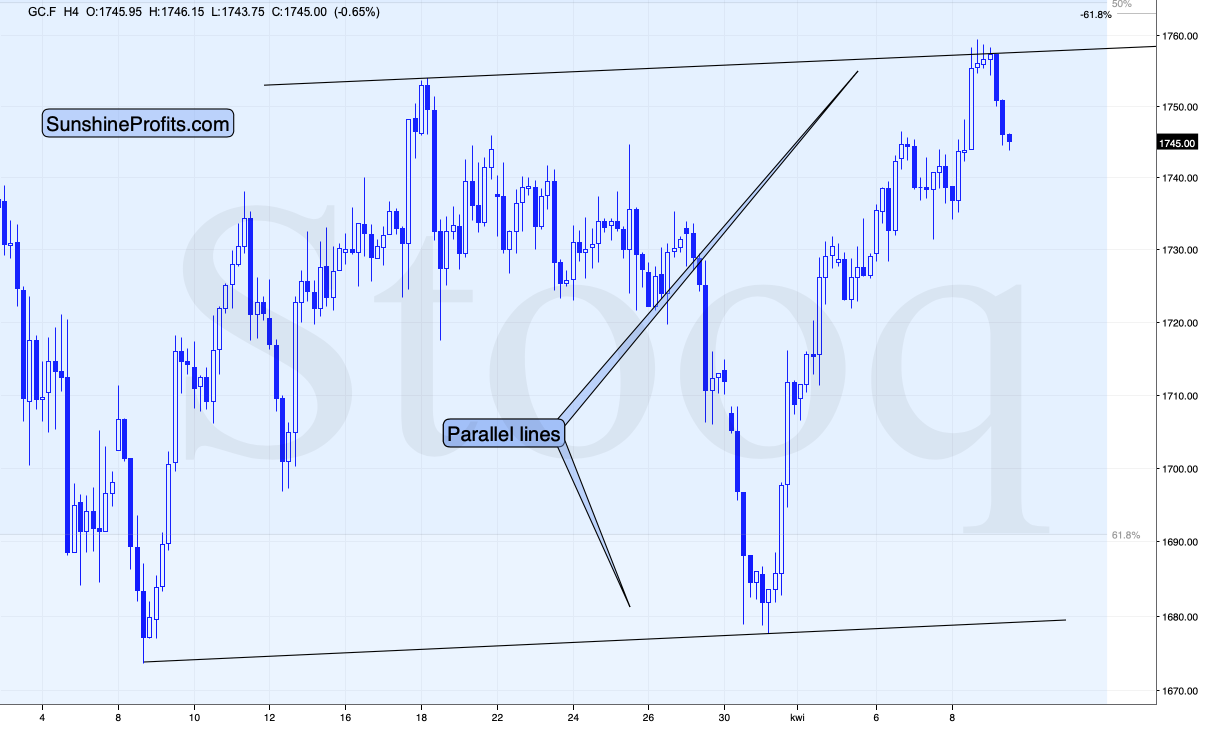
Moreover, gold has not only topped at the reversal point, but it also seems to have topped at the line that’s parallel to the line connecting two previous short-term bottoms. This means that the recent monthly rally was a near-perfect zigzag (a.k.a. ABC) correction – the most classic way in which a flag formation can form.
The moves that follow such continuous patterns tend to be similar to the moves that preceded them. In this case, the move that preceded the zigzag pattern was the January – March decline, during which gold fell by more than $150. Repeating this kind of move would mean a decline in gold to about $1,600. This would be in perfect tune with what I wrote previously about gold’s likely interim downside target.
The Miners
What about other gold stocks – did they confirm the top as well?
Yes, although the confirmation wasn’t particularly clear.
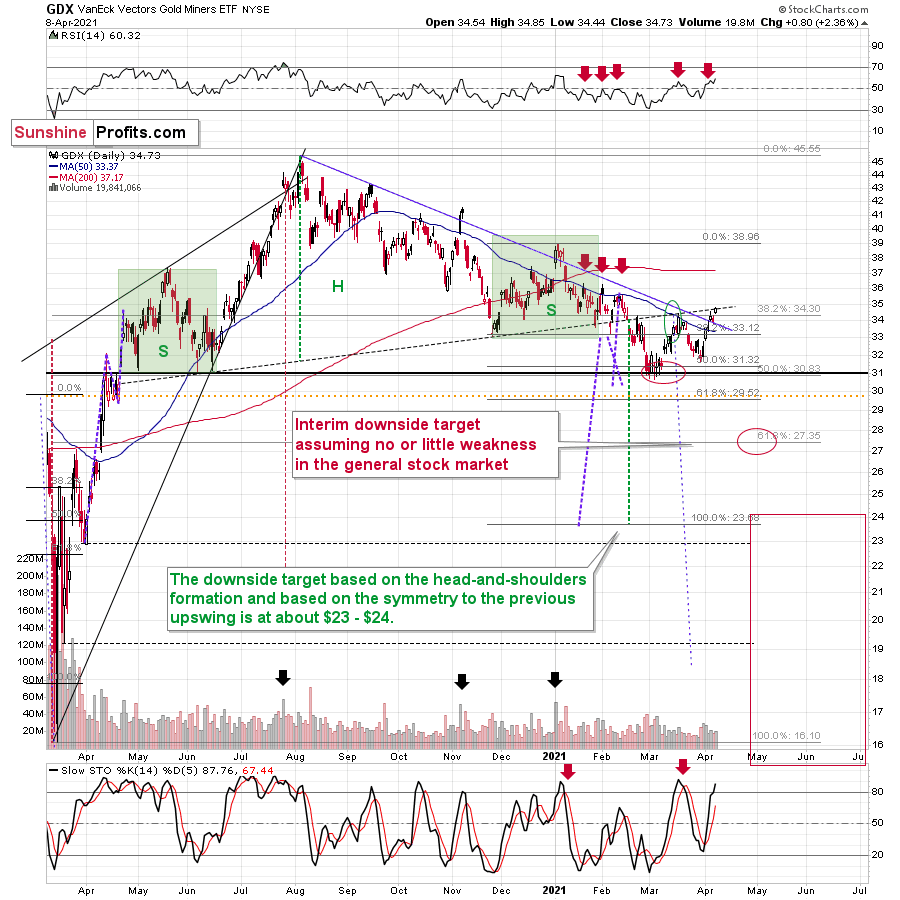
The GDX ETF didn’t soar yesterday, but rather moved higher at a moderate pace. It moved visibly above the declining blue resistance line, but it stopped at the neck level of the previously completed broad head-and-shoulders pattern. This is a strong resistance that already worked once (in mid-March), so it’s quite likely that reaching it marked the end of the short-term correction.
USD Index
And the USD Index?
It declined a bit more than seemed likely based on the 1:1 analogy to how much it declined back in 2018, but the deviation from this analogy is not big enough to say that the link is broken – far from it.
I previously wrote the following with regard to the short-term bottoming target for the U.S. currency:
What we saw yesterday definitely qualifies as a small correction. In fact, even if it was doubled it would still be small. And – more importantly – it would be in perfect tune with what happened in 2018 during the big rally.
After rallying visibly above the:
- 93 level
- 200-day moving average
- 61.8% Fibonacci retracement level based on the final part of the decline
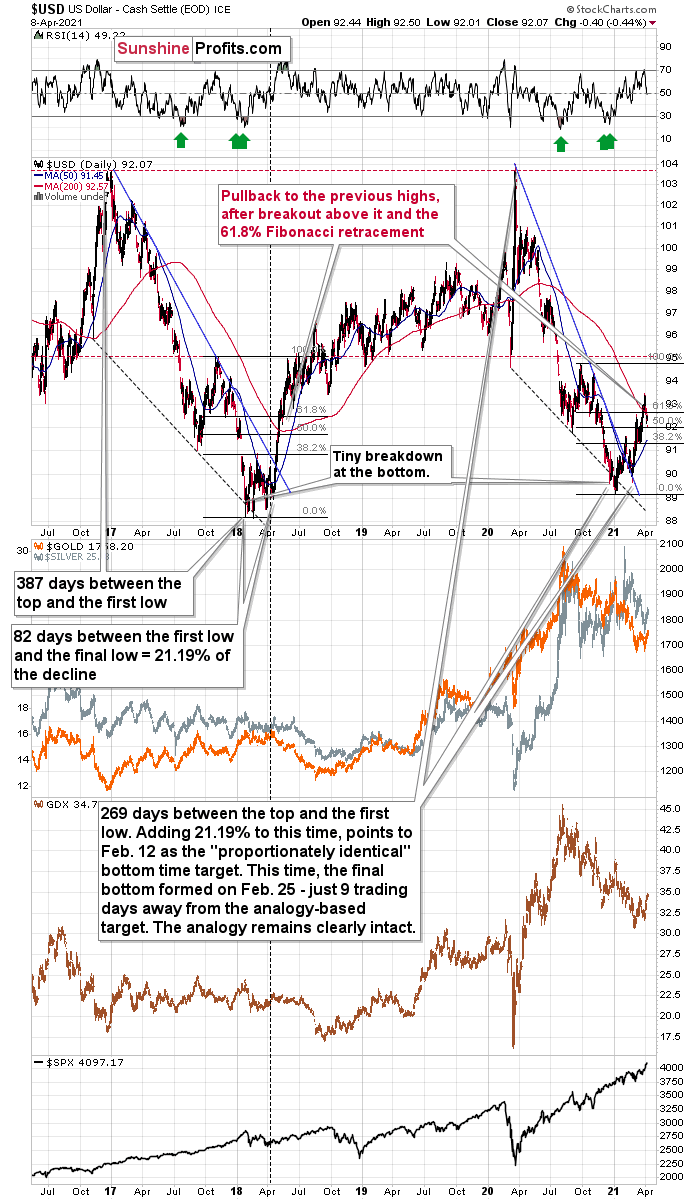
the USD Index moved back below the 93 level. This happened in May 2018 and it happened last week.
Since both rallies are so similar, it’s nothing odd that we see a pullback in a similar situation.
Back in 2018, the pullback was small and quick. It ended without the USD Index reaching its 200-day moving average. The pullback ended when the USDX moved approximately to its previous high and slightly below the 61.8% Fibonacci retracement.
Applying this to the current situation (previous high at about 92.5, the 61.8% Fibonacci retracement at about 92.7, and the 200-day moving average at 92.66), it seems that the USD Index would be likely to find its bottom in the 92.3 – 92.7 area.
Yesterday’s close at 92.07 and today’s pre-market move above 92.3 suggest that the bottom might have been formed just a little below the lower border of the above-mentioned target area. Since the history doesn’t necessarily repeat itself to the letter, but it often rhymes, the two situations – the current and the 2018 rallies – continue to be similar and the implications continue to be bullish. This, in turn, is bearish for the precious metals prices – at least in the next several weeks.
All in all, gold and mining stocks seem to have reversed, while the USD Index seems to have bottomed or is quite close to bottoming. As gold and miners decline, the same is likely to be the case with silver.
Having said that, let’s take a look at the market from a more fundamental angle.
The More Things Change, The More They Stay the Same
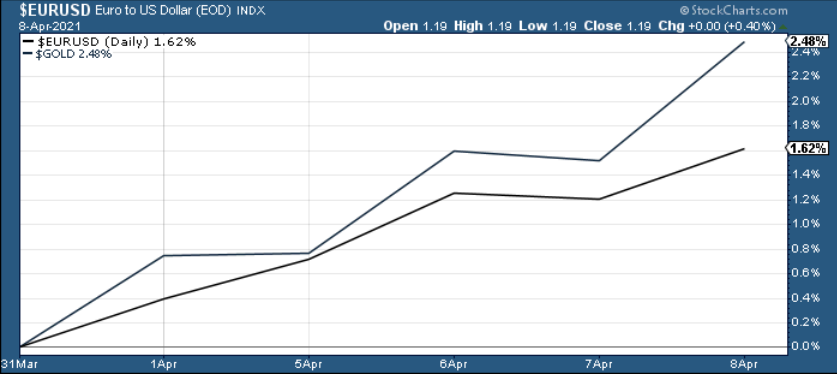
With gold hitching its carriage to the EUR/USD’s horse, the latter’s recent strength has enabled a smooth ride for the yellow metal. Case in point: since Apr. 1, the two have clearly enjoyed each other’s company.
However, in ironic fashion, three important developments have occurred along the journey.
- Germany (Europe’s largest economy) had its 2021 GDP growth estimate reduced from 3.5% to 3.35%
- France (Europe’s second-largest economy) had its 2021 GDP growth estimate reduced from 6% to 5%.
And the third?
Well, on Apr. 8, Spain’s Economy Minister Nadia Calvino told Bloomberg that Europe’s fourth-largest economy will also reduce its 2021 GDP growth estimate.
Please see below:
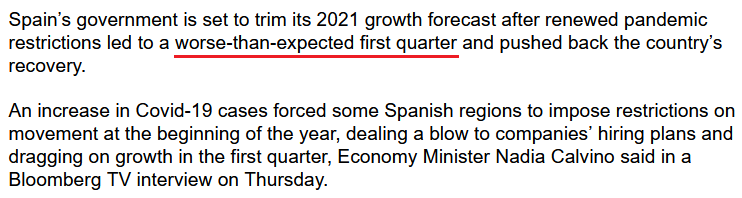 Source: Bloomberg
And as the dominoes continue to fall, also on Apr. 8, The Independent Authority for Fiscal Responsibility (AIReF) – an agency that oversees the sustainability of Spain’s public finances – reduced its 2021 GDP growth estimate from 8.2% to 6.6%.
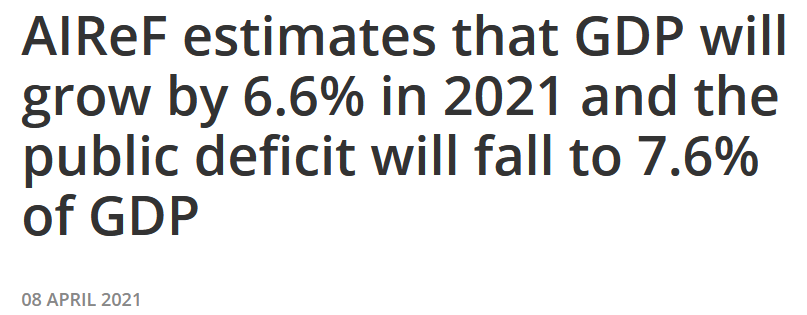 Source: AIReF
But hey, who cares about GDP growth, right?
If that wasn’t enough, Klaas Knot, a member of the European Central Bank (ECB) Governing Council, told CNBC on Apr. 8 that “we don’t want the run-up in bond yields to prematurely tighten our financing conditions.”
Translation? Last week’s €343 billion expansion of the ECB’s balance sheet – the largest since June 2020 – was likely not a one-off event. Why so? Because Knot hinted at this himself.
Please see below:
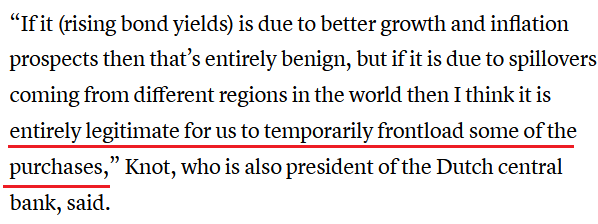 Source: CNBC
And why all of the concern?
Well, because the Eurozone economy remains on ice. Case in point: a German constitutional court recently blocked the EU’s €750 billion recovery plan (Europe’s version of COVID-19 fiscal stimulus). And because the plan requires full support, The European Commission can’t raise the funds unless all EU member states agree. And with only 22 of the 27 EU nations on board, it could be months until the funds reach the real economy (if ever).
But in the meantime, French Finance Minister Bruno Le Maire told Bloomberg on Apr. 7 that the recovery plan is “not on the right track” and that he’s “deeply concerned.”
“We are in April 2021, and once again I have not seen any single penny,” he said.
And why is Le Maire so concerned?
Because his country is in lockdown as Europe struggles to control the coronavirus pandemic. Take a look at IHS Markit’s France Construction PMI (released on Apr. 8): in what passes for good news these days, “a further decline in French construction activity” gave way to “positive expectations” because the contraction was the softest in nine months.
However, notice the caveat at the end of Eliot Kerr’s comments?
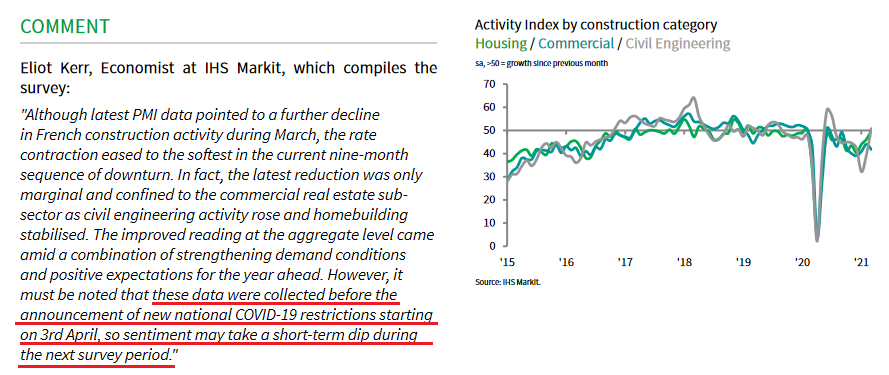
That’s right: before the recent lockdown.
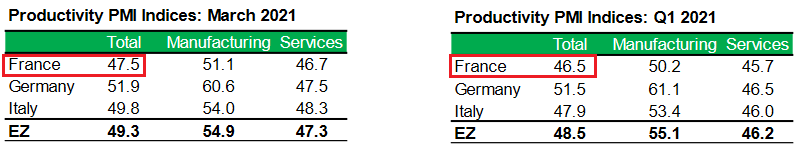
Moreover, IHS Markit’s Eurozone Productivity PMI (also released on Apr. 8) showed that efficiency remains sluggish in France.
Please see below:
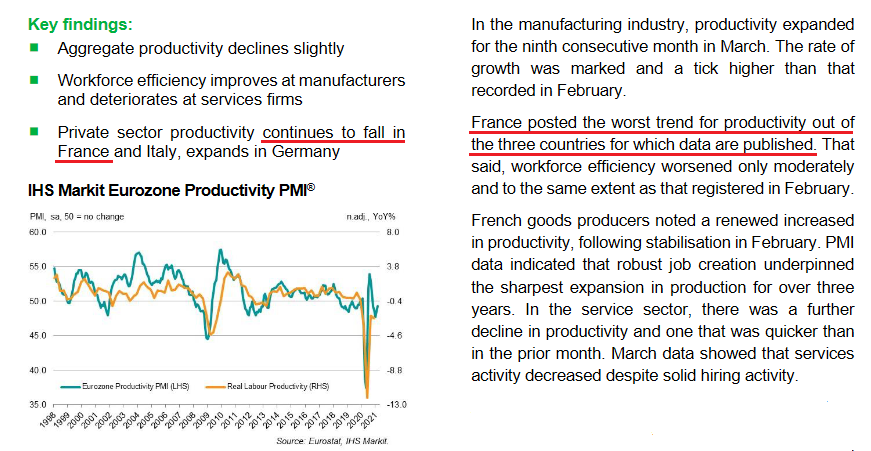
Furthermore, despite improving moderately in March, France is easily the worst performer of the major Eurozone economies.
 Source: IHS Markit
For context, PMI (Purchasing Managers’ Index) data is compiled through a monthly survey of executives within industries that are integral to regional economic performance. A PMI above 50 indicates business conditions are expanding, while a PMI below 50 indicates that business conditions are contracting.
Keep in mind though: since the data was weak before France went into lockdown, the virus surge will likely quash any and all momentum.
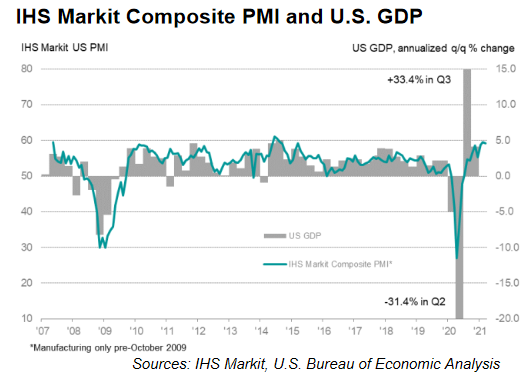
Furthermore, while IHS Markit’s Eurozone Composite PMI (released on Apr. 7) hit 53.2 (service sector still in contraction at 49.6), overall Eurozone activity still lags behind the U.S.
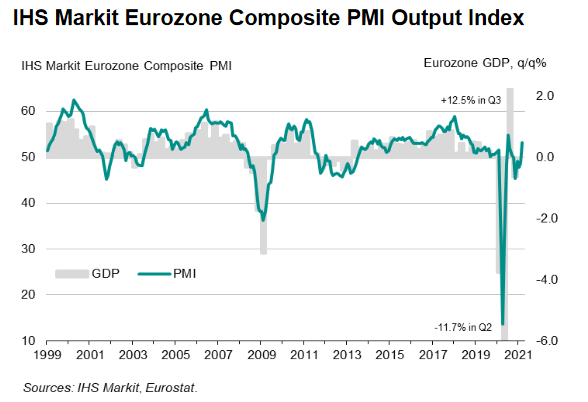
As an apples-to-apples comparison, IHS Markit’s U.S. Composite PMI (released on Mar. 24), stood at 59.1, while service sector activity jumped to 60.0.
Please see below:
And with fiscal stimulus left to the German courts and the fundamental risks rising, as mentioned, the ECB will be forced to pick up the slack. If you analyze the chart below, you can see that the ECB’s monthly PEPP purchases in March were the highest since November. And because currencies trade on a relative basis, relative outprinting by the ECB is fundamentally bearish for the EUR/USD.
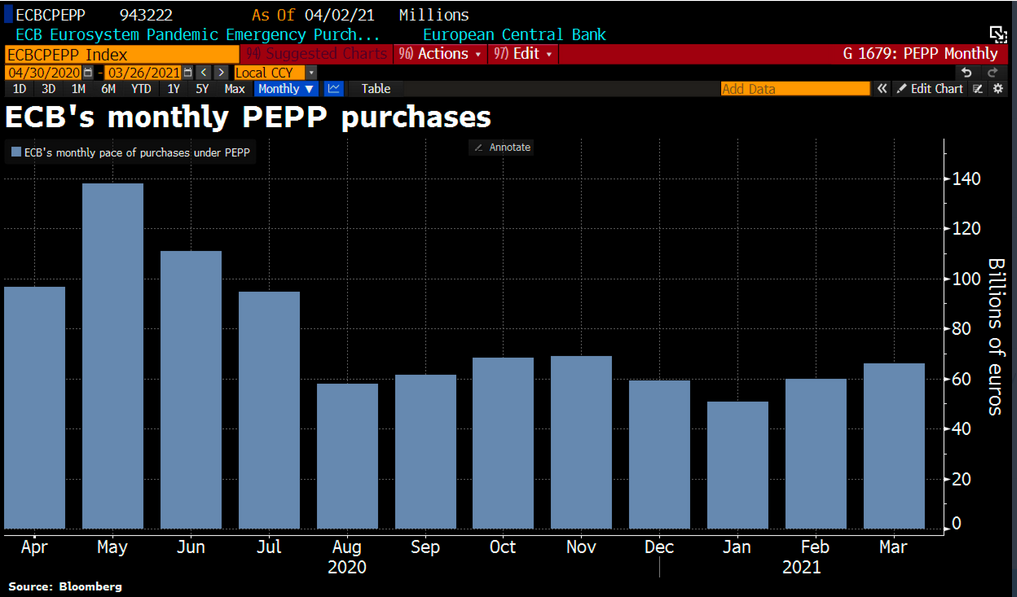
To that point, Reuters hinted that the ECB has no plans of slowing down.
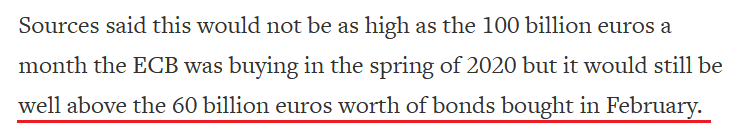 Source: Reuters
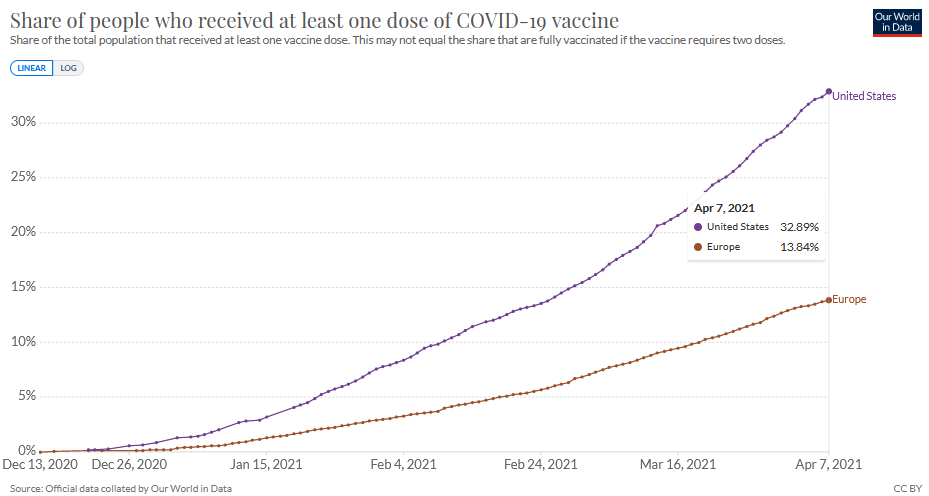
Adding to the list of laggards, Europe has made little progress in its vaccine rollout. On Mar. 31, the U.S.-Eurozone spread between the share of people who have received at least one dose of a COVID-19 vaccine was 16.53%. However, on Apr. 7, the spread increased to 19.05%.
So let’s review:
Relative to the United States:
- The economic outlook is worse in Europe
- The money printer is working overtime in Europe
- The virus spread is worse in Europe
- The vaccine rollout is much slower in Europe
Thus, should the above developments coincide with a stronger euro?
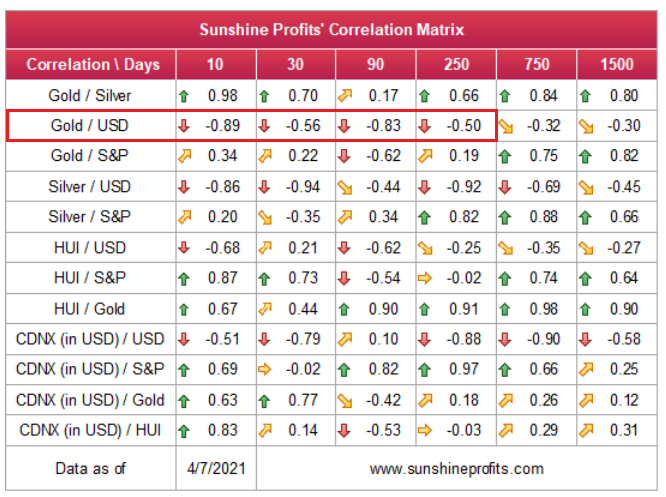
Either way, once the EUR/USD decides to reflect these realities, a move lower will propel the USD Index higher. And because gold has a strong negative correlation with the U.S. dollar, the falling dominoes are profoundly bearish for the yellow metal.
And seemingly front-running the action, gold’s strongest supporters have now become its largest detractors. Case in point: gold-backed ETFs have suffered massive outflows in recent months, with total assets declining to their lowest level since May 2020.
Please see below:
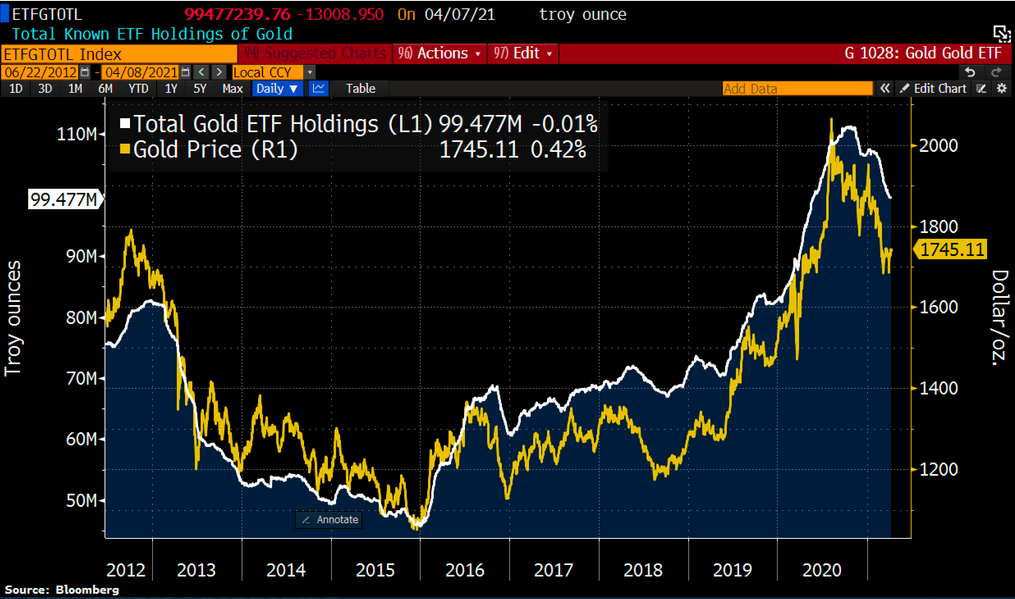
To explain, the yellow line above tracks the gold price, while the white line above tracks the total assets of gold-backed ETFs. For context, gold-backed ETF holdings have declined in four of the last five months and the only comparable example is the massive drawdown that we witnessed in 2012-2013. More importantly though, if you analyze the middle of the chart, you can see that even as gold rallied on Apr. 8, gold-backed ETFs still suffered outflows, with total holdings declining by 0.01%.
In conclusion, up is down, down is up and the EUR/USD continues to follow in equities’ footsteps. Thus, for now, despite the myriad of fundamental indicators supporting a lower EUR/USD, the currency pair wants what it wants. However, after displaying this same behavior in December 2020, before rolling over, fundamentals are akin to chopping down a tree with an axe: it takes several swings to bring down the evergreen. And because gold’s recent strength is likely to fade with the EUR/USD, the medium-term weather forecast still signals cloudy skies ahead.
Overview of the Upcoming Part of the Decline
- It seems quite likely to me that we are already after the initial bottom and the initial correction. If not, then it seems likely to me that the corrective upswing will be completed within a week or so (with PMs topping in the first half of April). It’s also quite possible that the next big move lower is already underway, though.
- After miners slide once again in a meaningful and volatile way, but silver doesn’t (and it just declines moderately), I plan to switch from short positions in miners to short positions in silver (this could take another 1-2 weeks to materialize). I plan to exit those short positions when gold shows substantial strength relative to the USD Index, while the latter is still rallying. This might take place with gold close to $1,450 - $1,500 and the entire decline (from above $1,700 to about $1,475) would be likely to take place within 1-12 weeks and I would expect silver to fall hardest in the final part of the move. This moment (when gold performs very strongly against the rallying USD and miners are strong relative to gold – after gold has already declined substantially) is likely to be the best entry point for long-term investments in my view. This might happen with gold close to $1,475, but it’s too early to say with certainty at this time. In other words, the entire decline could take between 1 and 12 weeks, with silver declines occurring particularly fast in the final 1-2 weeks.
- If gold declines even below $1,500 (say, to ~$1350 or so), then it could take another 10 weeks or so for it to bottom, but this is not what I view as a very likely outcome.
- As a confirmation for the above, I will use the (upcoming or perhaps we have already seen it?) top in the general stock market as the starting point for the three-month countdown. The reason is that after the 1929 top, gold miners declined for about three months after the general stock market started to slide. We also saw some confirmations of this theory based on the analogy to 2008. All in all, the precious metals sector would be likely to bottom about three months after the general stock market tops . If the mid-February 2020 top was the final medium-term top (based on NASDAQ’s top, then it seems that we might expect the precious metals sector to bottom in mid-May or close to May’s end. If, however, the mid-March 2020 top was the final medium-term top (based on the S&P 500), then we might expect the precious metals sector to bottom in mid-June or close to June’s end.
- The above is based on the information available today and it might change in the following days/weeks.
Summary
To summarize, the PMs’ medium-term decline is well underway, and based on the recent performance of the USD Index, gold and mining stocks, it seems that the corrective upswing is already over or about to be over. Based on gold’s triangle-vertex-based reversal it seems that gold has already formed its short-term top. The next big move lower seems to be already underway or about to start.
In addition, because we’re likely entering the “winter” part of the Kondratiev cycle (just like in 1929 and then the 1930s), the outlook for the precious metals’ sector remains particularly bearish during the very first part of the cycle, when cash is king.
The confirmed breakout in the USD Index is yet another confirmation of the bearish outlook for the precious metals market.
After the sell-off (that takes gold to about $1,450 - $1,500), we expect the precious metals to rally significantly. The final part of the decline might take as little as 1-5 weeks, so it's important to stay alert to any changes.
Most importantly, please stay healthy and safe. We made a lot of money last March and it seems that we’re about to make much more on this March decline, but you have to be healthy to enjoy the results.
As always, we'll keep you - our subscribers - informed.
By the way, we’re currently providing you with a possibility to extend your subscription by a year, two years or even three years with a special 20% discount. This discount can be applied right away, without the need to wait for your next renewal – if you choose to secure your premium access and complete the payment upfront. The boring time in the PMs is definitely over and the time to pay close attention to the market is here. Naturally, it’s your capital, and the choice is up to you, but it seems that it might be a good idea to secure more premium access now, while saving 20% at the same time. Our support team will be happy to assist you in the above-described upgrade at preferential terms – if you’d like to proceed, please contact us.
To summarize:
Trading capital (supplementary part of the portfolio; our opinion): Full speculative short positions (300% of the full position) in mining stocks are justified from the risk to reward point of view with the following binding exit profit-take price levels:
Mining stocks (price levels for the GDXJ ETF): binding profit-take exit price: $24.12; stop-loss: none (the volatility is too big to justify a stop-loss order in case of this particular trade)
Alternatively, if one seeks leverage, we’re providing the binding profit-take levels for the JDST (2x leveraged) and GDXD (3x leveraged – which is not suggested for most traders/investors due to the significant leverage). The binding profit-take level for the JDST: $39.87; stop-loss for the JDST: none (the volatility is too big to justify a SL order in case of this particular trade); binding profit-take level for the GDXD: $94.87; stop-loss for the GDXD: none (the volatility is too big to justify a SL order in case of this particular trade).
For-your-information targets (our opinion; we continue to think that mining stocks are the preferred way of taking advantage of the upcoming price move, but if for whatever reason one wants / has to use silver or gold for this trade, we are providing the details anyway.):
Silver futures upside profit-take exit price: unclear at this time - initially, it might be a good idea to exit, when gold moves to $1,512.
Gold futures upside profit-take exit price: $1,512.
Long-term capital (core part of the portfolio; our opinion): No positions (in other words: cash
Insurance capital (core part of the portfolio; our opinion): Full position
Whether you already subscribed or not, we encourage you to find out how to make the most of our alerts and read our replies to the most common alert-and-gold-trading-related-questions.
Please note that we describe the situation for the day that the alert is posted in the trading section. In other words, if we are writing about a speculative position, it means that it is up-to-date on the day it was posted. We are also featuring the initial target prices to decide whether keeping a position on a given day is in tune with your approach (some moves are too small for medium-term traders, and some might appear too big for day-traders).
Additionally, you might want to read why our stop-loss orders are usually relatively far from the current price.
Please note that a full position doesn't mean using all of the capital for a given trade. You will find details on our thoughts on gold portfolio structuring in the Key Insights section on our website.
As a reminder - "initial target price" means exactly that - an "initial" one. It's not a price level at which we suggest closing positions. If this becomes the case (like it did in the previous trade), we will refer to these levels as levels of exit orders (exactly as we've done previously). Stop-loss levels, however, are naturally not "initial", but something that, in our opinion, might be entered as an order.
Since it is impossible to synchronize target prices and stop-loss levels for all the ETFs and ETNs with the main markets that we provide these levels for (gold, silver and mining stocks - the GDX ETF), the stop-loss levels and target prices for other ETNs and ETF (among other: UGL, GLL, AGQ, ZSL, NUGT, DUST, JNUG, JDST) are provided as supplementary, and not as "final". This means that if a stop-loss or a target level is reached for any of the "additional instruments" (GLL for instance), but not for the "main instrument" (gold in this case), we will view positions in both gold and GLL as still open and the stop-loss for GLL would have to be moved lower. On the other hand, if gold moves to a stop-loss level but GLL doesn't, then we will view both positions (in gold and GLL) as closed. In other words, since it's not possible to be 100% certain that each related instrument moves to a given level when the underlying instrument does, we can't provide levels that would be binding. The levels that we do provide are our best estimate of the levels that will correspond to the levels in the underlying assets, but it will be the underlying assets that one will need to focus on regarding the signs pointing to closing a given position or keeping it open. We might adjust the levels in the "additional instruments" without adjusting the levels in the "main instruments", which will simply mean that we have improved our estimation of these levels, not that we changed our outlook on the markets. We are already working on a tool that would update these levels daily for the most popular ETFs, ETNs and individual mining stocks.
Our preferred ways to invest in and to trade gold along with the reasoning can be found in the how to buy gold section. Furthermore, our preferred ETFs and ETNs can be found in our Gold & Silver ETF Ranking.
As a reminder, Gold & Silver Trading Alerts are posted before or on each trading day (we usually post them before the opening bell, but we don't promise doing that each day). If there's anything urgent, we will send you an additional small alert before posting the main one.
Thank you.
Przemyslaw Radomski, CFA
Founder, Editor-in-chief

