

Briefly: in our opinion, full (300% of the regular position size) speculative short positions in mining stocks are justified from the risk/reward point of view at the moment of publishing this Alert.
On an administrative note: the markets are closed today (Good Friday), and while I previously wrote that I won’t be posting a regular Alert today, I decided to send post it anyway, because I get the feeling that you might be worried about the current positions given gold’s (and miners) seemingly strong performance at the end of the trading week. I hope that thanks to this, your Holiday Weekend might be more peaceful. As a reminder, the next regular Gold & Silver Trading Alert (the flagship issue) will be posted on Tuesday, April 6, 2021. However, just because there will be no regular Alert posted on Monday, it doesn’t mean that I’m stopping monitoring the markets. I’m not – if anything major happens on Monday, I will keep you updated through the quick intraday Alerts, anyway.
Since gold, silver, and mining stocks moved higher on Thursday and Friday – and because gold closed the trading week above its declining resistance line – you might be wondering if this changes the outlook for the market.
In short, it doesn’t change much, if anything.
The key factors that didn’t change include the following (quoting from the previous analysis):
The more important reasons due to which it seems likely that the decline will continue are: the rally in the USD Index and the rally in the long-term interest rates.
As far as the latter is concerned, it seems unlikely that we’ll see the Fed stepping into action with another Operation Twist until the general stock market slides. Otherwise, such a big intervention might seem uncalled for. Consequently, the long-term rates are likely to rally some more. And gold is likely to respond by declining further.
As far as the USD Index in concerned, it just moved to new yearly highs, and since the nearest strong resistance is relatively far (from the short-term point of view), it seems that the move higher will continue with only small corrections along the way.
What we saw yesterday definitely qualifies as a small correction. In fact, even if it was doubled it would still be small. And – more importantly – it would be in perfect tune with what happened in 2018 during the big rally.
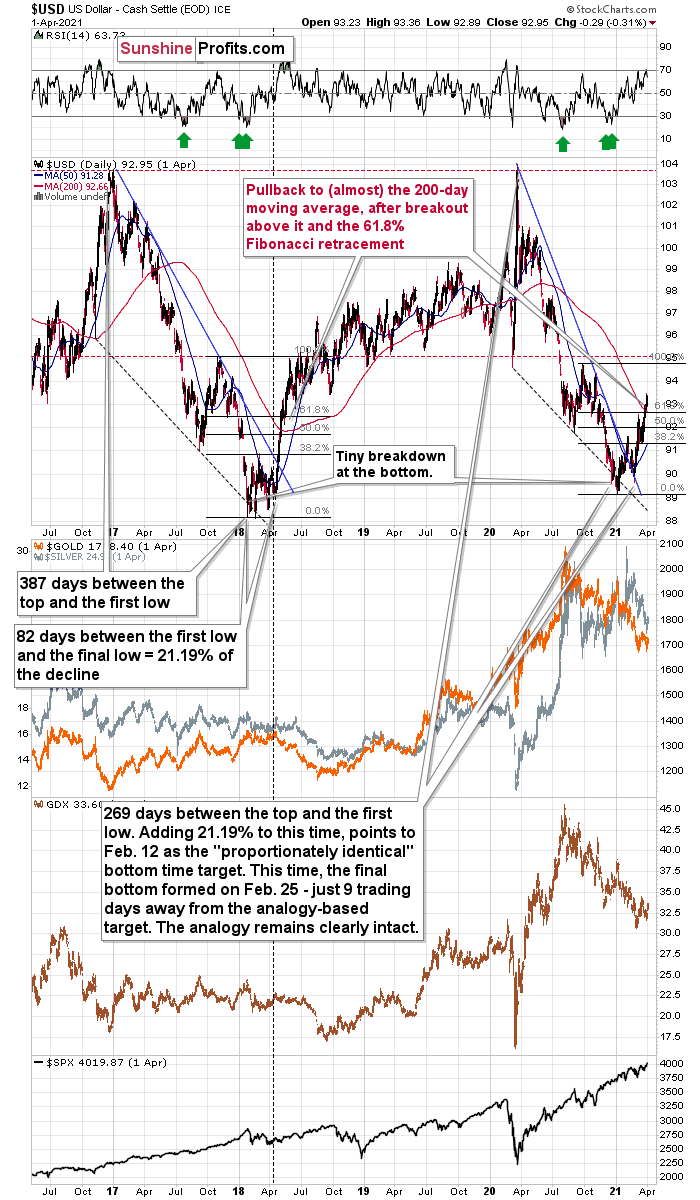
After rallying visibly above the:
- 93 level
- 200-day moving average
- 61.8% Fibonacci retracement level based on the final part of the decline
the USD Index moved back below the 93 level. This happened in May 2018 and it happened last week.
Since both rallies are so similar, it’s nothing odd that we see a pullback in a similar situation.
Back in 2018, the pullback was small and quick. It ended without the USD Index reaching its 200-day moving average. The pullback ended when the USDX moved approximately to its previous high and slightly below the 61.8% Fibonacci retracement.
Applying this to the current situation (previous high at about 92.5, the 61.8% Fibonacci retracement at about 92.7, and the 200-day moving average at 92.66), it seems that the USD Index would be likely to find its bottom in the 92.3 – 92.7 area. The USDX ended the week at 92.95, so it’s very close to reaching the upper border of the target area. The potential size of the decline seems relatively small.
This means that gold could rally some more here, but it’s not likely to be a game-changing rally.
It wouldn’t be something against what I wrote previously, either. Since we saw a repeat of the same technical development last week, what I wrote about the previous breakout applies also this time. On March 29, after gold’s small breakout above the declining resistance line, I wrote the following:
What breakout, you might ask? Gold closed the week slightly above the declining resistance line, which – while small – it still a breakout. This is a bullish development.
Please see below:
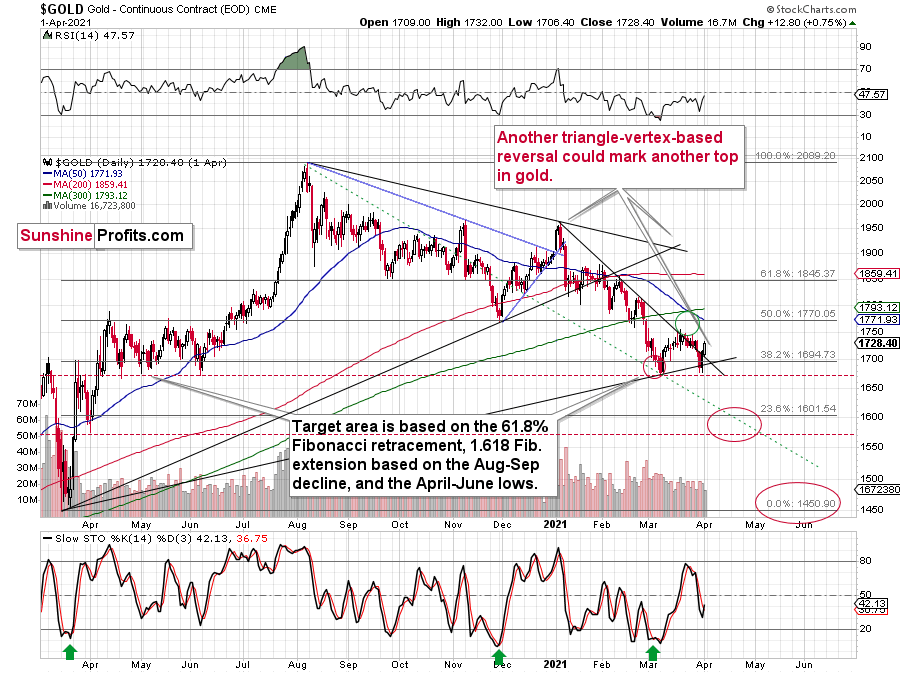
Given the mixed signals, the yellow metal could deliver a short-term bounce to ~$1,770 (the 50% Fibonacci retracement level) However, gold’s triangle-vertex-based reversal point (which I warned about previously and preceded the yellow metal’s prior swoon) originally set the table for a corrective rally in early April. However, let’s keep in mind that it could be actually a near-term top that is then followed by the powerful decline.
To explain, while a corrective upswing could (doesn’t have to) occur, ~$1,770 also coincides with gold’s 50-day MA (which should act as resistance).
Will we see gold rally from here? The jury remains out.
At the moment of writing these words, gold is trading once again very close to the previously broken line, ready to invalidate the breakout. If it does invalidate it (by moving below $1,725), then the bullish potential created by Friday’s rally will be gone.
Does the possibility (!) of seeing a temporary upswing imply that it’s a good idea to close our short positions? I don’t think so. In my view, the risk of missing the decline is too big and the situation in the USD Index is too bullish right now, to justify this action.
So, if a short-term bounce doesn’t take place, where could we be headed shortly?
Well, the 76.4% Fibonacci retracement level (it’s visible as the 23.6% Fibonacci retracement level on the above chart as inverting the scale is used as a workaround) also coincides with gold’s April 2020 low. Taken together, an interim bottom could form in the ~$1,575 to $1,600 range.
For context, back in early March, the yellow metal continued to decline after reaching the 61.8% Fibonacci retracement (visible as 38.2% Fibonacci retracement) level, while in contrast, the miners began to consolidate. Gold finally bottomed slightly below the retracement – at its previous lows. This time around, we might witness a similar event. And while the story plays out, the miners’ relative strength should signal the end of the slide (perhaps with gold close to 1,600), while gold will likely garner support sometime thereafter (at $1,575 – $1,580 or so).
Remember though: this is only an interim target. Over the medium term, the yellow metal will likely form a lasting bottom in the ~$1,450 to $1,500 range.
The key difference now is that it’s already early April right now.
This means that the bearish implications of the upcoming triangle-vertex-based reversal are now quite clear. As you can see on the above chart, the reversal is due next week, around April 7th. Consequently, if gold rallies from here (even to $1,770), it’s likely to top and launch another decline soon.
As I wrote above (and what I put in bold), I don’t think that it’s worth adjusting the current trading positions due to exactly the same reasons.
As far as mining stocks’ rally is concerned, I would also like to quote my previous comments – this time on the GDXJ. On Friday, I wrote the following:
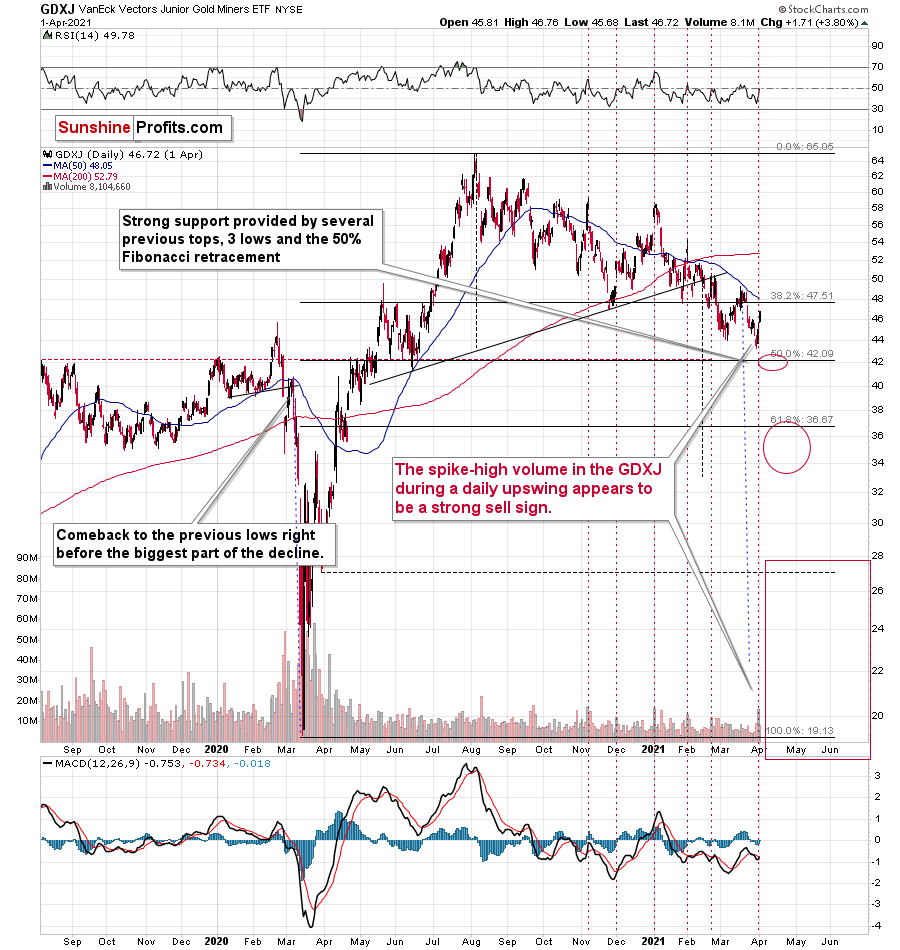
The GDXJ just rallied by over 3% and it happened on strong volume. In fact, the volume was exceptionally high – that was the second highest volume of the year. It was only slightly lower than what we saw on Jan. 4, which was the first session of the year. It was also the second-highest closing price of the year, which effectively means that it was the key top of the year.
In the recent past, there were 5 other cases, when the GDXJ rallied on volume that was much bigger than what used to be norm in the preceding days. In other words, there were 5 other cases when we saw spike-highs in GDXJ’s volume when it rallied. In 2 out of those 5 cases, the volume was similarly big as yesterday. That was in early Jan. 2021 and in Nov. 2020. In both cases massive declines started in the following days.
Out of the 3 remaining cases, 2 (early Feb., late Feb. 2021) were followed by declines as well. The only exception was the early Dec. 2020 where it was not the end of a short-term rally (we’re currently lower than at that time, though).
So, based on the close similarity we get the 2 out of 2 (100%) efficiency in the sell signal provided by GDXJ’s volume, and based on the broader similarity (4 out of 5 cases – 80% efficiency) the efficiency of the sell signal is big, anyway.
Consequently, it seems that what we saw yesterday was “fake and temporary” rally, not a “true” one.
Please note the part that I put in bold. The most similar session (volume-wise) to Thursday’s session was the one that preceded the final yearly top that started year’s biggest (so far) short-term decline. If the current situation is similar, then perhaps the top was already in.
Now, if gold rallies and USD Index declines over the next few days, miners could move higher as well, but again, it’s too likely that it won’t happen (or that the rally will be very brief) for me to write about adjusting the current short position in the miners. Naturally, each investor / trader is free to do as they choose, but I’m not adjusting my positions myself at this time.
There’s one more thing that I’d like to follow-up on. In Friday’s Gold & Silver Trading Alert, I wrote the following in one of the replies to questions that I had received:
It seems that the lack of declines in stocks is the factor that makes the mining stocks decline only “normally”. Once the general stock market finally slides, I expect mining stocks (and then, a bit later, silver) to slide very significantly, not “normally”. In my view the stock market is forming a major, long-term top here, and such tops can take quite some time to form – at least in the case of stocks (gold and silver tend to have spike-shaped tops). Being close to 4000, it might be the case that the S&P 500 index will start to slide once it reaches (or almost reaches) this round level. Round levels tend to be important psychologically, so it might be (but doesn’t have to be) the trigger for stocks’ big decline that would in turn greatly accelerate miners’ decline. Please note that the March 2020 slide started after the S&P 500 almost reached the round level of 3400 (the intraday high was 3397.50).
Stocks have indeed rallied to the 4000 level, and they even ended the week slightly above it. Perhaps the critical price level that was “supposed” to be reached – was just reached.
The similarity to the early 2020 performance is uncanny right now. Back then, stocks had to move a bit above their previous highs to start the powerful slide.
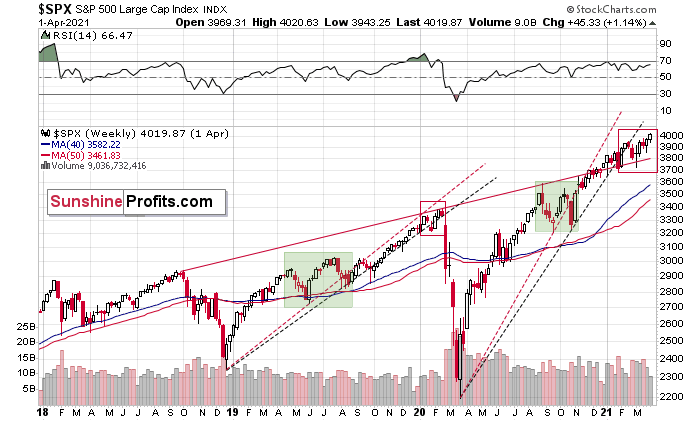
As a reminder, I wrote the following about the above chart in Monday’s flagship Gold & Silver Trading Alert:
Shades of 2018-2019, the S&P 500’s current price action is following a familiar script. Back then, the U.S. equity benchmark recorded a sharp move higher, consolidated (with heightened volatility, which I marked with a green box below), continued its uptrend, then suffered a material drawdown. Something very similar happened in the past 12 months – at least the upswing part.
After the second bottom of the green-shaded area, the S&P 500 rallied in a stable manner between rising black and red lines that were based on the previous bottoms. The breakdown below them was accompanied by increased volatility and then the stock market plunged. We’ve seen everything from that pattern also this time, only the plunge hasn’t started… Yet.
In similar fashion, today, the S&P 500’s fits and starts are signaling an identical outcome. After breaking below its red and black dashed rising support lines in 2020 and 2021 (on the right side of the chart), the S&P 500 is currently trading below both levels. Furthermore, the heightened volatility that unfolded from August to October is a tell-tale sign that the 2018-2019 analogue could rear its ugly head.
The above is yet another reason to expect another powerful slide in the following weeks, perhaps starting sooner than many expect. The above would be like adding gasoline under bearish fire that’s already consuming the precious metals sector, with particular bearish emphasis on mining stocks (first) and silver (later).
All in all, the bearish outlook for the precious metals sector remains intact for the following weeks, even though the outlook for the next few days remains relatively unclear.
Overview of the Upcoming Part of the Decline
- It seems quite likely to me that we are already after the initial bottom and the initial correction. If not, then it seems likely to me that the corrective upswing will be completed within the next 2 weeks (with PMs topping in early April). It’s more likely that the next big move lower is already underway, though.
- After miners slide once again in a meaningful and volatile way, but silver doesn’t (and it just declines moderately), I plan to switch from short positions in miners to short positions in silver (this could take another 1-2 weeks to materialize). I plan to exit those short positions when gold shows substantial strength relative to the USD Index, while the latter is still rallying. This might take place with gold close to $1,450 - $1,500 and the entire decline (from above $1,700 to about $1,475) would be likely to take place within 1-12 weeks and I would expect silver to fall hardest in the final part of the move. This moment (when gold performs very strongly against the rallying USD and miners are strong relative to gold – after gold has already declined substantially) is likely to be the best entry point for long-term investments in my view. This might happen with gold close to $1,475, but it’s too early to say with certainty at this time. In other words, the entire decline could take between 1 and 12 weeks, while silver declines occuring particularly fast in the final 1-2 weeks.
- If gold declines even below $1,500 (say, to ~$1350 or so), then it could take another 10 weeks or so for it to bottom, but this is not what I view as a very likely outcome.
- As a confirmation for the above, I will use the (upcoming or perhaps we have already seen it?) top in the general stock market as the starting point for the three-month countdown. The reason is that after the 1929 top, gold miners declined for about three months after the general stock market started to slide. We also saw some confirmations of this theory based on the analogy to 2008. All in all, the precious metals sector would be likely to bottom about three months after the general stock market tops . If the mid-February 2020 top was the final medium-term top (based on NASDAQ’s top, then it seems that we might expect the precious metals sector to bottom in mid-May or close to May’s end. If, however, the mid-March 2021 top was the final medium-term top (based on the S&P 500), then we might expect the precious metals sector to bottom in mid-June or close to June’s end.
- The above is based on the information available today and it might change in the following days/weeks.
Letters to the Editor
Q: Shall we assume the two day large increases in GDx, GDXJ, and other speculative short positions are something we should continue to hold or even add to?
Assuming we sold our long positions and bought short positions, at that time, we are now at lower prices. Are we confident enough to add more to our short positions and dollar cost average at lower prices?
A: In my opinion, each investor/trader should follow their approach and strategy, while considering the information from reliable sources. If one chooses to use my insights as such information, then I would like to clarify that in my view the outlook and trading positions that I’m describing in the analyses remain intact. I’m neither adding to them based on the recent price action, nor am I limiting or closing them. However, I don’t want to say that this is the correct approach for each and every trader/investor out there – the preferred action would depend on one’s individual risk tolerance and many other factors.
Summary
To summarize, the PMs’ medium-term decline is well underway, and based on the recent performance of the USD Index, gold and mining stocks, it seems that the corrective upswing is already over (or about to be over – perhaps as early as next week). The next big move lower seems to be already underway or about to start.
In addition, because we’re likely entering the “winter” part of the Kondratiev cycle (just like in 1929 and then the 1930s), the outlook for the precious metals’ sector remains particularly bearish during the very first part of the cycle, when cash is king.
The confirmed breakout in the USD Index is yet another confirmation of the bearish outlook for the precious metals market.
After the sell-off (that takes gold to about $1,450 - $1,500), we expect the precious metals to rally significantly. The final part of the decline might take as little as 1-5 weeks, so it's important to stay alert to any changes.
Most importantly, please stay healthy and safe. We made a lot of money last March and it seems that we’re about to make much more on this March decline, but you have to be healthy to enjoy the results.
As always, we'll keep you - our subscribers - informed.
By the way, we’re currently providing you with a possibility to extend your subscription by a year, two years or even three years with a special 20% discount. This discount can be applied right away, without the need to wait for your next renewal – if you choose to secure your premium access and complete the payment upfront. The boring time in the PMs is definitely over and the time to pay close attention to the market is here. Naturally, it’s your capital, and the choice is up to you, but it seems that it might be a good idea to secure more premium access now, while saving 20% at the same time. Our support team will be happy to assist you in the above-described upgrade at preferential terms – if you’d like to proceed, please contact us.
To summarize:
Trading capital (supplementary part of the portfolio; our opinion): Full speculative short positions (300% of the full position) in mining stocks are justified from the risk to reward point of view with the following binding exit profit-take price levels:
Mining stocks (price levels for the GDXJ ETF): binding profit-take exit price: $24.12; stop-loss: none (the volatility is too big to justify a stop-loss order in case of this particular trade)
Alternatively, if one seeks leverage, we’re providing the binding profit-take levels for the JDST (2x leveraged) and GDXD (3x leveraged – which is not suggested for most traders/investors due to the significant leverage). The binding profit-take level for the JDST: $39.87; stop-loss for the JDST: none (the volatility is too big to justify a SL order in case of this particular trade); binding profit-take level for the GDXD: $94.87; stop-loss for the GDXD: none (the volatility is too big to justify a SL order in case of this particular trade).
For-your-information targets (our opinion; we continue to think that mining stocks are the preferred way of taking advantage of the upcoming price move, but if for whatever reason one wants / has to use silver or gold for this trade, we are providing the details anyway.):
Silver futures upside profit-take exit price: unclear at this time - initially, it might be a good idea to exit, when gold moves to $1,512.
Gold futures upside profit-take exit price: $1,512.
Long-term capital (core part of the portfolio; our opinion): No positions (in other words: cash
Insurance capital (core part of the portfolio; our opinion): Full position
Whether you already subscribed or not, we encourage you to find out how to make the most of our alerts and read our replies to the most common alert-and-gold-trading-related-questions.
Please note that we describe the situation for the day that the alert is posted in the trading section. In other words, if we are writing about a speculative position, it means that it is up-to-date on the day it was posted. We are also featuring the initial target prices to decide whether keeping a position on a given day is in tune with your approach (some moves are too small for medium-term traders, and some might appear too big for day-traders).
Additionally, you might want to read why our stop-loss orders are usually relatively far from the current price.
Please note that a full position doesn't mean using all of the capital for a given trade. You will find details on our thoughts on gold portfolio structuring in the Key Insights section on our website.
As a reminder - "initial target price" means exactly that - an "initial" one. It's not a price level at which we suggest closing positions. If this becomes the case (like it did in the previous trade), we will refer to these levels as levels of exit orders (exactly as we've done previously). Stop-loss levels, however, are naturally not "initial", but something that, in our opinion, might be entered as an order.
Since it is impossible to synchronize target prices and stop-loss levels for all the ETFs and ETNs with the main markets that we provide these levels for (gold, silver and mining stocks - the GDX ETF), the stop-loss levels and target prices for other ETNs and ETF (among other: UGL, GLL, AGQ, ZSL, NUGT, DUST, JNUG, JDST) are provided as supplementary, and not as "final". This means that if a stop-loss or a target level is reached for any of the "additional instruments" (GLL for instance), but not for the "main instrument" (gold in this case), we will view positions in both gold and GLL as still open and the stop-loss for GLL would have to be moved lower. On the other hand, if gold moves to a stop-loss level but GLL doesn't, then we will view both positions (in gold and GLL) as closed. In other words, since it's not possible to be 100% certain that each related instrument moves to a given level when the underlying instrument does, we can't provide levels that would be binding. The levels that we do provide are our best estimate of the levels that will correspond to the levels in the underlying assets, but it will be the underlying assets that one will need to focus on regarding the signs pointing to closing a given position or keeping it open. We might adjust the levels in the "additional instruments" without adjusting the levels in the "main instruments", which will simply mean that we have improved our estimation of these levels, not that we changed our outlook on the markets. We are already working on a tool that would update these levels daily for the most popular ETFs, ETNs and individual mining stocks.
Our preferred ways to invest in and to trade gold along with the reasoning can be found in the how to buy gold section. Furthermore, our preferred ETFs and ETNs can be found in our Gold & Silver ETF Ranking.
As a reminder, Gold & Silver Trading Alerts are posted before or on each trading day (we usually post them before the opening bell, but we don't promise doing that each day). If there's anything urgent, we will send you an additional small alert before posting the main one.
Thank you.
Przemyslaw Radomski, CFA
Founder, Editor-in-chief

