

Briefly: in our opinion, full (300% of the regular position size) speculative short positions in mining stocks are justified from the risk/reward point of view at the moment of publishing this Alert.
In yesterday’s flagship Gold & Silver Trading Alert, I emphasized that the next short-term top in the precious metals market is likely to be formed this week, most likely on Wednesday or Thursday. The basis for this forecast was the triangle-vertex-based reversal in gold as well as USD’s correction that appears to be analogous to its 2018 correction that was followed by another powerful rally.
In short, the above expectation (and reasoning behind it) remains up-to-date. Let’s start today’s discussion with a look at the USD Index.
On Friday (Apr. 2), I wrote the following:
What we saw yesterday definitely qualifies as a small correction. In fact, even if it was doubled it would still be small. And – more importantly – it would be in perfect tune with what happened in 2018 during the big rally.
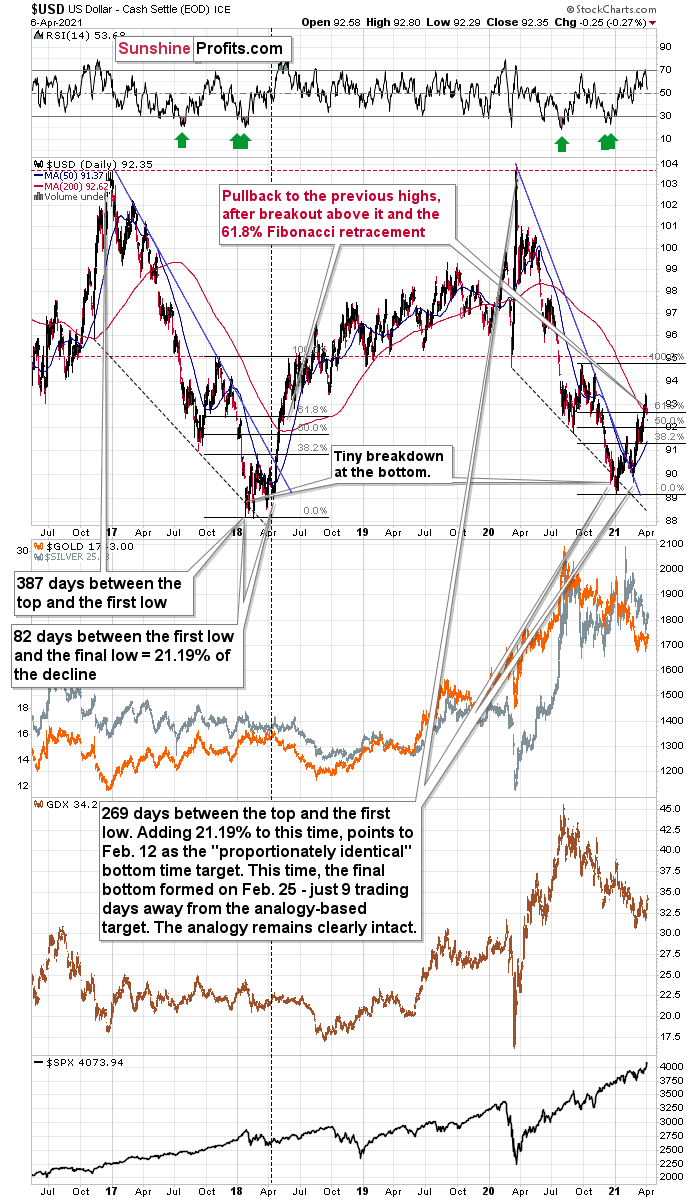
After rallying visibly above the:
- 93 level
- 200-day moving average
- 61.8% Fibonacci retracement level based on the final part of the decline
the USD Index moved back below the 93 level. This happened in May 2018 and it happened last week.
Since both rallies are so similar, it’s nothing odd that we see a pullback in a similar situation.
Back in 2018, the pullback was small and quick. It ended without the USD Index reaching its 200-day moving average. The pullback ended when the USDX moved approximately to its previous high and slightly below the 61.8% Fibonacci retracement.
Applying this to the current situation (previous high at about 92.5, the 61.8% Fibonacci retracement at about 92.7, and the 200-day moving average at 92.66), it seems that the USD Index would be likely to find its bottom in the 92.3 – 92.7 area.
The early-March high was 92.53 in intraday terms, and it was 92.33 in terms of the closing prices. The USD Index moved briefly to 92.29 yesterday, but it ended the day at 92.35. This means that it moved back to the previous high in terms of the daily closing prices. It also moved below the 61.8% Fibonacci retracement. Consequently, what happened yesterday (and its consequences on the precious metals market) were relatively normal – they didn’t change the outlook.
Unfortunately, unlike the case in early March, this counter-trend rally wasn’t likely enough to happen for us to temporarily switch to a long position. Theoretically, everyone knows that it’s impossible to catch each and every move and correction, and it’s pointless to expect oneself and others to be able to pinpoint each and every move. On the other hand, I realize that it’s unpleasant and disappointing to see such a correction unfold without changing the outlook, so the preferred action is to simply wait while the market moves temporarily against one. It’s difficult, but let’s keep in mind that it’s the kind of “difficult” that every investor and trader chooses when they decide to invest or trade at all – there’s no way to eliminate these “unwelcome” periods in their entirety. What one can do is to focus on the outlook, on proper position size management and on patience in exercising the actions (or lack thereof) that stem from both the above.
Fortunately, it seems that the corrective downswing in the USD Index is over or almost over now. This – along with the triangle-vertex-based reversal in gold – suggests that the rally in the PMs is over as well, or close to being so.
Quoting yesterday’s analysis of gold:
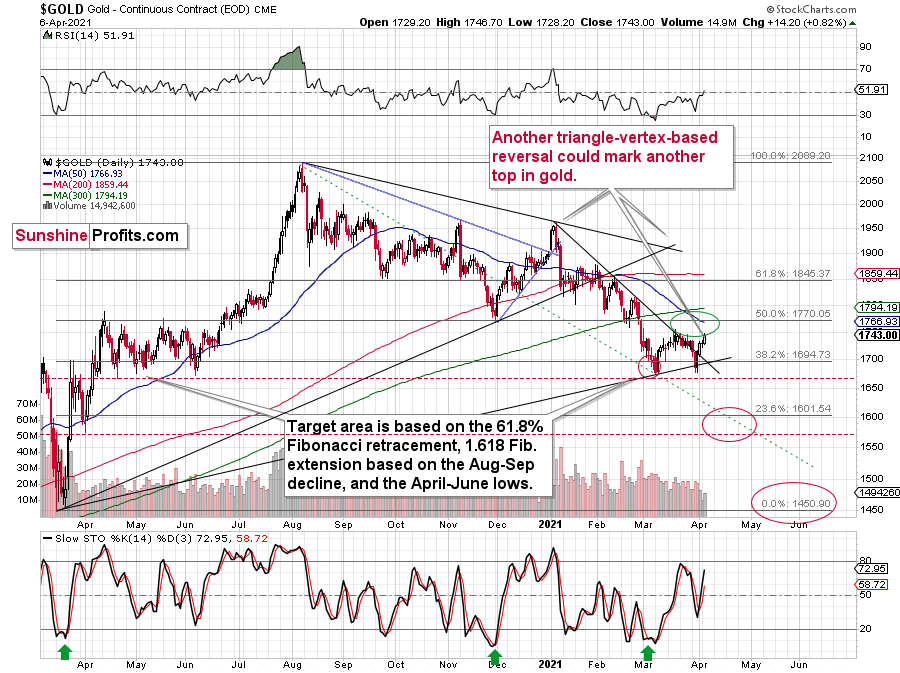
About to meet its maker, the Grim Reaper could surprise the yellow metal this week. With the guillotine likely to drop on Wednesday (Apr. 7) or Thursday (Apr. 8), gold is on a collision course with its triangle-vertex-based reversal point. The chart points to it being “in between” of those two days, so it’s likely to be on either of them or in their close proximity, effectively meaning this week. Moreover, given the yellow metal’s inability to capitalize on the USD Index’s misfortune, the former could already be a dead man walking.
(…)
We now know that there is indeed some kind of corrective upswing right now, but the upside target remains exactly as it was previously – we could have seen the top already today, or gold might move slightly higher before topping. The ~$1,770 level seems to be the maximum short-term upside target.
Also, please note that it seems that gold is moving in a way that’s somewhat similar to what we saw between mid-April 2020 and mid-June 2020. It’s trading sideways below $1,800 but above ~$1,660. Back in 2020, the range of the back-and-forth movement (size of the short-term rallies and declines) was bigger, but the preceding move was also more volatile, so it’s normal to expect smaller short-term volatility this year (at least at during this consolidation).
Why is this particularly interesting? Because both consolidations (the mid-April 2020 – mid-June 2020 one and the March 2021 – today one) could be the shoulders of a broad head-and-shoulders pattern, where the mid-June 2020 – early-March 2021 performance would be the head. The breakdown below the neck level – at about $1,660 – would be extremely bearish in this case, because the downside target based on the pattern is created based on the size of the head. The target based on this broad pattern would be at about $1,350. (…)
Is this level possible? It is. When gold soared above $2,000, almost nobody thought that it would decline back below its 2011 highs (well, you – my subscribers – did know that). Gold below $1,500 seems unthinkable now, but with rallying long-term rates and soaring USD Index, it could really happen.
The above remains up-to-date. I would also like to add that gold moved higher yesterday on volume that was relatively low. The size of the move and the low volume make this action similar to what we saw in early February 2021 – just another relatively small corrective upswing.
Given what happened in the USD Index and gold, and combining this with the stock market’s new highs, it’s no wonder that mining stocks also moved higher in the recent days.
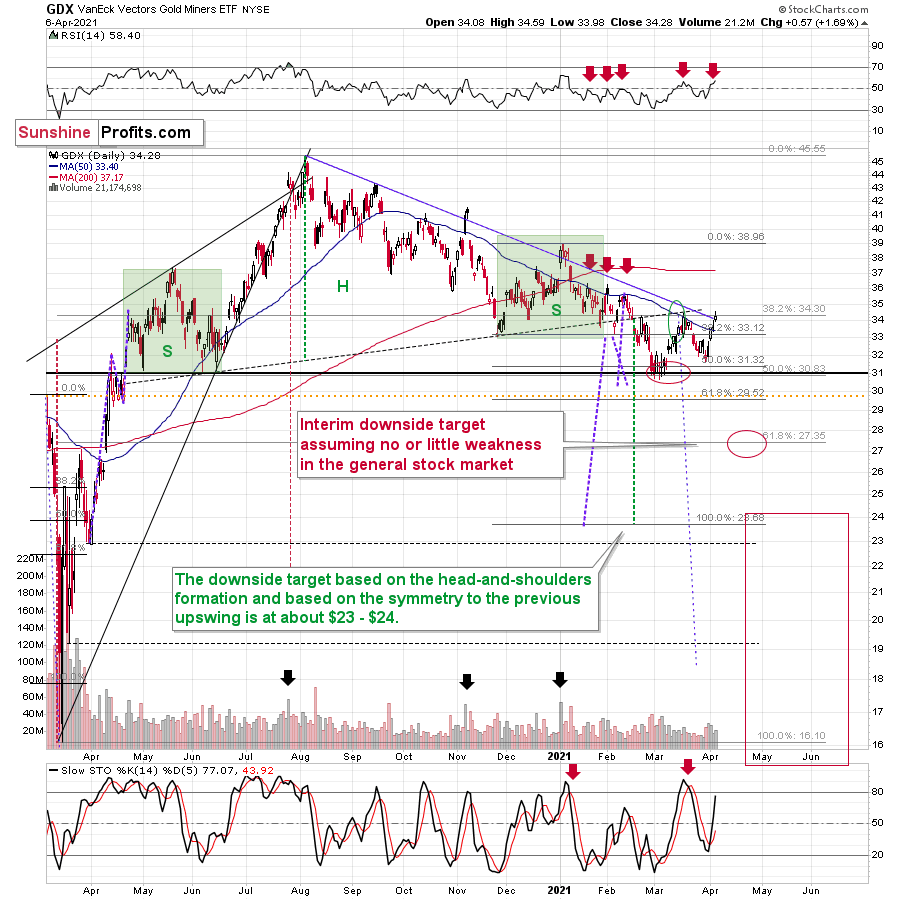
The GDX just moved visibly above its 50-day moving average and also slightly above its declining resistance line. This seems bullish at first sight, but let’s keep in mind that it was exactly this kind of performance that directly preceded this year’s top in early January. Are we about to see a big decline just like we saw it in January? In my opinion, yes, but this time it’s likely to be even bigger.
Just as gold is likely to reverse its course this week, the same is likely for the mining stocks. My comments from yesterday and the previous days remain generally up-to-date:
In addition, while the GDX ETF’s RSI (Relative Strength Index) moving above 50 appears bullish, the achievement has coincided with four material declines since the New Year (the red arrows at the very-top of the chart). As a result, the medium-term outlook remains profoundly bearish.
And why is this the case? Well, notwithstanding the bullish long-term outlook for the USD Index and the massive rally in the long-term interest rates, the shape of the early-January slide also mirrors today’s price action.
To explain, back in January, the GDX ETF recorded a material daily rally, consolidated, then sunk like a stone. Because of that, a short-term upswing within the context of a medium-term decline is nothing to write home about.
I wrote on Mar. 18:
The GDX ETF encountered the strongest combination of resistance areas, while the Stochastic indicator moved above the 80-level. Technically, the situation is now much more bearish in the GDX ETF chart than it was at the beginning of the year. Back in January, the GDX ETF was only at the declining blue resistance line.
Now, in addition to being very close to the above-mentioned line it’s also at:
- The neck level of the previously broken broad head and shoulders pattern
- The 50-day moving average
- The previous (late-February) highs.
But if we’re headed for a GDX ETF cliff, how far could we fall?
Well, there are three reasons why the GDX ETF might form an interim bottom at roughly ~$27.50 (assuming no big decline in the general stock market):
- The GDX ETF previously bottomed at the 38.2% and 50.0% Fibonacci retracement levels. And with the 61.8% level next in line, the GDX ETF is likely to garner similar support.
- The GDX ETFs late-March 2020 high should also elicit buying pressure.
- If we copy the magnitude of the late-February/early-March decline and add it to the early-March bottom, it corresponds with the GDX ETF bottoming at roughly $27.50.
Keep in mind though: if the stock market plunges, all bets are off. Why so? Well, because when the S&P 500 plunged in March 2020, the GDX ETF moved from $29.67 to below $17 in less than two weeks. As a result, U.S. equities have the potential to make the miners’ forthcoming swoon all the more painful.
Also supporting the potential move, the GDX ETF’s head and shoulders pattern – marked by the shaded green boxes above – signals further weakness ahead.
I wrote previously:
The most recent move higher only made the similarity of this shoulder portion of the bearish head-and-shoulders pattern to the left shoulder) bigger. This means that when the GDX breaks below the neck level of the pattern in a decisive way, the implications are likely to be extremely bearish for the next several weeks or months.
Having said that, let’s take a look at the market from a more fundamental angle.
If at First You Don't Succeed, Try, Try Again
Three months ago, the EUR/USD was on top of the world: vaccine optimism, pent-up demand and the prospect of a resurgent real economy had Europe strutting into 2021. However, because the narrative was much more semblance than substance, I warned on Dec. 30 that euro bulls are fighting a war they’re unlikely to win.
And despite falling from an intraday high of 1.235 on Jan. 6 to an intraday low of 1.1703 on Mar. 31, the currency pair continues to argue with reality. However, like it was then it still is now, much more semblance than substance.
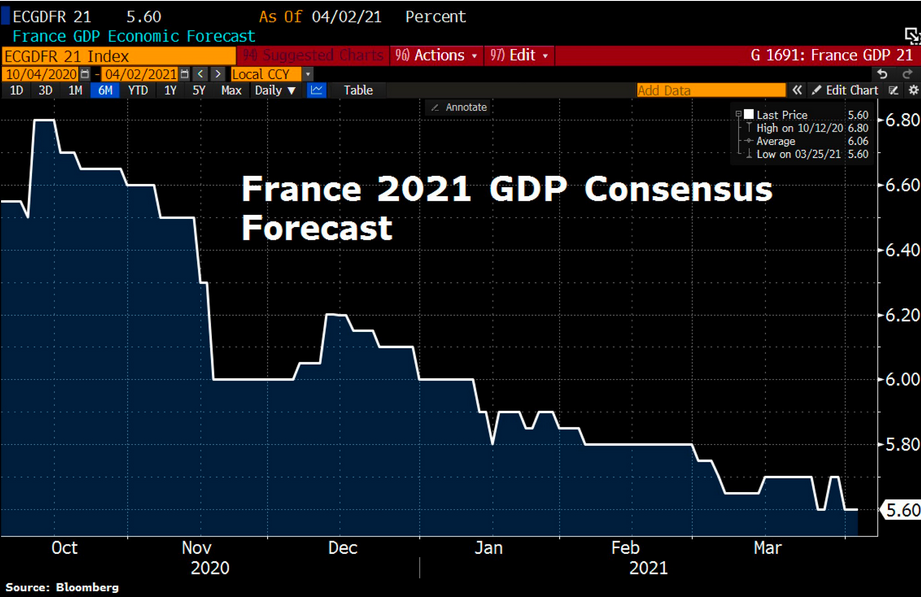
On Feb. 17, I wrote that the European Commission’s projection that France will deliver 5.5% GDP growth in 2021 was overwhelmingly ambitious. Moreover, after Europe’s second-largest economy went back into lockdown on Mar. 31, I wrote, can we finally stick a fork in France’s economic renaissance?
Well, despite the EUR/USD rallying by 1.25% since, on Apr. 3, French Finance Minister Bruno Le Maire decreased his government’s 2021 GDP growth forecast from 6% to 5%. Moreover, his projection is now below economists’ consensus estimates (which still remain ambitious at 5.60%).
Please see below:
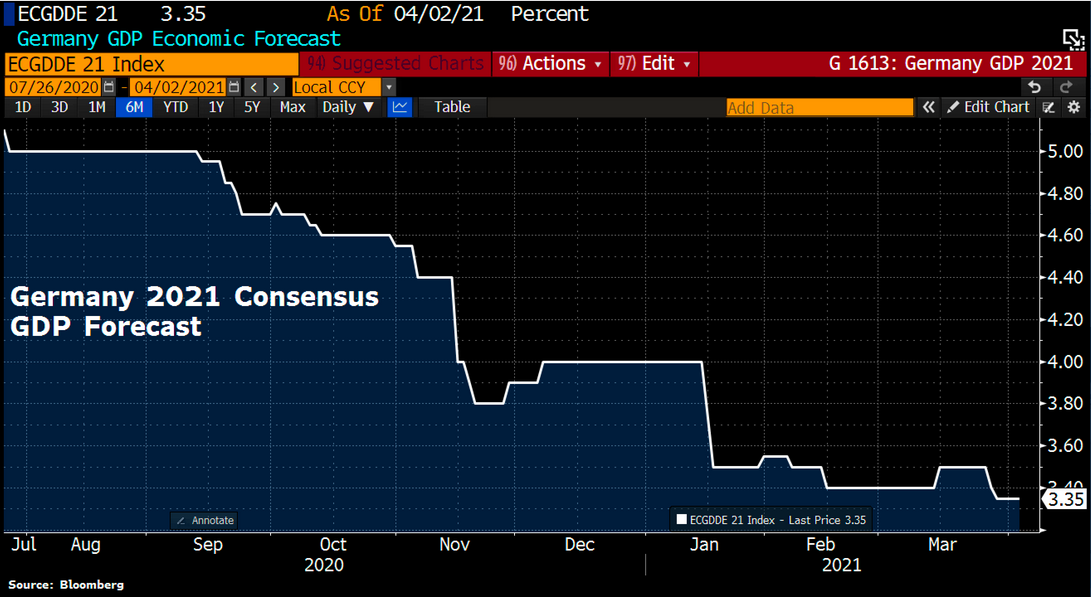
As for Europe’s largest economy, economists also slashed their consensus 2021 GDP growth estimates for Germany. Projecting 4% growth on Jan 1, the German economy is now expected to grow by only 3.35%.
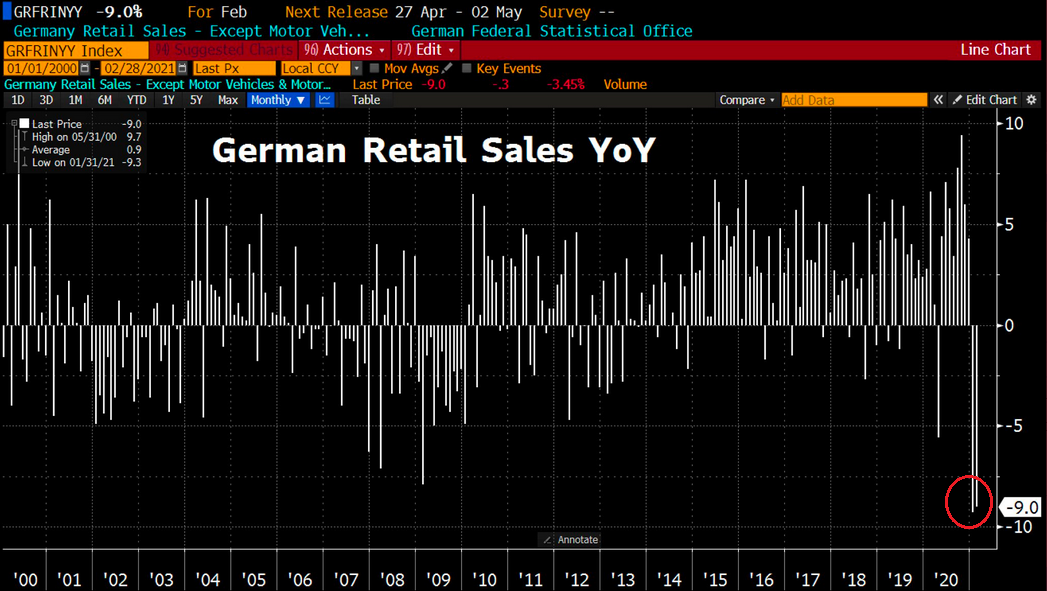
Unsurprisingly, because many analysts follow price rather than lead it, the GDP cut occurred exactly one day after German retail sales plunged by 9%. Significantly underperforming economists’ consensus estimates – as they expected a decline of only 6.3% – February’s print was actually worse than the 8.7% decline recorded in January.
Please see below:
 Source: Holger Zschaepitz
Even more telling, Germany and the U.S. are headed in opposite directions. If you analyze the right side of the chart below, notice the extreme divergence between U.S. and Germany’s 2021 consensus GDP growth estimates?
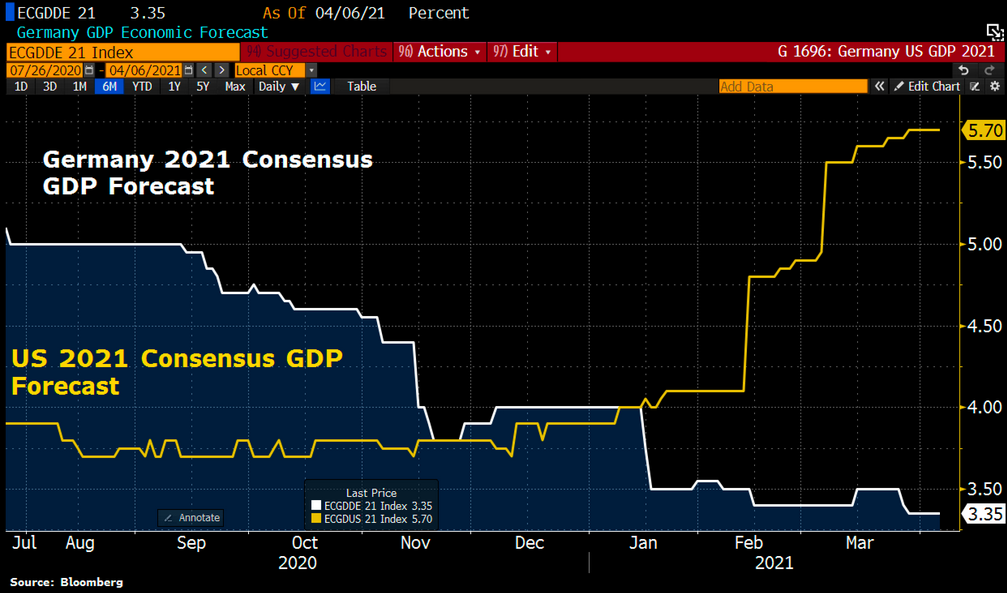
For context, the yellow line above tracks U.S. GDP growth estimates, while the white line above tracks German GDP growth estimates. Thus, while the EUR/USD moves higher, Eurozone-U.S. growth differentials are doing the exact opposite.
Makes sense?
If that wasn’t enough, releasing its latest World Economic Outlook report on Apr. 6, the International Monetary Fund (IMF) increased its 2021 U.S. GDP growth estimate by 1.3 points (compared to its January forecast), while only increasing its Euro Area 2021 GDP growth estimate by 0.2 points. Even more revealing, relative to France, Italy and Spain, Germany’s 2021 GDP growth forecast was only increased by 0.1 points – the lowest among Europe’s four major economies.
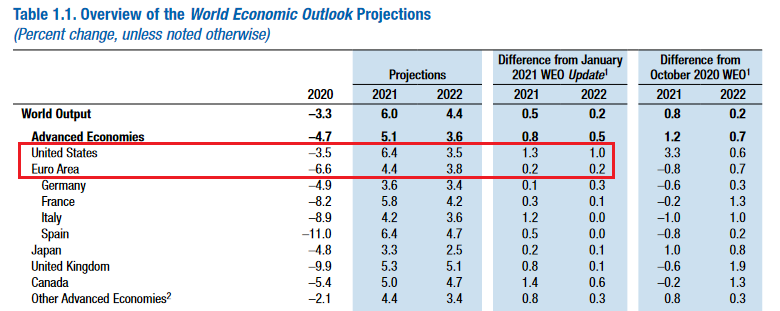 Source: IMF
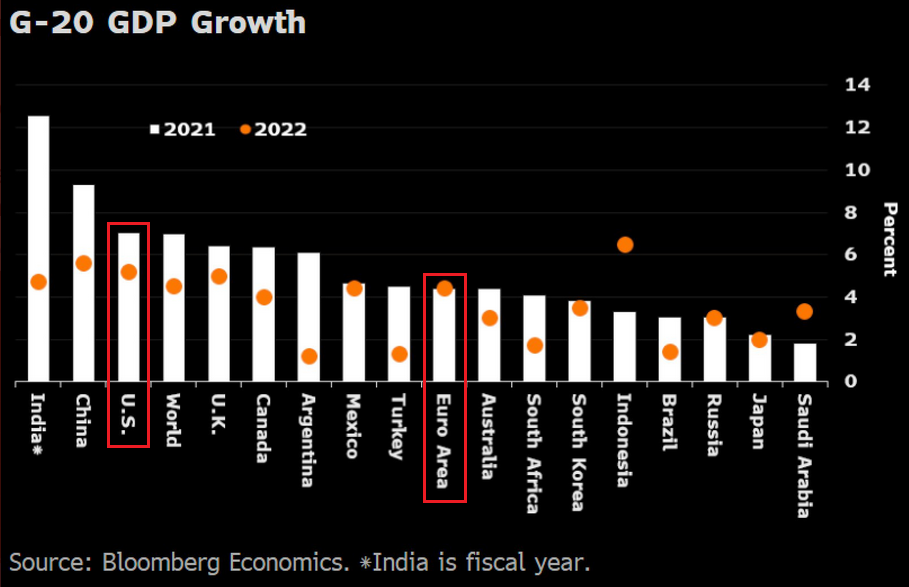
Adding insult to injury, not only does Bloomberg Economics expect the U.S. to outperform Europe in 2021, but the trend is also expected to continue in 2022.
Please see below:
Furthermore, while Europe’s economic plight worsens – a development that currency traders are eager to ignore – I warned on Jan. 12 (and several other occasions) that the European Central Bank (ECB) will have to increase its bond-buying program to help mitigate the fundamental weakness. In turn, this increases the supply of euros, relative to U.S. dollars, and is extremely bearish for the EUR/USD.
And with reality revealing what hope wants to hide, last week, the ECB increased its balance sheet by €343 billion (the largest increase since June 2020). More importantly though, the FED/ECB ratio – which measures U.S.-Eurozone monetary money supply differentials – plunged by 4.95%.
In addition, as the fundamental hole deepens, European officials take comfort in the belief that pent-up demand will save the day. However, with the savings story akin to folklore, the dream is quickly fading. Case in point: if you analyze the chart below, you can see that Europeans aged 16-49 have very little household savings (the yellow bars).
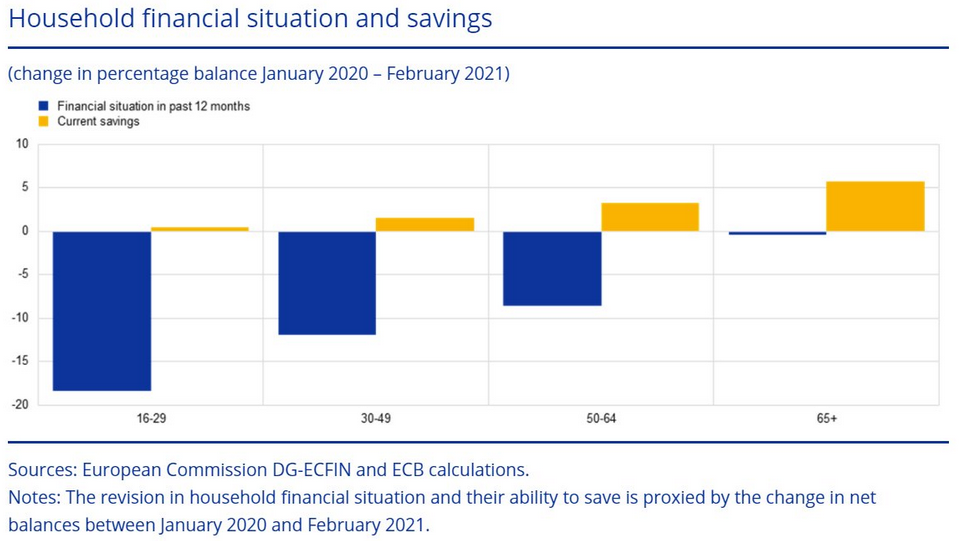
Additionally, with Europeans aged 65 and above owning the bulk of household wealth, their spending habits are unlikely to trigger an economic revival. Think about it: the elderly are at the highest risk of COVID-19 complications. Conversely, young people, who are at the lowest risk, are more likely to return to restaurants, pubs and shopping venues. However, because the lowest-risk age cohorts remain in the worst financial condition (see the blue bars above depicting the negative change in their finances over the last 12 months), it will take even more spending to maintain what’s left of Europe’s fading economic momentum.
Adding to the bearish EUR/USD cocktail, while the spot market adopts a mantra of ‘ignorance is bliss,’ non-commercial (speculative) futures traders are behaving like the writing is already on the wall. Case in point: last week, speculators reduced their EUR/USD long positions by more than 700 contracts and increased their EUR/USD short positions by nearly 19,000 contracts.
Please see below:
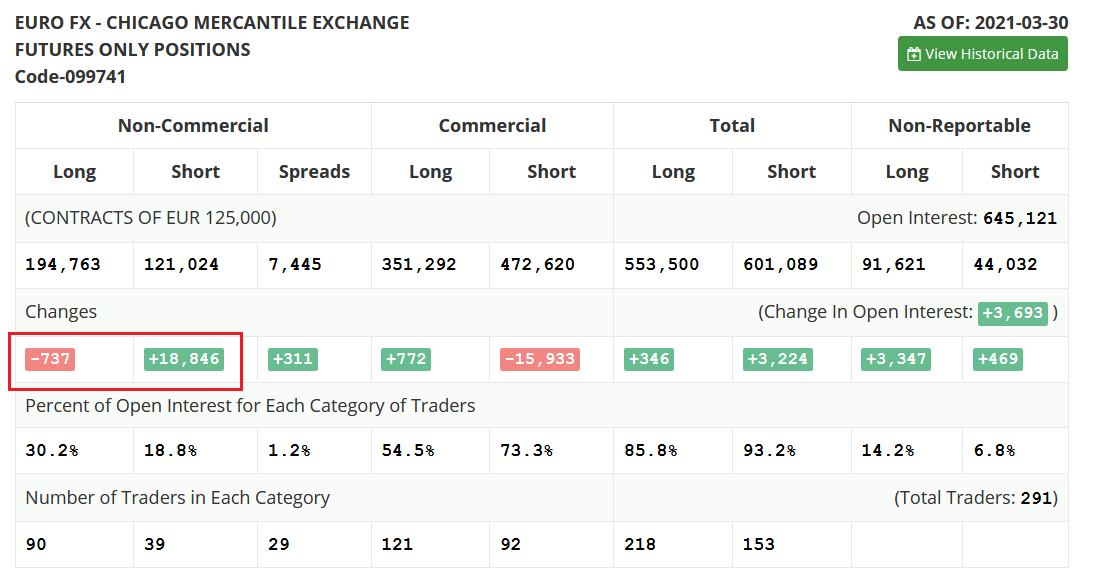 Source: COT
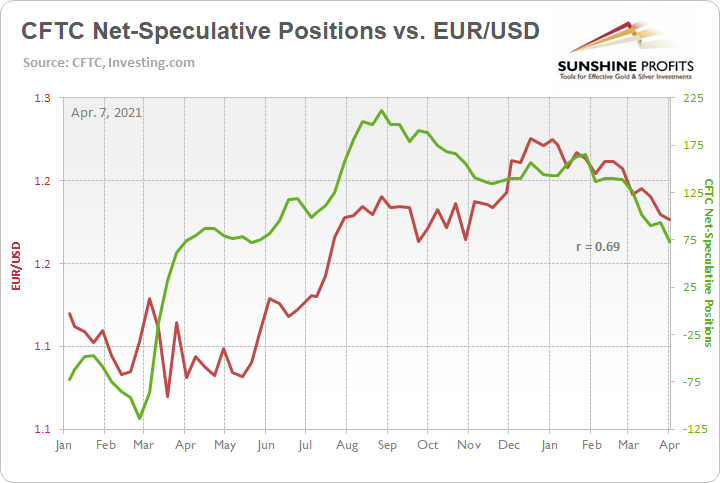
More importantly though, their behavior has a profound impact on the EUR/USD. If you analyze the chart below, you can see that the currency pair tends to rise and fall with speculative net-futures positioning.
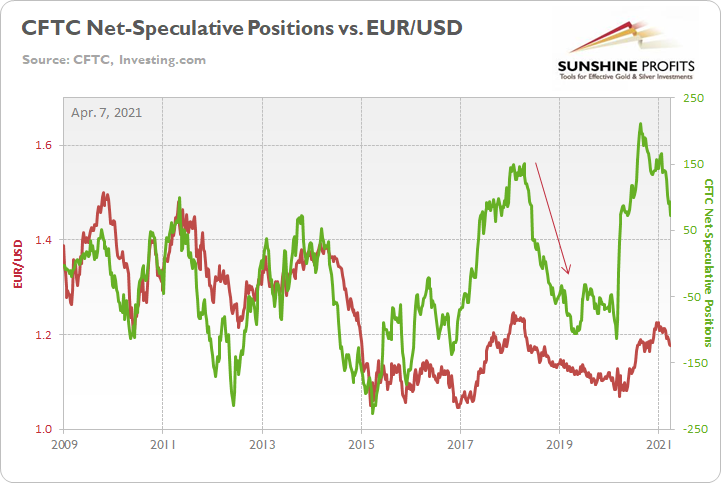
As further evidence, the two variables have a 15-month positive correlation of 0.69.
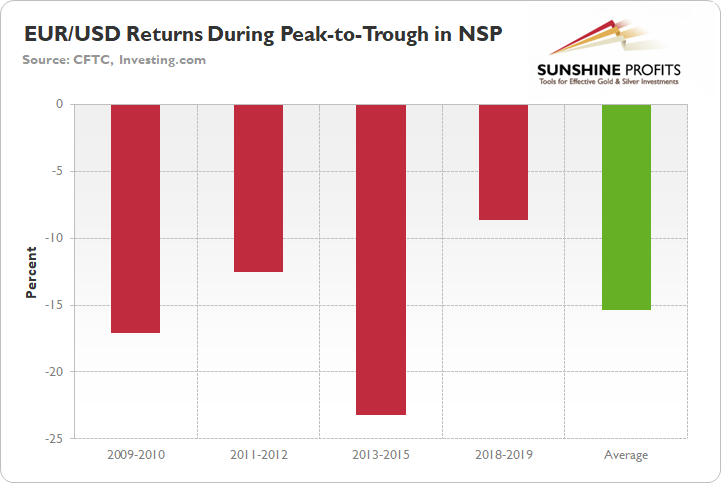
Moreover, if you analyze the right side of the long-term chart above (2009-2021), you can see that speculative net-futures positioning has already begun to roll over. And with the 2020 reading by far the highest on record, the last four times speculative net-futures positioning moved from peak-to-trough, the EUR/USD declined by an average of 15.35%.
Please see below:
As well,, because it pays to be conservative, if we apply the 2018-2019 analogue – marked by the arrow on the long-term chart above (2009-2021) – by the time speculative net-futures positioning troughed (at net-short 106,000 contracts), the EUR/USD had declined by 8.6%. Today, speculative futures traders remain net-long 73,000 contracts. However, because the devil is in the details, they were net-long 165,000 contracts just two months ago (which actually exceeded the 2018 peak).
As a result, if speculative net-futures positioning continues its rapid descent, an identical 8.6% decline would usher the EUR/USD back to 1.09. Also noteworthy, the level aligns perfectly with the EUR/USD’s mid-May highs and its late-May lows.
Please see below:
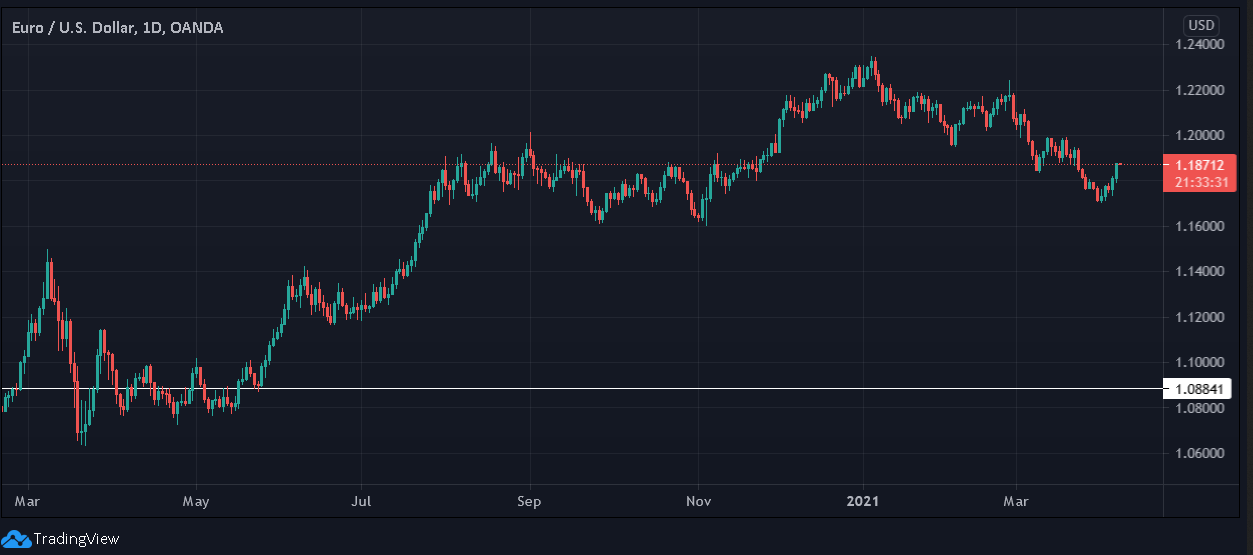
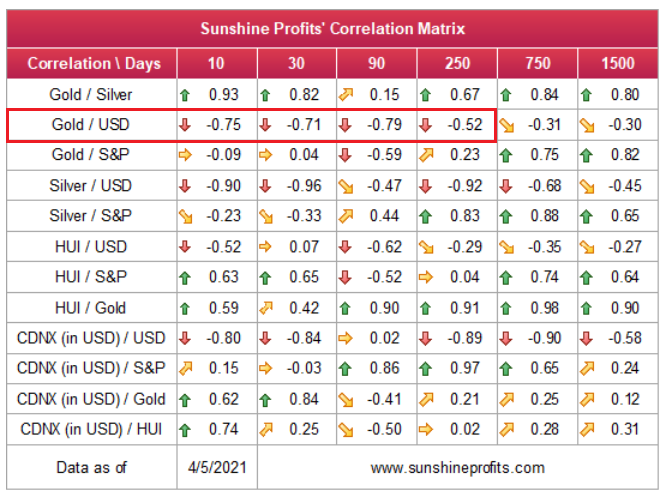
Even more important, the EUR/USD accounts for nearly 58% of the movement in the USD Index. Think of it like this: for every 1% decline in the EUR/USD, the USD Index rises by ~0.58% (holding all else constant). And because gold has a strong negative correlation with the U.S. dollar, a material decline in the EUR/USD will likely sound the death knell for the yellow metal.
In conclusion, the EUR/USD’s recent strength lacks both fundamental and technical conviction. Despite taking its cue from equity bulls, Europe’s economic plight has the euro on shaky ground. Case in point: despite the show of force, the EUR/USDs’ rallies on Apr. 5 and Apr. 6 occurred on volume that was 47% and 14% below the 20-day moving average. As a result, while the PMs reacted positively to the USD Index’s decline – coupled with the consolidation in U.S. Treasury yields – a reversal of fortune is likely to play out over the medium term.
Overview of the Upcoming Part of the Decline
- It seems quite likely to me that we are already after the initial bottom and the initial correction. If not, then it seems likely to me that the corrective upswing will be completed within a week or so (with PMs topping in early April). It’s also quite possible that the next big move lower is already underway, though.
- After miners slide once again in a meaningful and volatile way, but silver doesn’t (and it just declines moderately), I plan to switch from short positions in miners to short positions in silver (this could take another 1-2 weeks to materialize). I plan to exit those short positions when gold shows substantial strength relative to the USD Index, while the latter is still rallying. This might take place with gold close to $1,450 - $1,500 and the entire decline (from above $1,700 to about $1,475) would be likely to take place within 1-12 weeks and I would expect silver to fall hardest in the final part of the move. This moment (when gold performs very strongly against the rallying USD and miners are strong relative to gold – after gold has already declined substantially) is likely to be the best entry point for long-term investments in my view. This might happen with gold close to $1,475, but it’s too early to say with certainty at this time. In other words, the entire decline could take between 1 and 12 weeks, with silver declines occurring particularly fast in the final 1-2 weeks.
- If gold declines even below $1,500 (say, to ~$1350 or so), then it could take another 10 weeks or so for it to bottom, but this is not what I view as a very likely outcome.
- As a confirmation for the above, I will use the (upcoming or perhaps we have already seen it?) top in the general stock market as the starting point for the three-month countdown. The reason is that after the 1929 top, gold miners declined for about three months after the general stock market started to slide. We also saw some confirmations of this theory based on the analogy to 2008. All in all, the precious metals sector would be likely to bottom about three months after the general stock market tops . If the mid-February 2020 top was the final medium-term top (based on NASDAQ’s top, then it seems that we might expect the precious metals sector to bottom in mid-May or close to May’s end. If, however, the mid-March 2020 top was the final medium-term top (based on the S&P 500), then we might expect the precious metals sector to bottom in mid-June or close to June’s end.
- The above is based on the information available today and it might change in the following days/weeks.
Letters to the Editor
Q: The crossings of several trendlines concern me.
- $TNX - the 10 year note with a weakening upward trend,
- The EUR/USD price has crossed up the downward trendline for two days,
- $DXY - the USD Index has crossed down the upward trendline today,
- XAU/USD - Gold has crossed up the downward trendline for four days,
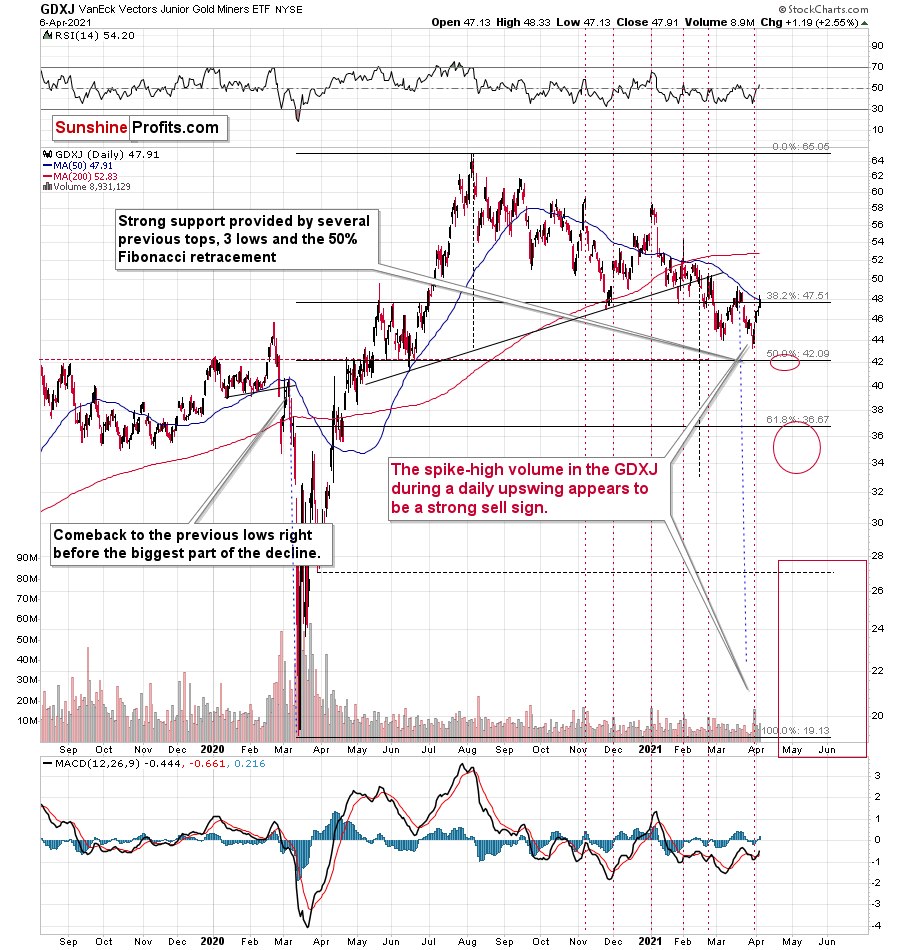
- GDXJ - the junior gold miners crossed the downward trendline today.
In my opinion the main cause working against our objectives is the change in course of interest rates.
The change might be the result of FED actions.
Question: is the above assumption right and can the FED influence the interest rates in strength and durability for as long as it wants ?
A: There’s a limit to what the Fed can do with regard to long-term interest rates. Well, theoretically it can do almost anything, but the market is also free to react and change its expectations in one way or another. I’ve discussed these dynamics in the previous analyses, and you will find the latest update in the March 30 Gold & Silver Trading Alert.
As far as the technical side is concerned, I covered it earlier today in most cases. As far as the euro is concerned (EUR/USD), it seems to me that the analogy to 2018 is present there too, and the current move higher is the analogy to a quick correction that we saw in May, 2018.
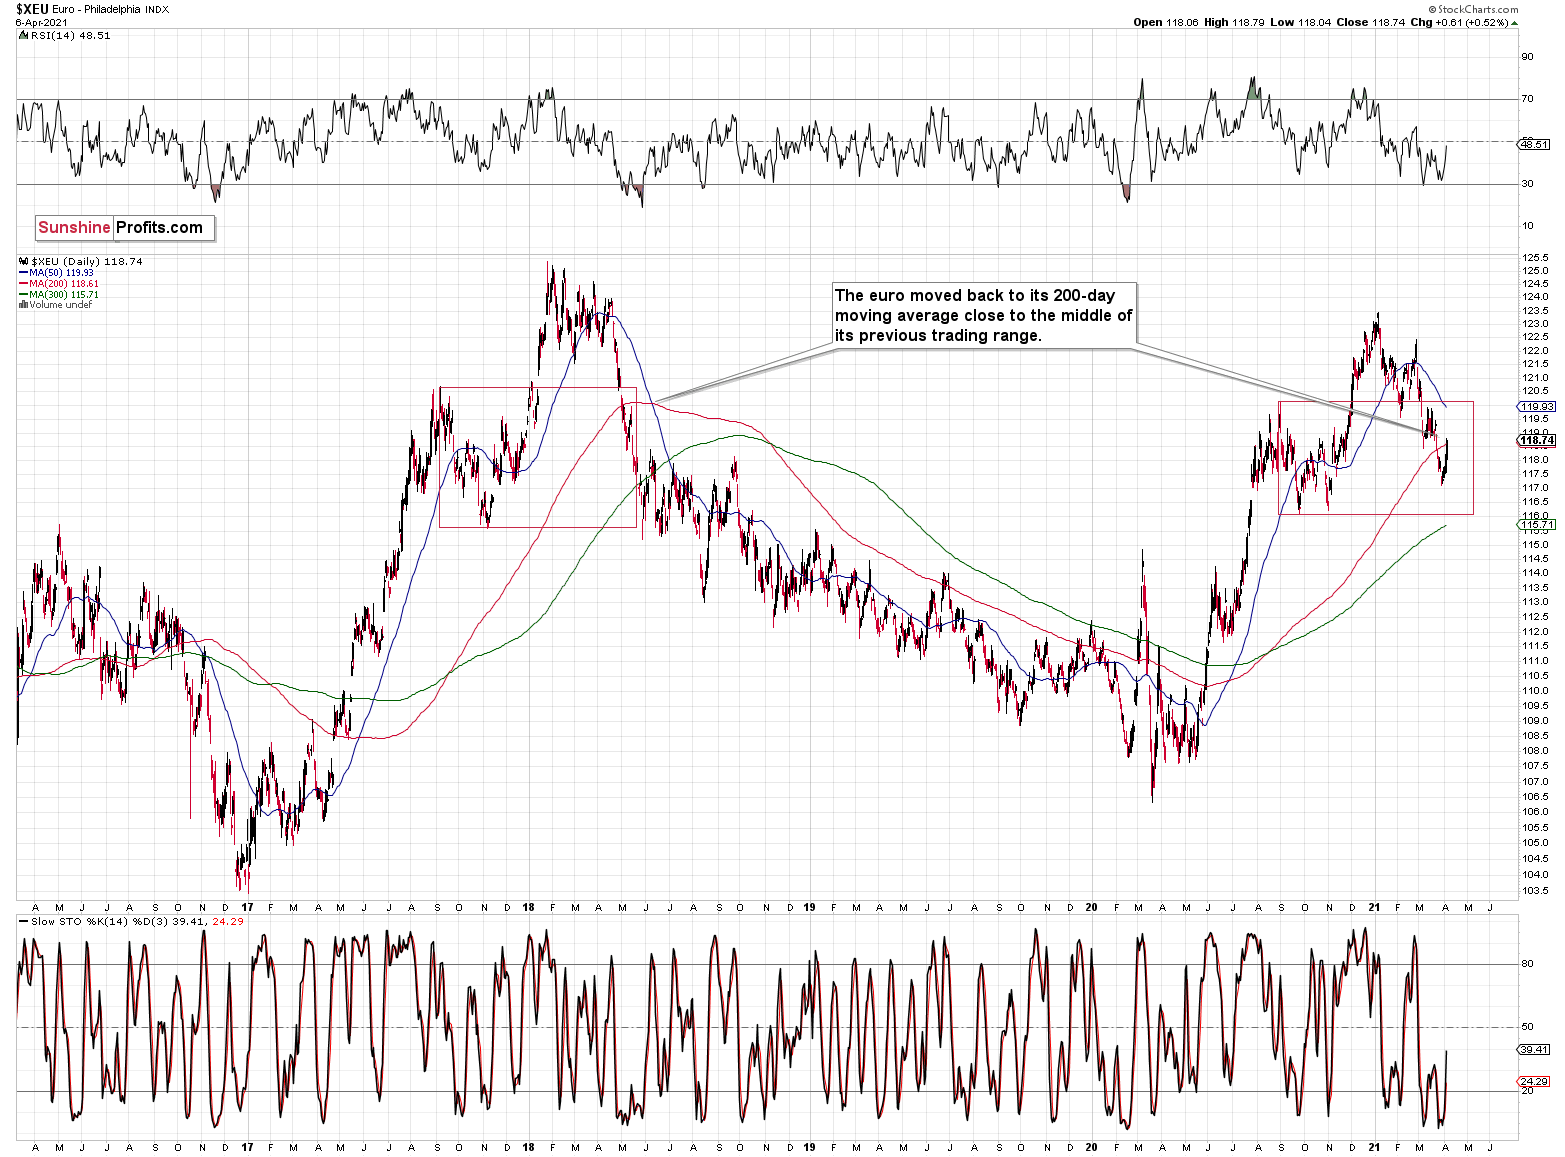
Back then, the EUR/USD was also correcting after breaking below its 200-day moving average, and it also happened close to the middle of the euro’s previous trading range. I marked the latter with red rectangles.
As for the pause in the yields’ rise – it could be the case that the markets are waiting for the news from the Fed.
The FOMC Minutes are going to be released today (Apr. 7) and tomorrow we’ll hear Powell speak. The ECB monetary policy statement is also going to be released tomorrow and we’re also going to see the initial jobless claims statistics. In particular, the market participants might be holding their breath until hearing what the Fed has to say, hoping to get some clarity with regard to the long-term interest rates policy. In my view it’s unlikely that the Fed will announce any kind of Operation Twist now, while the stock market is after a breakout to new highs. They would be likely to do so only after stocks slide. The above fits the triangle-vertex-based reversal in gold very well. We might see volatility in the very near term, but it’s likely that gold and the rest of the PMs will reverse shortly.
Summary
To summarize, the PMs’ medium-term decline is well underway, and based on the recent performance of the USD Index, gold, and mining stocks, it seems that the corrective upswing is already over or about to be over. Based on gold’s triangle-vertex-based reversal it seems that we might expect the top to form on Wednesday (Apr. 7) or Thursday (Apr. 8), but given the approximate nature of this technique, it seems fair to expect the PMs to turn around sometime this week. The next big move lower seems to be already underway or about to start.
In addition, because we’re likely entering the “winter” part of the Kondratiev cycle (just like in 1929 and then the 1930s), the outlook for the precious metals’ sector remains particularly bearish during the very first part of the cycle, when cash is king.
The confirmed breakout in the USD Index is yet another confirmation of the bearish outlook for the precious metals market.
After the sell-off (that takes gold to about $1,450 - $1,500), we expect the precious metals to rally significantly. The final part of the decline might take as little as 1-5 weeks, so it's important to stay alert to any changes.
Most importantly, please stay healthy and safe. We made a lot of money last March and it seems that we’re about to make much more on this March decline, but you have to be healthy to enjoy the results.
As always, we'll keep you - our subscribers - informed.
By the way, we’re currently providing you with a possibility to extend your subscription by a year, two years or even three years with a special 20% discount. This discount can be applied right away, without the need to wait for your next renewal – if you choose to secure your premium access and complete the payment upfront. The boring time in the PMs is definitely over and the time to pay close attention to the market is here. Naturally, it’s your capital, and the choice is up to you, but it seems that it might be a good idea to secure more premium access now, while saving 20% at the same time. Our support team will be happy to assist you in the above-described upgrade at preferential terms – if you’d like to proceed, please contact us.
To summarize:
Trading capital (supplementary part of the portfolio; our opinion): Full speculative short positions (300% of the full position) in mining stocks are justified from the risk to reward point of view with the following binding exit profit-take price levels:
Mining stocks (price levels for the GDXJ ETF): binding profit-take exit price: $24.12; stop-loss: none (the volatility is too big to justify a stop-loss order in case of this particular trade)
Alternatively, if one seeks leverage, we’re providing the binding profit-take levels for the JDST (2x leveraged) and GDXD (3x leveraged – which is not suggested for most traders/investors due to the significant leverage). The binding profit-take level for the JDST: $39.87; stop-loss for the JDST: none (the volatility is too big to justify a SL order in case of this particular trade); binding profit-take level for the GDXD: $94.87; stop-loss for the GDXD: none (the volatility is too big to justify a SL order in case of this particular trade).
For-your-information targets (our opinion; we continue to think that mining stocks are the preferred way of taking advantage of the upcoming price move, but if for whatever reason one wants / has to use silver or gold for this trade, we are providing the details anyway.):
Silver futures upside profit-take exit price: unclear at this time - initially, it might be a good idea to exit, when gold moves to $1,512.
Gold futures upside profit-take exit price: $1,512.
Long-term capital (core part of the portfolio; our opinion): No positions (in other words: cash
Insurance capital (core part of the portfolio; our opinion): Full position
Whether you already subscribed or not, we encourage you to find out how to make the most of our alerts and read our replies to the most common alert-and-gold-trading-related-questions.
Please note that we describe the situation for the day that the alert is posted in the trading section. In other words, if we are writing about a speculative position, it means that it is up-to-date on the day it was posted. We are also featuring the initial target prices to decide whether keeping a position on a given day is in tune with your approach (some moves are too small for medium-term traders, and some might appear too big for day-traders).
Additionally, you might want to read why our stop-loss orders are usually relatively far from the current price.
Please note that a full position doesn't mean using all of the capital for a given trade. You will find details on our thoughts on gold portfolio structuring in the Key Insights section on our website.
As a reminder - "initial target price" means exactly that - an "initial" one. It's not a price level at which we suggest closing positions. If this becomes the case (like it did in the previous trade), we will refer to these levels as levels of exit orders (exactly as we've done previously). Stop-loss levels, however, are naturally not "initial", but something that, in our opinion, might be entered as an order.
Since it is impossible to synchronize target prices and stop-loss levels for all the ETFs and ETNs with the main markets that we provide these levels for (gold, silver and mining stocks - the GDX ETF), the stop-loss levels and target prices for other ETNs and ETF (among other: UGL, GLL, AGQ, ZSL, NUGT, DUST, JNUG, JDST) are provided as supplementary, and not as "final". This means that if a stop-loss or a target level is reached for any of the "additional instruments" (GLL for instance), but not for the "main instrument" (gold in this case), we will view positions in both gold and GLL as still open and the stop-loss for GLL would have to be moved lower. On the other hand, if gold moves to a stop-loss level but GLL doesn't, then we will view both positions (in gold and GLL) as closed. In other words, since it's not possible to be 100% certain that each related instrument moves to a given level when the underlying instrument does, we can't provide levels that would be binding. The levels that we do provide are our best estimate of the levels that will correspond to the levels in the underlying assets, but it will be the underlying assets that one will need to focus on regarding the signs pointing to closing a given position or keeping it open. We might adjust the levels in the "additional instruments" without adjusting the levels in the "main instruments", which will simply mean that we have improved our estimation of these levels, not that we changed our outlook on the markets. We are already working on a tool that would update these levels daily for the most popular ETFs, ETNs and individual mining stocks.
Our preferred ways to invest in and to trade gold along with the reasoning can be found in the how to buy gold section. Furthermore, our preferred ETFs and ETNs can be found in our Gold & Silver ETF Ranking.
As a reminder, Gold & Silver Trading Alerts are posted before or on each trading day (we usually post them before the opening bell, but we don't promise doing that each day). If there's anything urgent, we will send you an additional small alert before posting the main one.
Thank you.
Przemyslaw Radomski, CFA
Founder, Editor-in-chief

