

Briefly: in our opinion, full (300% of the regular position size) speculative short positions in mining stocks are justified from the risk/reward point of view at the moment of publishing this Alert.
Not much changed on the precious metals market yesterday (Apr. 21), at least after I sent out the intraday Alert. Consequently, I will base today’s analysis on the latter. Just as I did yesterday, I will start the analysis with the long-term picture of the HUI Index – the flagship proxy for gold stocks.
In particular, I previously commented on the above chart in the following way:
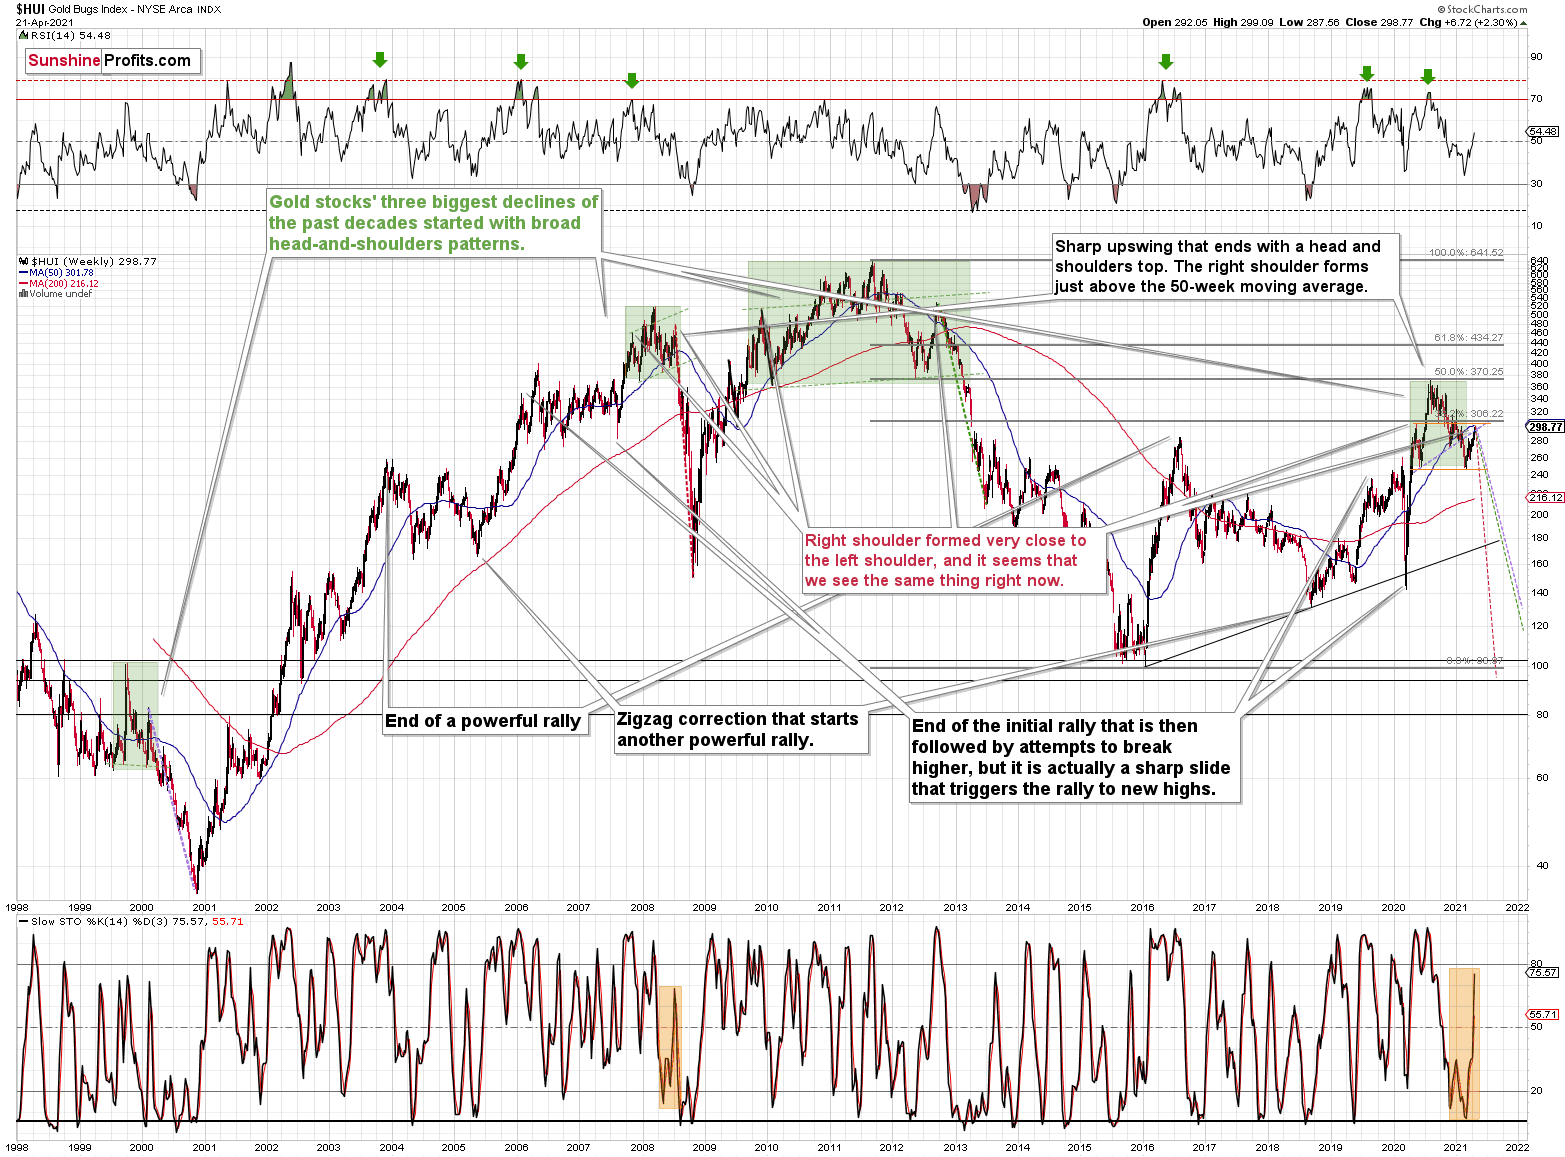
Please note that the 2007 – 2008 and the 2009 – 2012 head and shoulders pattern didn’t have the right shoulders all the way up to the line that was parallel to the line connecting the bottoms. I marked those lines with green in the above-mentioned formations. In the current case, I marked those lines with orange.
Now, even though the above wasn’t the case, in both cases, the final top – the right shoulder formed close to the price where the left shoulder topped. The left shoulder that formed in early 2020 topped at 303.02.
Consequently, it wouldn’t be surprising to see a move to about 300 in the HUI Index, despite all the bearish indications that I outlined so far today.
Yes, I realize that this is not a pleasant piece of news, as we would all prefer to have the market move in our preferred direction right away, but this time it seems that the wait will be – in my opinion – extremely worth it.
The HUI Index at 299 perfectly fits the above, and that’s yesterday’s intraday high (299.09). This means that the recent rally is not a game-changer, but rather a part of a long-term pattern that’s not visible when one focuses on the short-term only.
The thing is that the vast majority of individual investors and – sadly – quite many analysts focus on the trees while forgetting about the forest. During the walk, this might result in getting lost, and the implications are no different in the investment landscape.
From the day-to-day perspective, a weekly – let alone monthly – rally seems like a huge deal. However, once one zooms out and looks at the situation from a broad perspective, it’s clear that:
What has been will be again, what has been done will be done again; there is nothing new under the sun. (-Ecclesiastes 1:9)
The rally is very likely the right shoulder of a broad head and shoulders formation. “Very likely” and not “certainly”, because the HUI Index needs to break to new yearly lows in order to complete the pattern – for now, it’s just potential. However, given the situation in the USD Index (i.a. the positions of futures traders as seen in the CoT report, and the technical situation in it), it seems very likely that this formation will indeed be completed. Especially when (not if) the general stock market tumbles.
As far as the GDX ETF is concerned, I wrote the following earlier today:
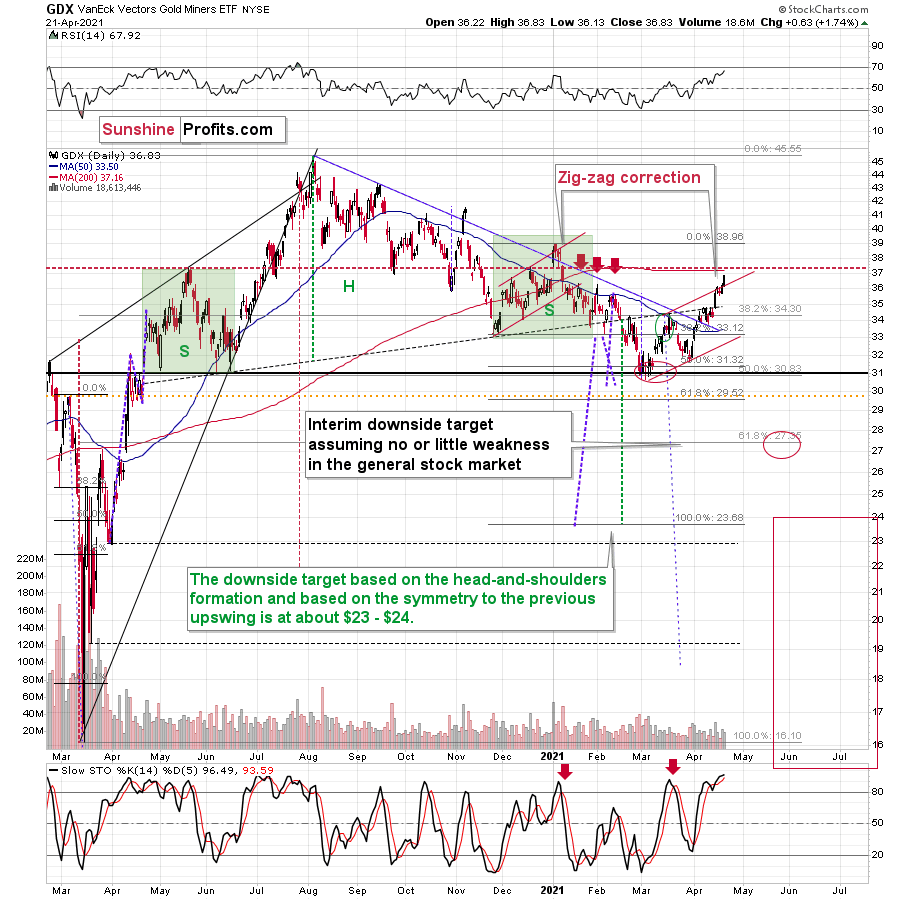
Still, I would like to point out that it’s still possible that the head-and-shoulders formation that I marked previously was not THE formation that is going to take mining stocks to much lower prices. It could be the case that the left shoulder is as I described previously, but that the head of the pattern is bigger and the right shoulder is being formed right now. If this is the case, then we might still see the GDX ETF at about $37 level or so before it really slides. This would be in tune with how the situation developed in 2008 and 2012 – you’ll find details of this comparison in the following part of the analysis, where I discuss the HUI Index’s very long-term chart. For now, let’s keep in mind that even a rally slightly above $37 in the GDX ETF would not invalidate the bearish outlook for mining stocks(even though it would feel very unpleasant in the short term).
Yesterday’s (Apr. 21) high in the GDX ETF was $36.83, which – in light of the above – means that nothing changed.
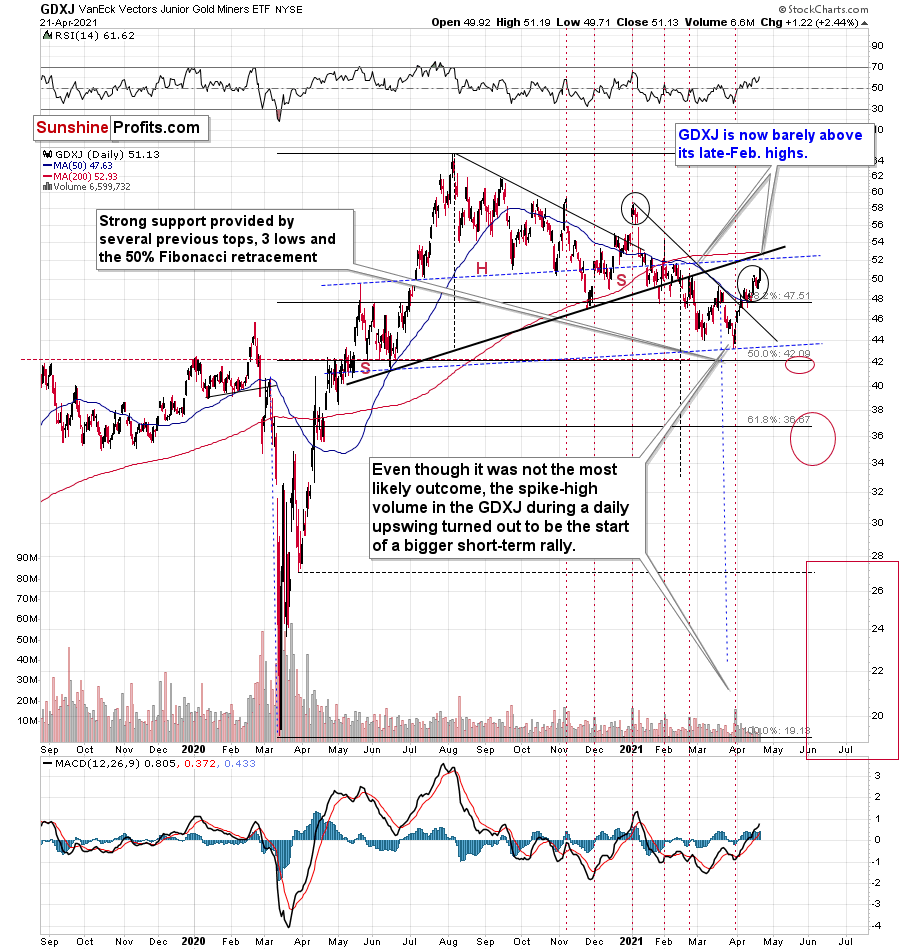
The GDXJ moved higher as well (it practically had to, given what the rest of the PM market did), but please note how weak it remains relative to other proxies for the mining stocks. Unlike HUI or the GDX, the GDXJ didn’t move visibly above its late-Feb. highs. In fact, it just moved barely above them.
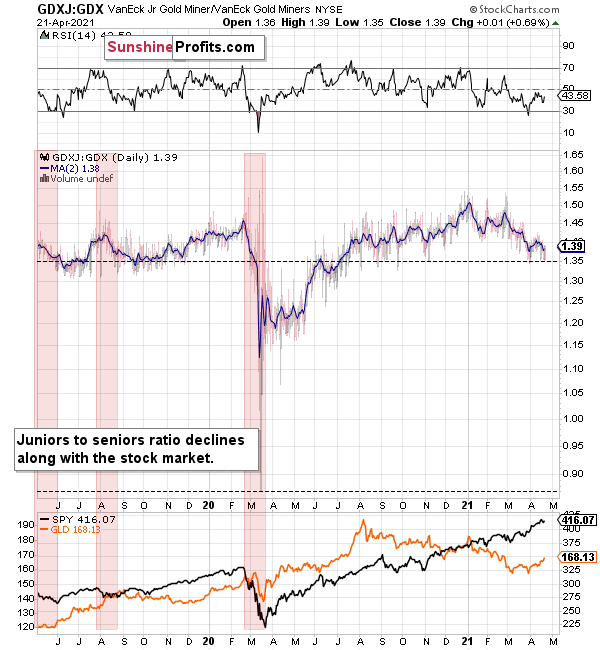
The ratio between the two ETFs has been declining since the beginning of the year, which is remarkable because the general stock market hasn’t plunged yet. This tells us that when stocks finally slide, the ratio is likely to decline in a truly profound manner – perhaps similarly to what we saw last year.
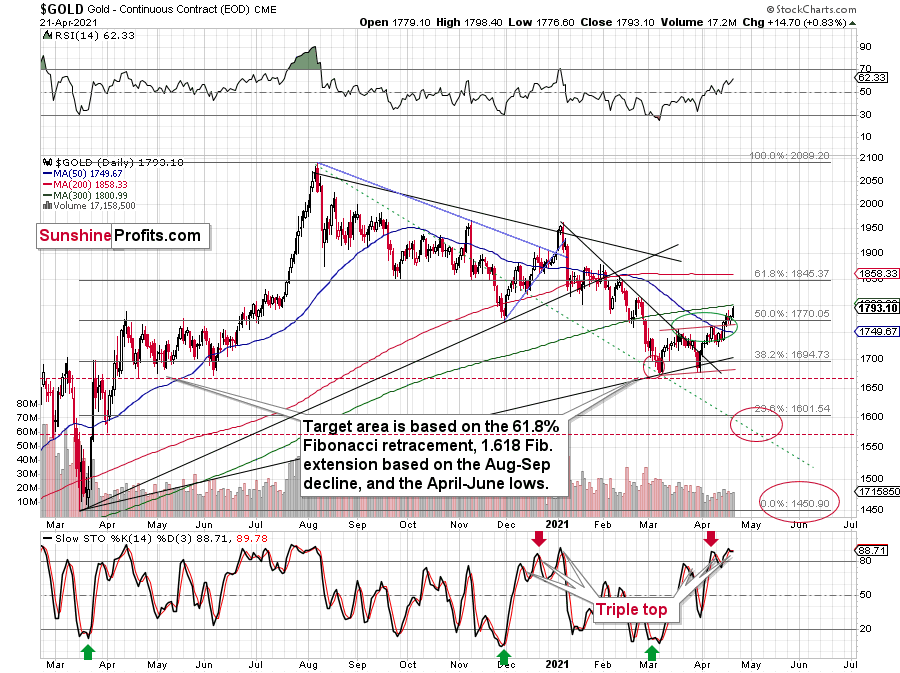
And, as far as gold is concerned, I wrote the following:
(while gold rallies a bit more – say to $1,800 or so), but don’t let that trick you into thinking that the next big move is going to the upside. In my view, that’s actually likely to be an important top that’s then going to be followed by an even more important decline in the precious metals and mining stocks. Then, after several weeks or months of declines, PMs can bottom and finally soar without huge declines on the horizon.
Once again, yesterday’s (Apr. 21) intraday move to ~$1,798 is well within the realm of possibilities that don’t change the outlook – as described above. In other words, the outlook for the next several weeks or even months remains bearish.
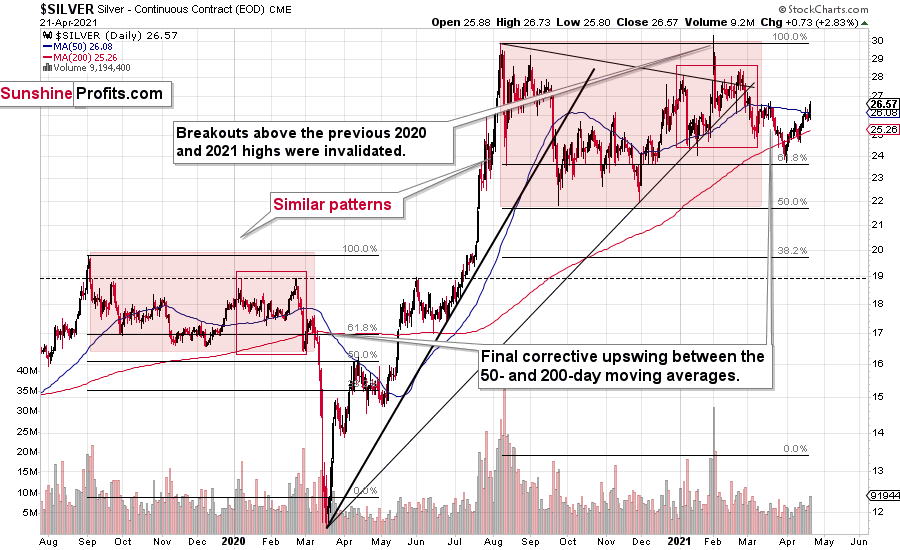
Silver moved above its 50-day moving average, which might seem like a deviation from the 2020 performance and the self-similar pattern, but let’s keep in mind that the self-similarity was also present in the case of the 2008 decline.
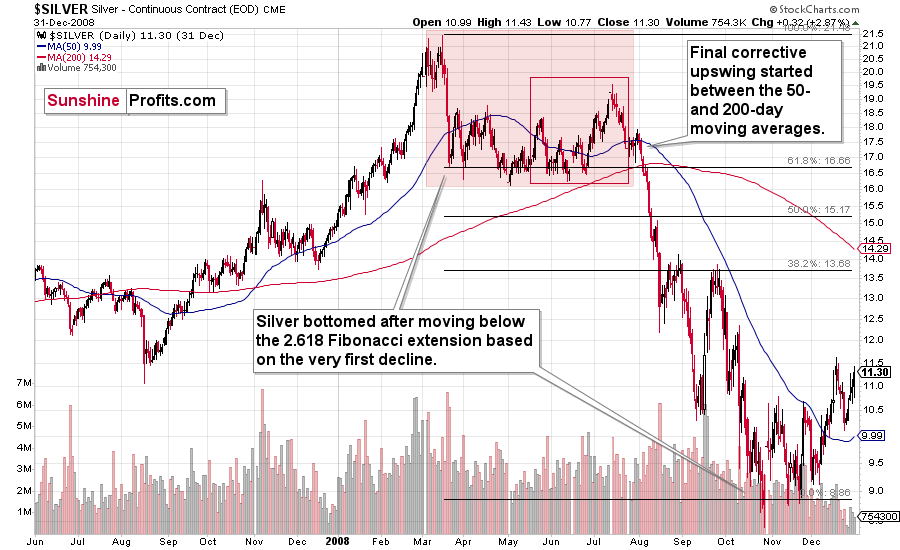
And at that time, silver did move a bit above its 50-day moving average before the biggest part of the slide.
Consequently, the bearish implications of the recent price moves remain intact.
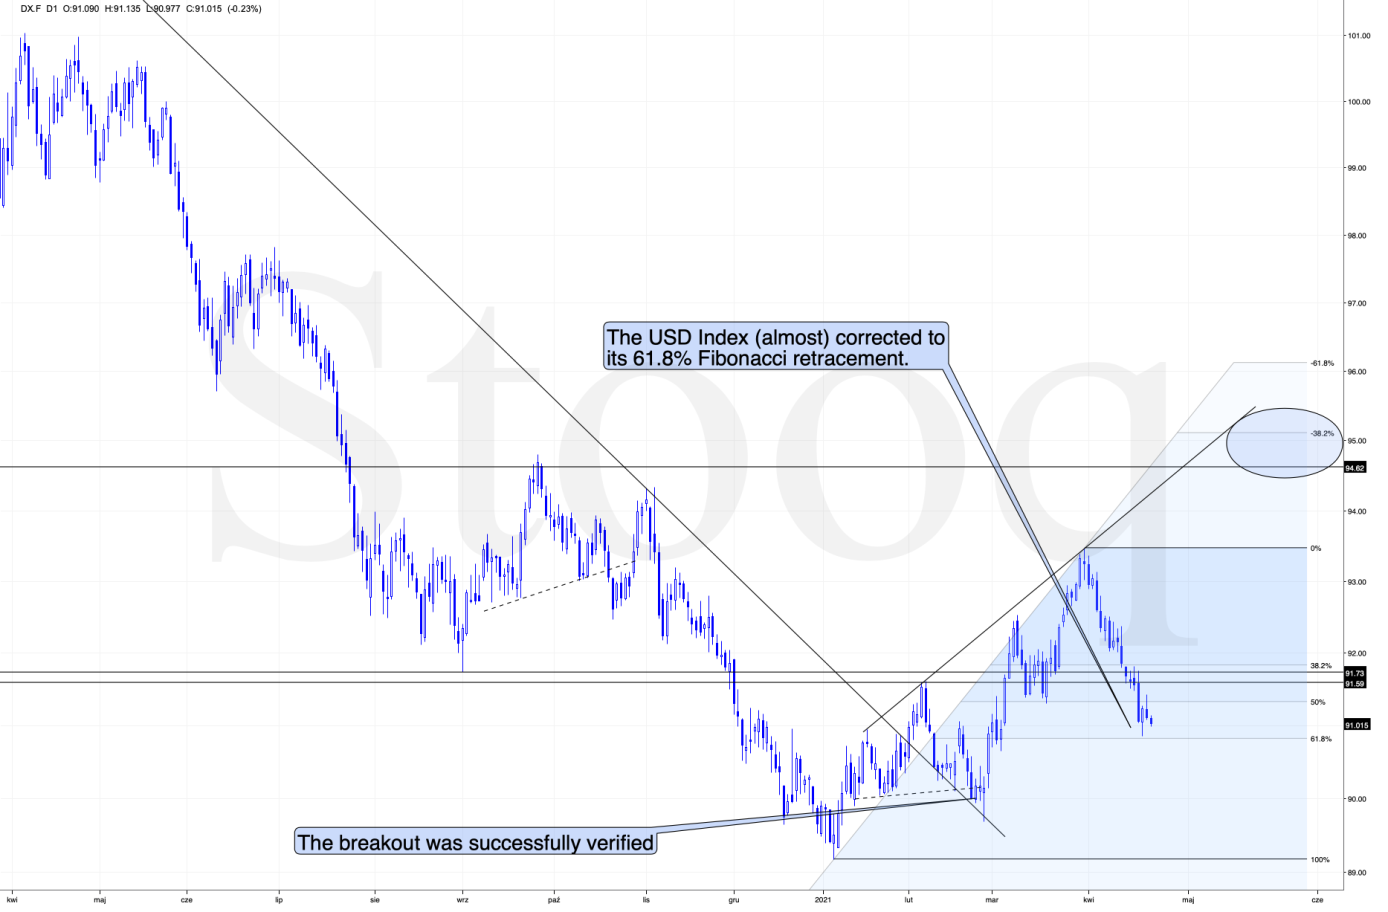
The USD Index declined once again, and traders likely thought that the short-term correction was over, so they got back in the sell-USDX mood. However, the 61.8% Fibonacci retracement was not broken, and, consequently, it’s likely to stop the current attempt to move lower once again.
Please note that during the previous important short-term bottom – in late Feb. 2021 – the USD Index’s bottom took a few days and ended with a very brief – intraday – slide. This was the thing that triggered the next big upswing in the USDX, and the sizable downswing in the PMs. This time the following rally is likely to be even bigger.
I wouldn’t be surprised to see this week end without any major reversal, but we could see one on Monday. Some traders won’t be able to adjust their stop-loss levels at that time, so if anyone “big” wants to squeeze the profits out of individual traders shorting the USDX before the latter rallies, it would be a perfect time. The idea could be to trigger a small sell-off early on Monday, which would then trigger stop-loss selling, and it would allow the “big” market participant to re-enter the long positions at lower prices. I’m not saying that it’s the most likely scenario, though, only that it wouldn’t surprise me to see something like that.
Having said that, let’s take a look at the markets from a more fundamental angle:
The Tip of the Iceberg
With stocks’ strength helping to uplift the PMs on Apr. 21, the pairs’ pristine view masks the dark underbelly lurking beneath the surface. With the S&P 500 outlawing substantial declines and the lack of fear placing a glass ceiling atop the USD Index, the latter’s inability to muster any upward momentum is viewed as a sign of weakness by the PMs.
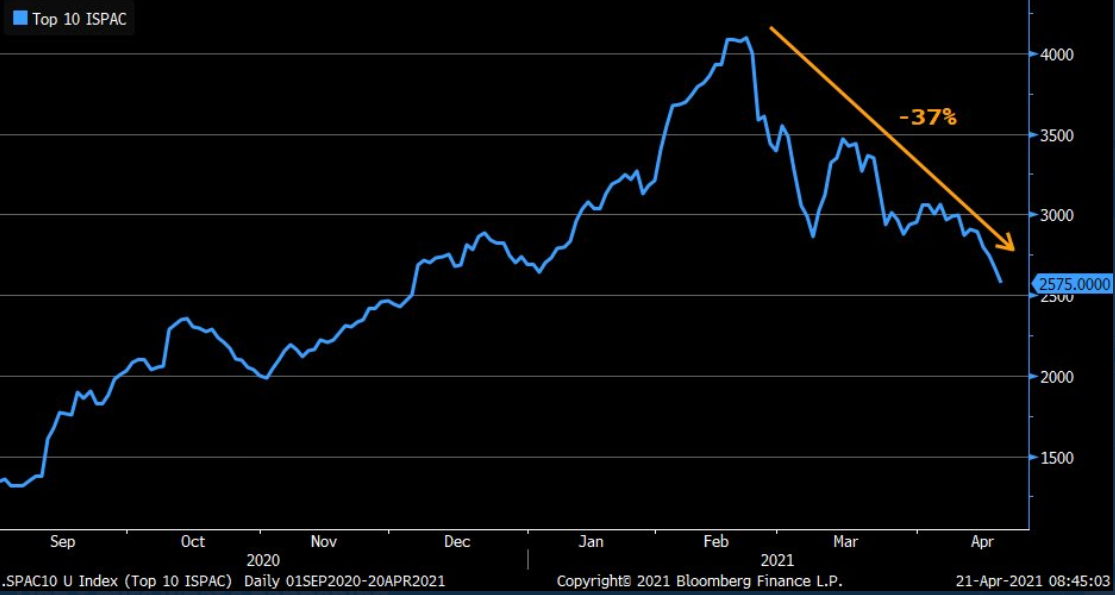
However, with the most speculative stocks already being sent to slaughter, it’s only a matter of time before the indices feel the wrath. Case in point: with the air coming out of the SPAC balloon, an equal-weighted basket of the 10 largest holdings in the ISPAC Index is down by 37% from its February peak.
Please see below:
 Source: Bloomberg/Liz Ann Sonders
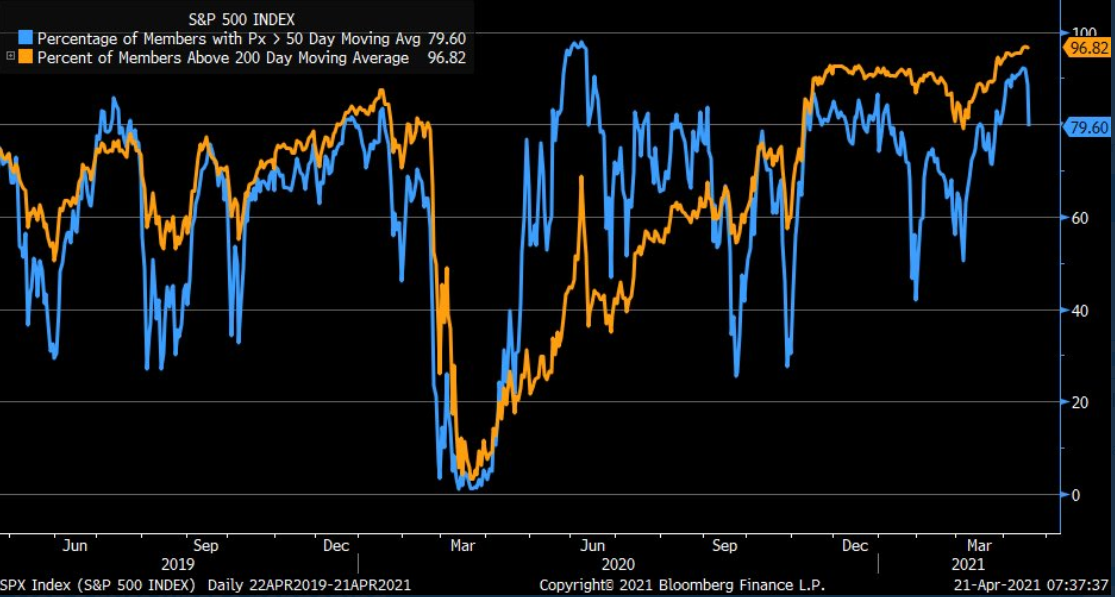
Moreover, despite the S&P 500’s upward inertia, the percentage of constituents trading above their 50-day moving average (MA) has begun to roll over.
Please see below:
 Source: Bloomberg/Liz Ann Sonders
To explain, the orange line tracks the percentage of S&P 500 constituents’ trading above their 200-day MA, while the blue line tracks the percentage of S&P 500 constituents’ trading above their 50-day MA. If you analyze the right side of the chart, you can see that the blue line has moved sharply lower. And with a deterioration in the short-term breadth likely to elicit a follow-through by the 200-day MA, equities’ infantry is losing more and more soldiers from day to day.
Furthermore, while the S&P 500 continues to make higher highs, the inverted Cboe Equity Put/Call Ratio (10-day MA) continues to make lower highs.
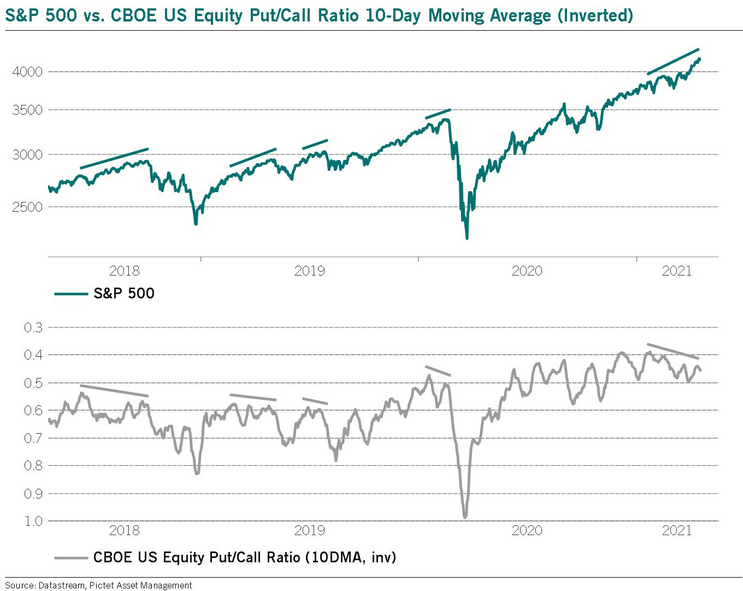
To explain, call options profit when the S&P 500 (and/or individual companies within the index) rises and put options profit when the S&P 500 (and/or individual companies within the index) falls. Moreover, with the inverted scale at the bottom of the chart signaling that investors are buying more put options than call options, a near-term decline could be forthcoming. Case in point: if you analyze the small trendlines above, you can see that when the inverted 10-day MA P/C ratio elicits negative divergence – meaning that it falls while the S&P 500 rises – the latter often suffers a meaningful pullback.
Adding to the bearish cocktail, the above developments are emerging at a time when equity positioning is in the 98th percentile.
Please see below:
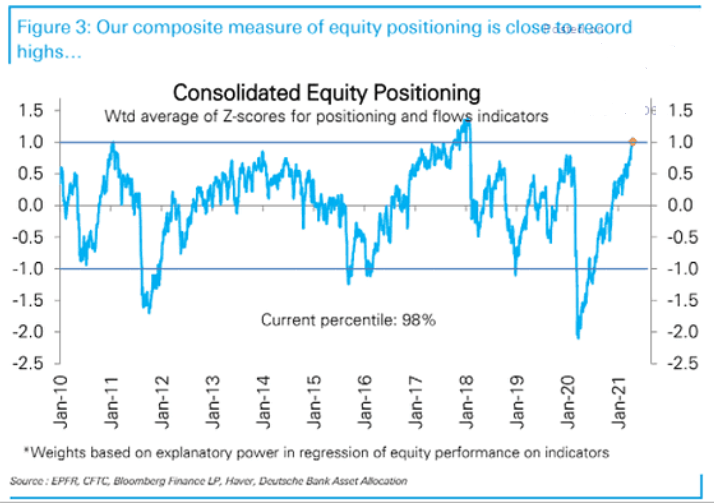
To explain, the blue line above tracks Deutsche Bank’s weekly average Z-Score of investors’ tendency to overweight or underweight equities. If you analyze the right side of the chart, not only are we approaching record highs, but great aberrations often precede great reversions.
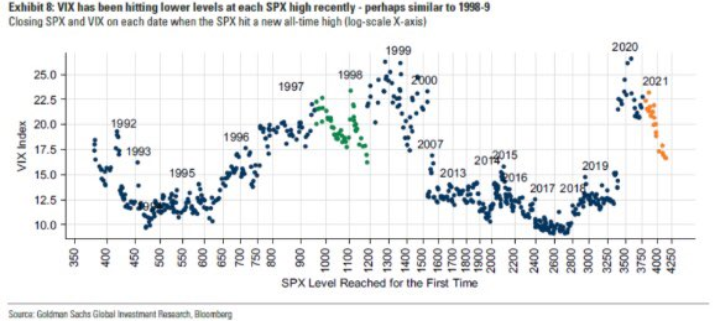
Also worth noting: the Cboe Volatility Index (VIX) – which gauges the S&P 500’s expected volatility over the next 30 days – is behaving exactly as it did in 1998. If you analyze the orange circles from 2021 below (on the right side of the chart), you can see that the propensity of the VIX to make new lows – when the S&P 500 makes new highs – is eerily similar to the green circles from 1998 (located near the middle of the chart). Thus, with investor complacency colliding with extreme over-positioning, a severe bout of volatility is likely on the horizon.
More importantly, though, while U.S. equities have been deceptively strong in recent weeks, hedge funds and institutional investors have been selling the rallies.
Please see below:
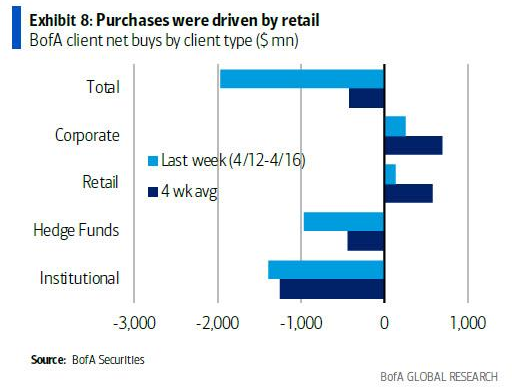
To explain, the dark and light blue bars above represent net-purchases by clients of Bank of America. Last week (Apr. 12-16), hedge funds and institutional investors were the major net-sellers of U.S. equities, while corporations (likely share buybacks) and retail investors were the major net-buyers. Similarly, over the last four weeks, hedge funds and institutional investors were offloading U.S. equities, while corporations (again, likely share buybacks) and retail investors eagerly soaked up the liquidity. The key takeaway? The least sophisticated investors have been the main drivers of U.S. equities’ recent strength.
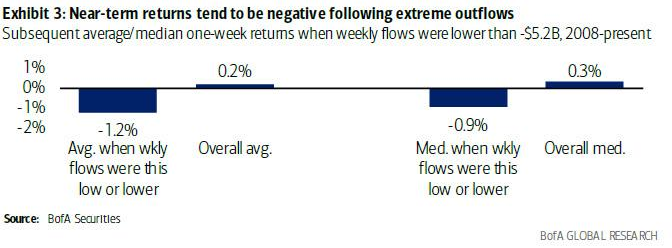
If that wasn’t enough, the magnitude of last week’s $5.20 billion outflow – the fifth-largest on record – is often a precursor to short-term declines. Case in point: the weekly return following outflows of $5.20 billion or more has been negative 75% of the time since 2008, with an average decline of 1.20% over the sample period.
Please see below:
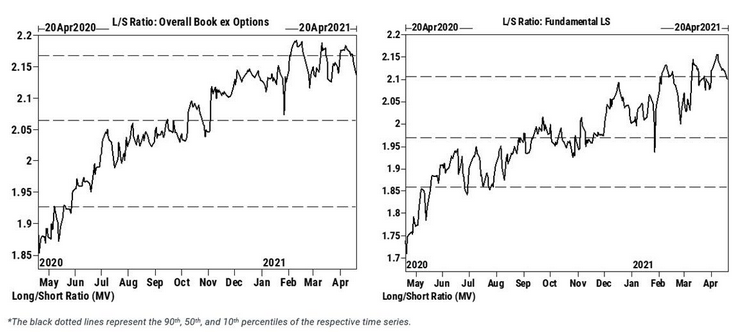
 Additionally, as the wheels were in motion, hedge funds were also de-risking their portfolios. With both systematic and fundamental long-short equity funds reducing their exposure, L/S ratios are now trending lower.
 Source: Goldman Sachs/Zero Hedge
To explain, when the lines above are rising, it means that hedge funds are increasing their long positions and reducing their short exposure. Conversely, when the lines above are falling, it means that hedge funds are reducing their long positions and increasing their short exposure. Thus, if you analyze the right side of both charts, you can see that hedge funds’ L/S ratios have come down from extremely high levels. How high? Well, with hedge funds’ net-long positioning either at (fundamental) or breaching (overall) the 90th percentile, there is still plenty of room for both to move lower.
From a medium- to long-term perspective, the outlook is even more bearish. Showing its largest trend deviation since January 2007, the S&P 500 is well within the danger zone.
Please see below:
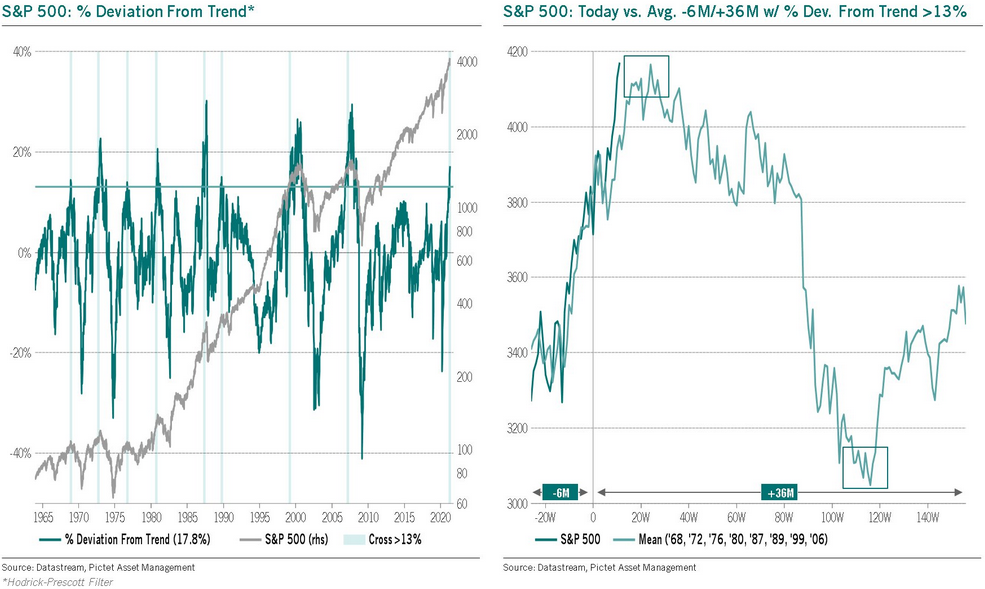
To explain, the chart on the left tracks the percentage deviation from the S&P 500’s long-term trend (the vertical green line). Since 1965, there have only been eight other occasions where the S&P 500’s percentage deviation has exceeded 13%. And with the current reading at 18%, similar excesses have resulted in severe drawdowns of the S&P 500. As further evidence, if you analyze the chart on the right, today’s price action is following the average performance of the S&P 500 during the eight other periods in which the percentage deviation exceeded 13%. And with the green line nearing the historical precipice, past precedent signals that a move back to 3,000 is likely to occur in less than 120 weeks (the two boxes above).
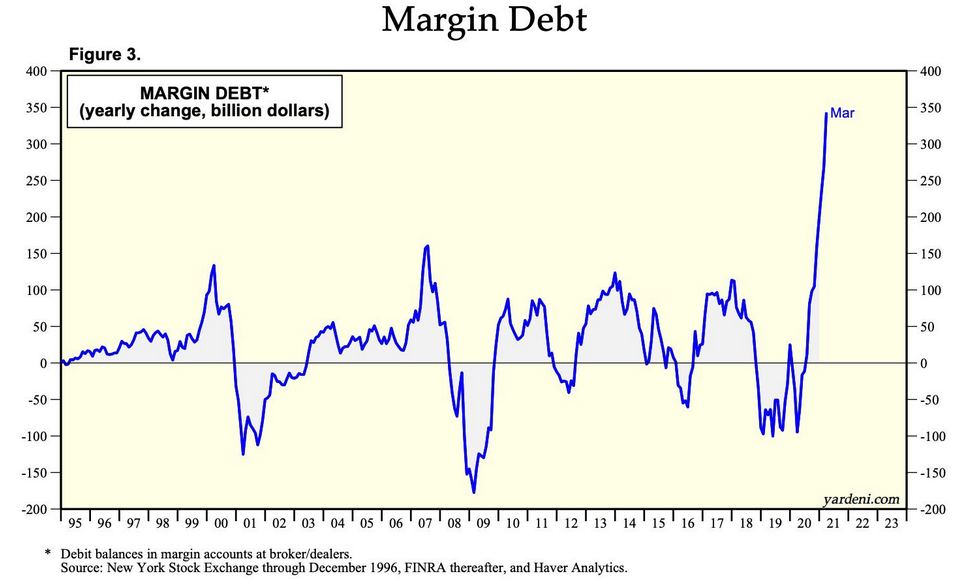
In the meantime, though, with retail investors still willing buyers of institutional investors’ leftovers, margin debt has exploded. Dwarfing all other historical periods, the year-over-year (YoY) change from March 2020 to March 2021 is unlike anything that we’ve ever witnessed before.
Please see below:
And showing a similar pattern – but for the opposite reason – corporate insiders have been running for the hills. For context, corporate insiders are executives at S&P 500 companies who periodically buy and sell their own stock. Because insiders possess inside information about their companies’ fundamentals, their buying and selling activity is worth monitoring.
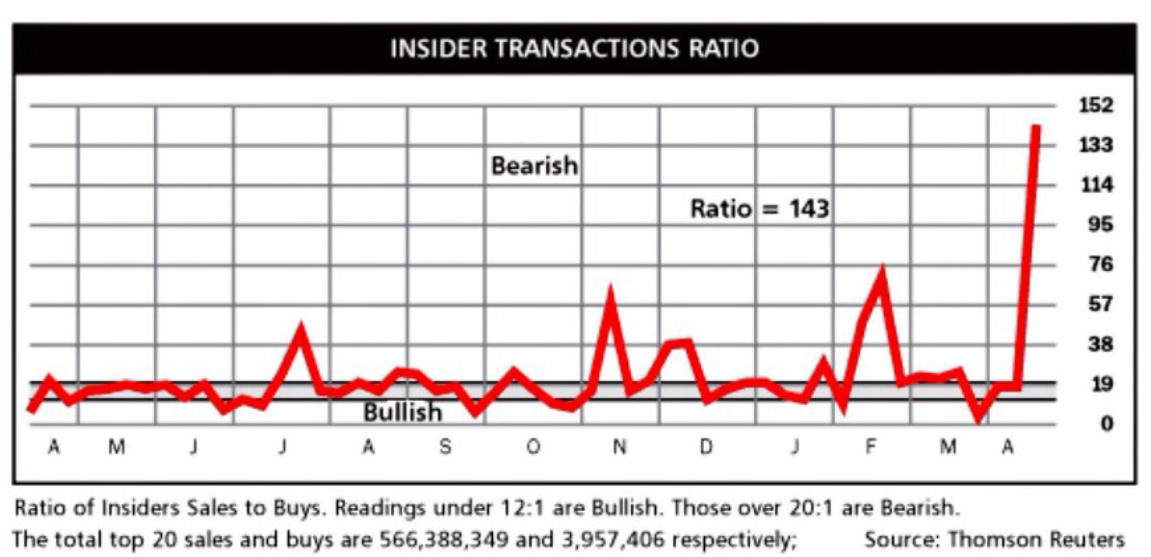
But why does all of this matter?
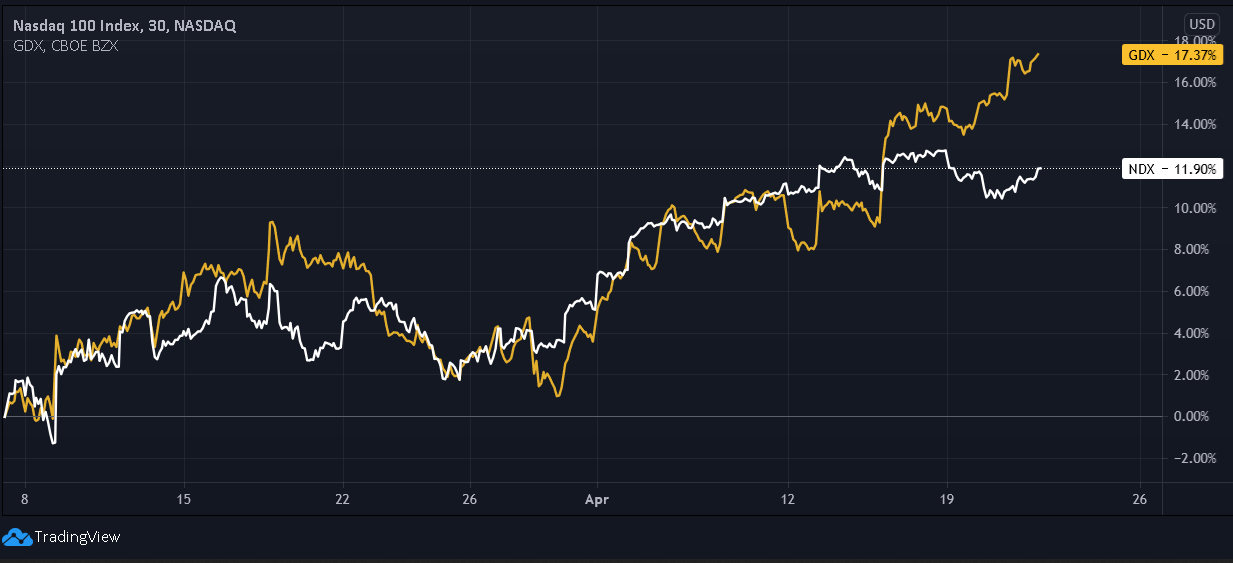
Because the strong performance of U.S. equities has helped create a tranquil environment for the PMs. Case in point: it’s been more than a month since the NASDAQ 100 declined by more than 2.00%. And since real equity volatility often cascades across the precious metals’ market, NASDAQ 100 drawdowns of more than 2.00% tend to unnerve the PMs. Moreover, if you exclude silver’s short squeeze on Jan. 29 and the NASDAQ 100’s relatively ‘quiet’ 2.63% drawdown on Feb. 22, bouts of equity volatility have a significant impact (especially on the miners).
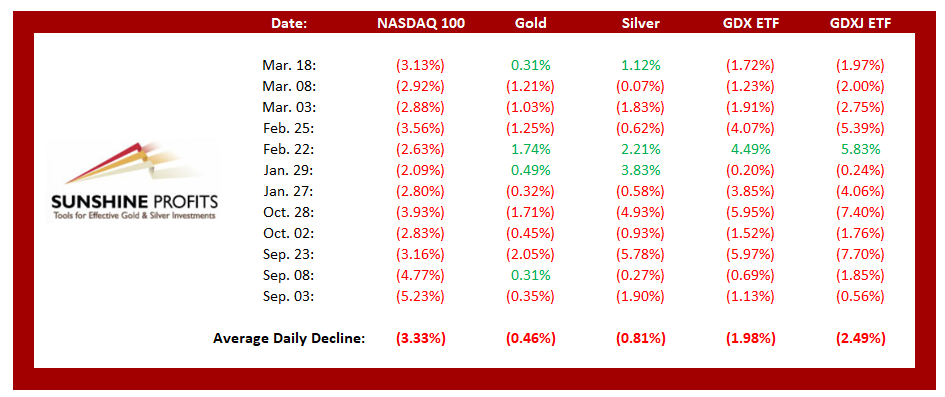
To that point, notice how the GDX ETF often follows in Big Techs’ footsteps. Thus, with the above developments creating the preconditions necessary for a material drawdown, the GDX ETF’s forthcoming decline will likely be even swifter than its ascent.
Likewise, with investors ignoring any and all risk, the USD Index’s pain has been the PMs’ gain. However, with a reversal of fortunes likely to occur in the coming weeks, the USD Index is likely to spoil the PMs’ party. On one side, the greenback is extremely oversold, while on the other side, gold is materially overbought. And with historical realignments often unkind to the PMs, the forthcoming revaluation will likely be no different.
In conclusion, the PMs’ train to redemption is likely to end with a derailment. With a goldilocks environment of dormant U.S. Treasury yields and a sluggish USD Index unlikely to last for much longer, you can already hear the PMs’ death knell ringing off in the distance. Moreover, with U.S. equities’ swan song likely to add another verse to the bearish musical, the PMs’ forthcoming slide could be extremely crippling. The bottom line? Caution remains the most prudent course of action, as buying the short-term hype will likely result in medium-term regret.
Overview of the Upcoming Part of the Decline
- It seems likely to me that the corrective upswing was already completed or that it will be completed this week. Consequently, it seems that the next big move lower is already underway or about to start.
- After miners slide once again in a meaningful and volatile way, but silver doesn’t (and it just declines moderately), I plan to switch from short positions in miners to short positions in silver (this could take another 1-2 weeks to materialize). I plan to exit those short positions when gold shows substantial strength relative to the USD Index, while the latter is still rallying. This might take place with gold close to $1,450 - $1,500 and the entire decline (from above $1,700 to about $1,475) would be likely to take place within 1-12 weeks, and I would expect silver to fall hardest in the final part of the move. This moment (when gold performs very strongly against the rallying USD and miners are strong relative to gold – after gold has already declined substantially) is likely to be the best entry point for long-term investments, in my view. This might happen with gold close to $1,475, but it’s too early to say with certainty at this time. In other words, the entire decline could take between 1 and 12 weeks, with silver declines occurring particularly fast in the final 1-2 weeks.
- If gold declines even below $1,500 (say, to ~$1350 or so), then it could take another 10 weeks or so for it to bottom, but this is not what I view as a very likely outcome.
- As a confirmation for the above, I will use the (upcoming or perhaps we have already seen it?) top in the general stock market as the starting point for the three-month countdown. The reason is that after the 1929 top, gold miners declined for about three months after the general stock market started to slide. We also saw some confirmations of this theory based on the analogy to 2008. All in all, the precious metals sector would be likely to bottom about three months after the general stock market tops. If the mid-February 2020 top was the final medium-term top (based on NASDAQ’s top, then it seems that we might expect the precious metals sector to bottom in mid-May or close to May’s end. If, however, the upcoming (unless we just saw one) top in the S&P 500 is the key one, then it seems that we’re at least ~3 months from the final bottom.
- The above is based on the information available today, and it might change in the following days/weeks.
Please note that the above timing details are relatively broad and “for general overview only” – so that you know more or less what I think and how volatile I think the moves are likely to be – on an approximate basis. These time targets are not binding or clear enough for me to think that they should be used for purchasing options, warrants or similar instruments.
Letters to the Editor
Q: I think you have noted the collapse of bitcoin today. There is roughly 6.7 billion USD liquidated from the crypto market based on my calculation. Where you think this capital will be heading in the following weeks?
Also, please relay my message to Mr. Radomski, as I would kindly like to hear his thoughts on gold’s movement in the following weeks. As for myself, I am thinking that this capital is heading towards gold!
A: Thank you for the question.
I’d say that people will be first tempted to move this capital into the assets that have been rallying recently with the lowest volatility. So, I expect it to go to the stock market. However, once the stock market fails, I expect the capital to simply stay in cash for some time and then, finally, to start moving into the precious metals sector. Why not immediately? Because in the very near term, stocks and gold are likely to fall together, just like they did in 2008 and 2020.
Q: Do you see GDX reaching $31 or lower before June 2021? I've read your analyses from top to bottom a few times along with the charts. GDX bullish moves are very discouraging to say the least. Also, since the SPX keeps on moving higher, it also appears that the three month rule for the PMs moved away by a few months. What's the new target?
A: In short, yes, I think that GDX will reach or move below $31 before June 2021. However, that’s just my opinion, and I could be wrong. I’m not holding any options and neither do I have any instruments that would expire before this date - I’m positioned in a way that allows me to wait for longer, if necessary (I’m using JDST, as I seek more leverage for this trade, which is not appropriate for many – in fact, most – people). The 3-month rule is currently unclear. It’s unclear if we should use Nasdaq as it was the leading market, or if we should start counting those three months after the final S&P 500 top. I’ll keep monitoring the situation and report to you through my Alerts when I see more details.
Q: Just a quick message of support. I love your research. Its second to none. Your ethics are honorable and appreciated in these selfish times we live in. It is frustrating at the moment, but the way you approach investing and the way you present your essays are great. Your analogy of the USD is a great read. The cavalry's coming, I love that. Thanks. Let’s hope the USDX rallies soon, gold drops like a stone and the cavalry rides through the barriers cheering when the opposing forces duck for cover.
Keep up the good work. It's great watching the story unfold.
A: Thank you. Your words are very much appreciated, especially considering that it’s so difficult to appreciate the analysis when the markets are (hopefully, and – in my opinion – likely temporary) moving in the other direction in the very short term. Thank you once again.
Summary
To summarize, the PMs’ medium-term decline is well underway, and based on the recent performance of the USD Index, gold and mining stocks, it seems that the corrective upswing is close to being over. Based on gold’s triangle-vertex-based reversal, it seems that we saw the initial top on Thursday (Apr. 8), and it seems that – based on gold stocks’ analogy to the previous broad head-and-shoulders patterns -the final top is about to be in, or it’s already in. Please note that while the medium-term trend remains down, it’s not out of the question that the market will form the final reversal early next week - perhaps on Monday. The key thing here is that the really big move seems very close to starting, and when it starts, the recent upswing will likely seem to have been nothing more than a blip on the radar screen.
In addition, because we’re likely entering the “winter” part of the Kondratiev cycle (just like in 1929 and then the 1930s), the outlook for the precious metals’ sector remains particularly bearish during the very first part of the cycle, when cash is king.
The confirmed breakout in the USD Index is yet another confirmation of the bearish outlook for the precious metals market.
After the sell-off (that takes gold to about $1,450 - $1,500), we expect the precious metals to rally significantly. The final part of the decline might take as little as 1-5 weeks, so it's important to stay alert to any changes.
Most importantly, please stay healthy and safe. We made a lot of money last March and it seems that we’re about to make much more on this March decline, but you have to be healthy to enjoy the results.
As always, we'll keep you - our subscribers - informed.
By the way, we’re currently providing you with a possibility to extend your subscription by a year, two years or even three years with a special 20% discount. This discount can be applied right away, without the need to wait for your next renewal – if you choose to secure your premium access and complete the payment upfront. The boring time in the PMs is definitely over and the time to pay close attention to the market is here. Naturally, it’s your capital, and the choice is up to you, but it seems that it might be a good idea to secure more premium access now, while saving 20% at the same time. Our support team will be happy to assist you in the above-described upgrade at preferential terms – if you’d like to proceed, please contact us.
To summarize:
Trading capital (supplementary part of the portfolio; our opinion): Full speculative short positions (300% of the full position) in mining stocks are justified from the risk to reward point of view with the following binding exit profit-take price levels:
Mining stocks (price levels for the GDXJ ETF): binding profit-take exit price: $24.12; stop-loss: none (the volatility is too big to justify a stop-loss order in case of this particular trade)
Alternatively, if one seeks leverage, we’re providing the binding profit-take levels for the JDST (2x leveraged) and GDXD (3x leveraged – which is not suggested for most traders/investors due to the significant leverage). The binding profit-take level for the JDST: $39.87; stop-loss for the JDST: none (the volatility is too big to justify a SL order in case of this particular trade); binding profit-take level for the GDXD: $94.87; stop-loss for the GDXD: none (the volatility is too big to justify a SL order in case of this particular trade).
For-your-information targets (our opinion; we continue to think that mining stocks are the preferred way of taking advantage of the upcoming price move, but if for whatever reason one wants / has to use silver or gold for this trade, we are providing the details anyway.):
Silver futures upside profit-take exit price: unclear at this time - initially, it might be a good idea to exit when gold moves to $1,512.
Gold futures upside profit-take exit price: $1,512.
Long-term capital (core part of the portfolio; our opinion): No positions (in other words: cash
Insurance capital (core part of the portfolio; our opinion): Full position
Whether you already subscribed or not, we encourage you to find out how to make the most of our alerts and read our replies to the most common alert-and-gold-trading-related-questions.
Please note that we describe the situation for the day that the alert is posted in the trading section. In other words, if we are writing about a speculative position, it means that it is up-to-date on the day it was posted. We are also featuring the initial target prices to decide whether keeping a position on a given day is in tune with your approach (some moves are too small for medium-term traders, and some might appear too big for day-traders).
Additionally, you might want to read why our stop-loss orders are usually relatively far from the current price.
Please note that a full position doesn't mean using all of the capital for a given trade. You will find details on our thoughts on gold portfolio structuring in the Key Insights section on our website.
As a reminder - "initial target price" means exactly that - an "initial" one. It's not a price level at which we suggest closing positions. If this becomes the case (like it did in the previous trade), we will refer to these levels as levels of exit orders (exactly as we've done previously). Stop-loss levels, however, are naturally not "initial", but something that, in our opinion, might be entered as an order.
Since it is impossible to synchronize target prices and stop-loss levels for all the ETFs and ETNs with the main markets that we provide these levels for (gold, silver and mining stocks - the GDX ETF), the stop-loss levels and target prices for other ETNs and ETF (among other: UGL, GLL, AGQ, ZSL, NUGT, DUST, JNUG, JDST) are provided as supplementary, and not as "final". This means that if a stop-loss or a target level is reached for any of the "additional instruments" (GLL for instance), but not for the "main instrument" (gold in this case), we will view positions in both gold and GLL as still open and the stop-loss for GLL would have to be moved lower. On the other hand, if gold moves to a stop-loss level but GLL doesn't, then we will view both positions (in gold and GLL) as closed. In other words, since it's not possible to be 100% certain that each related instrument moves to a given level when the underlying instrument does, we can't provide levels that would be binding. The levels that we do provide are our best estimate of the levels that will correspond to the levels in the underlying assets, but it will be the underlying assets that one will need to focus on regarding the signs pointing to closing a given position or keeping it open. We might adjust the levels in the "additional instruments" without adjusting the levels in the "main instruments", which will simply mean that we have improved our estimation of these levels, not that we changed our outlook on the markets. We are already working on a tool that would update these levels daily for the most popular ETFs, ETNs and individual mining stocks.
Our preferred ways to invest in and to trade gold along with the reasoning can be found in the how to buy gold section. Furthermore, our preferred ETFs and ETNs can be found in our Gold & Silver ETF Ranking.
As a reminder, Gold & Silver Trading Alerts are posted before or on each trading day (we usually post them before the opening bell, but we don't promise doing that each day). If there's anything urgent, we will send you an additional small alert before posting the main one.
Thank you.
Przemyslaw Radomski, CFA
Founder, Editor-in-chief

