
tools spotlight

-
Gold, Silver, Miners: The Zenith and Its Shadows
May 21, 2021, 8:19 AMMost likely we saw the precious metals reach their zenith on May 19, like the tropical sun on the day of the equinox. What will come afterward?
Usually, when we think about the zenith, we have in mind a natural phenomenon caused by the tropical sun being exactly over our heads. But the zenith can also mean that something reached its peak – and just as the sun starts casting increasingly longer shadows after retreating from the highest point in the sky, the same happens when an asset on the market starts backing out after topping.
Its shadow – i.e., its ramifications – is cast in one particular direction, and it usually goes this way until the sun sets. Therefore, just as the shadows are getting longer, and longer, and longer, the drop after the top could go lower, and lower, and lower…
During yesterday’s (May 20) session, we saw more or less the repeat of the previous day’s indications – gold stocks reversed once again, and gold is trading where it was trading two days ago. Silver is already trading lower. Consequently, much of my previous comments remain up-to-date.
On Wednesday, gold miners reversed in a classically bearish way, and yesterday’s low-volume session (also a reversal) looks like Wednesday’s reversal’s shadow.
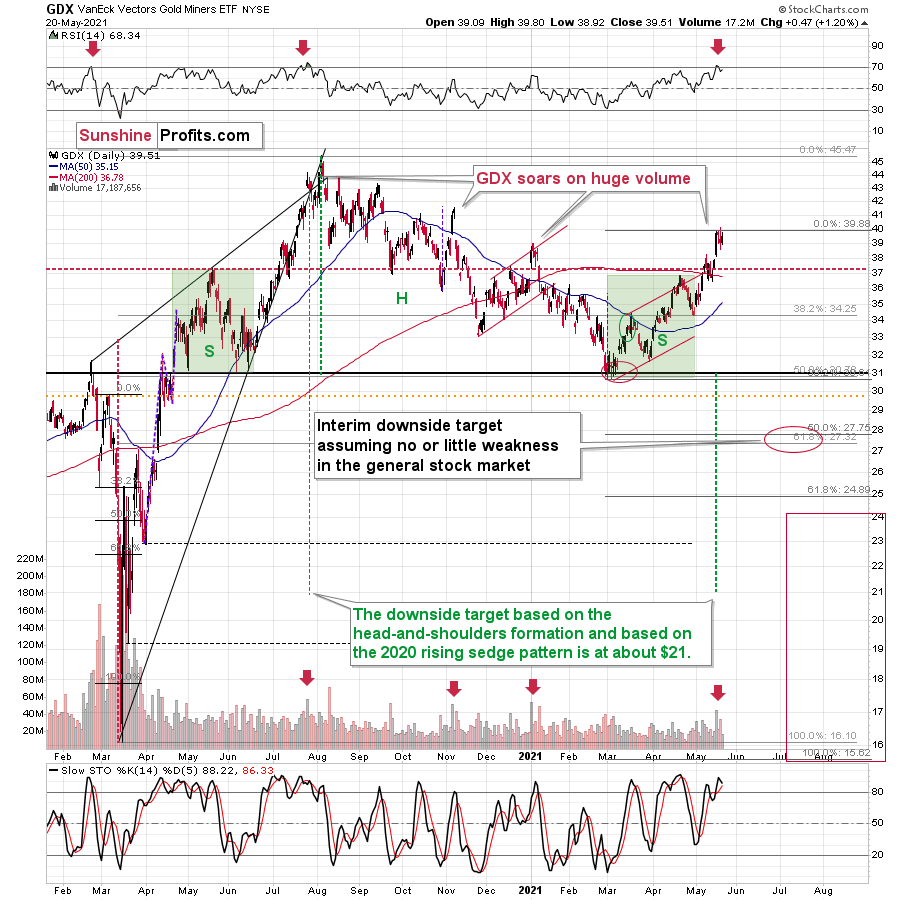
The GDX ETF first tried to rally to new highs, then it failed to hold them. Wednesday’s reversal took place on big volume (important bearish confirmation), and the “shadow reversal” took place on relatively low volume. The low volume doesn’t confirm the reversal, but it more or less invalidates the seemingly bullish fact that miners closed yesterday’s session higher.
Moreover, please note that the volume was similarly low to what we saw on January 7, 2021, when the 4-day top was ending. Yesterday was the fourth day of what appears to be a broad top.
Let’s also keep in mind that the RSI indicator just moved back below 70 after being above it. This happens rarely, and when it happened previously (in the past 1.5 years), it meant that a huge price decline was about to follow.
Silver reversed in a different manner.
The white metal didn’t move to new highs yesterday. Conversely, it moved lower, and then it only recovered intraday decline without moving visibly higher (silver futures ended the day only $0.04 higher). The true reversal happened on Tuesday – and what we saw yesterday and on Wednesday was just its consequence. It’s quite often the case that the tops and bottoms in the precious metals market take place more or less (!) simultaneously, but not necessarily exactly on the same day. Consequently, what we saw this week is quite normal.
Gold didn’t manage to move to new intraday highs yesterday – however, it didn’t decline visibly either.
It moved a bit lower in today’s pre-market trading, and overall, it’s just $8 higher than it was at the end of Tuesday’s session. This might seem positive given that gold managed to move slightly above its declining medium-term resistance lines. However, given what’s happening in the mining stocks and all the signals from them, I doubt this breakout will really hold.
Here’s another reason: the Fed is attempting to control the long-term rates, and we just saw a short-term exodus from the cryptocurrency market. Theoretically, capital should be flowing into gold as a safe-haven / inflation-hedge asset, and it should be soaring. But it’s not. It did move higher recently, but compared to what “should have” happened given the importance of the above-mentioned developments, the reaction is barely noticeable.
Instead, gold seems to be insisting on repeating – to some extent – its 2012 performance, and – to some extent – its 2008 performance. Either way, it seems that gold is about to slide.
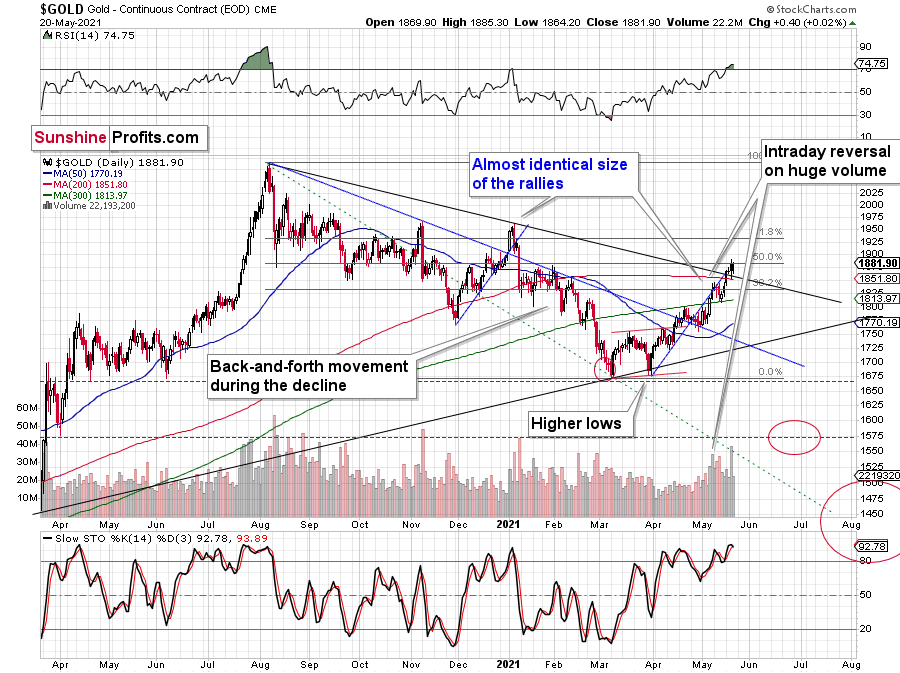
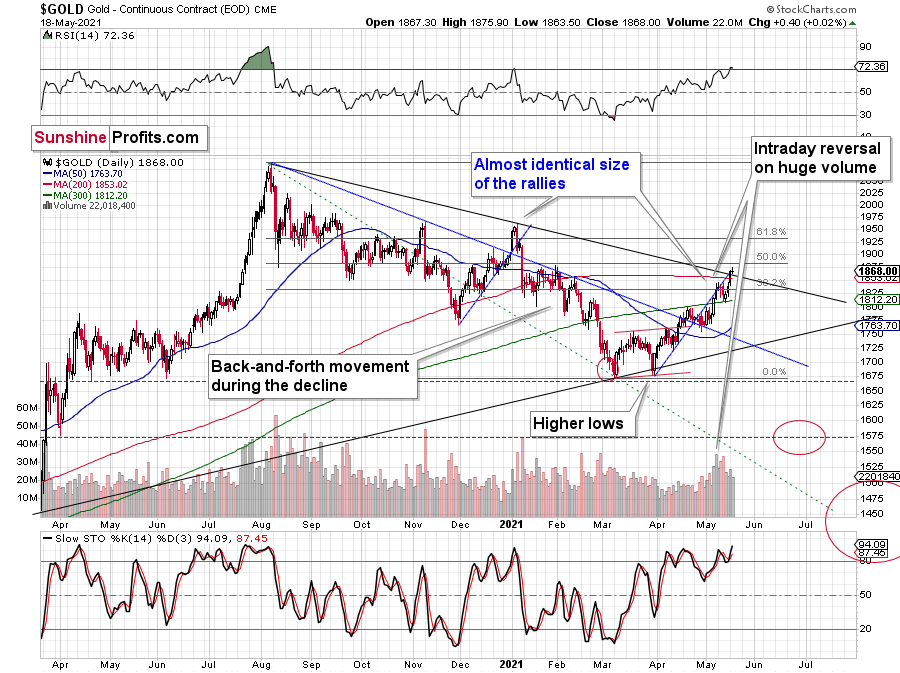
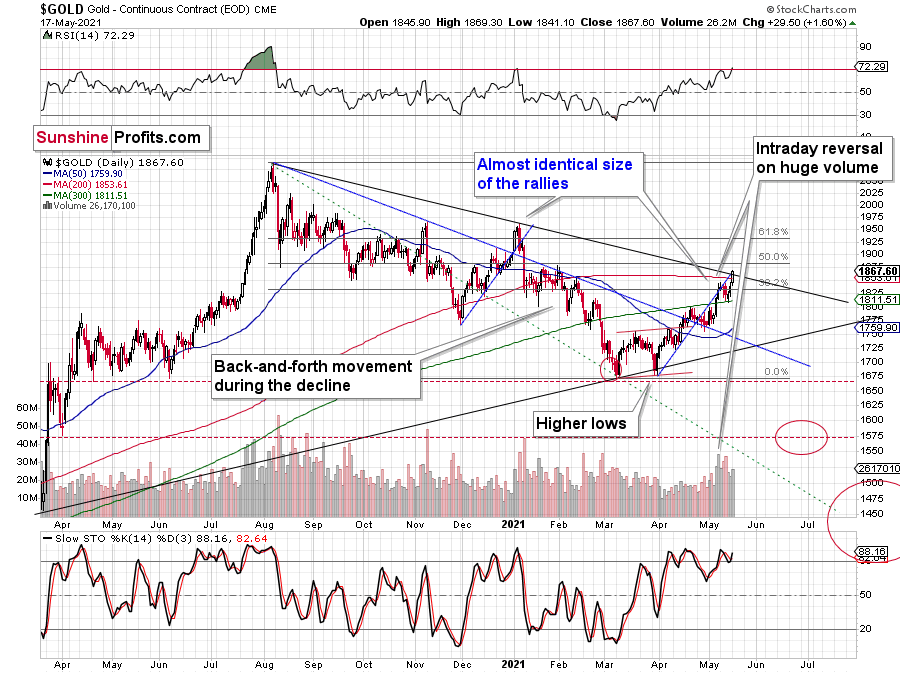
The reversal in gold took place after gold moved very close to its mid-January highs and the 50% Fibonacci retracement based on the August 2020 – March 2021 decline.
The sizes of the current rally (taking the second March bottom as the starting point) and the rally that ended at the beginning of this year are practically identical at the moment.
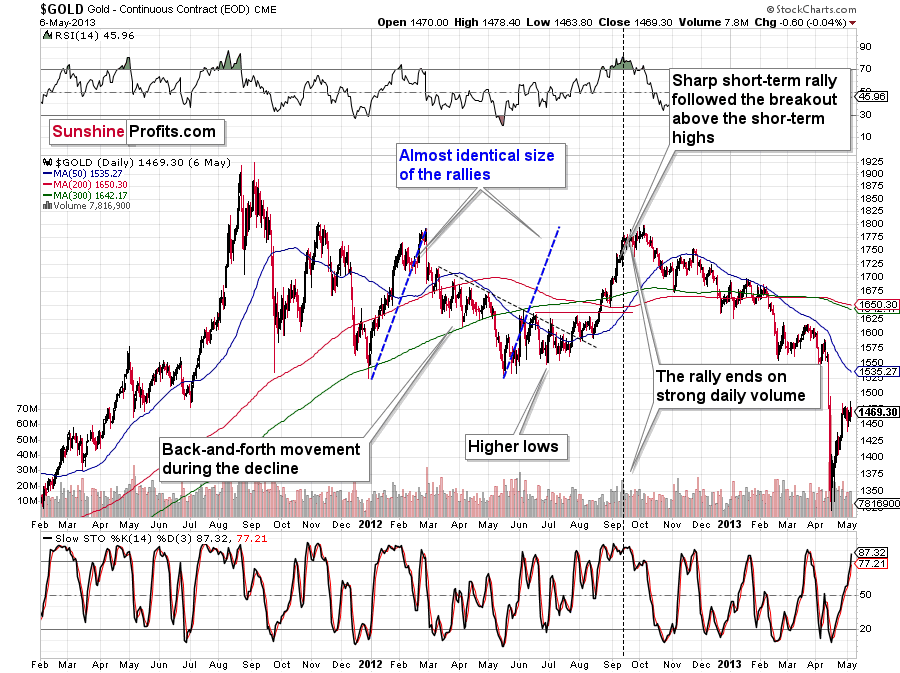
Just as the rallies from early 2012 and late 2012 (marked with blue) were almost identical, the same could happen now.
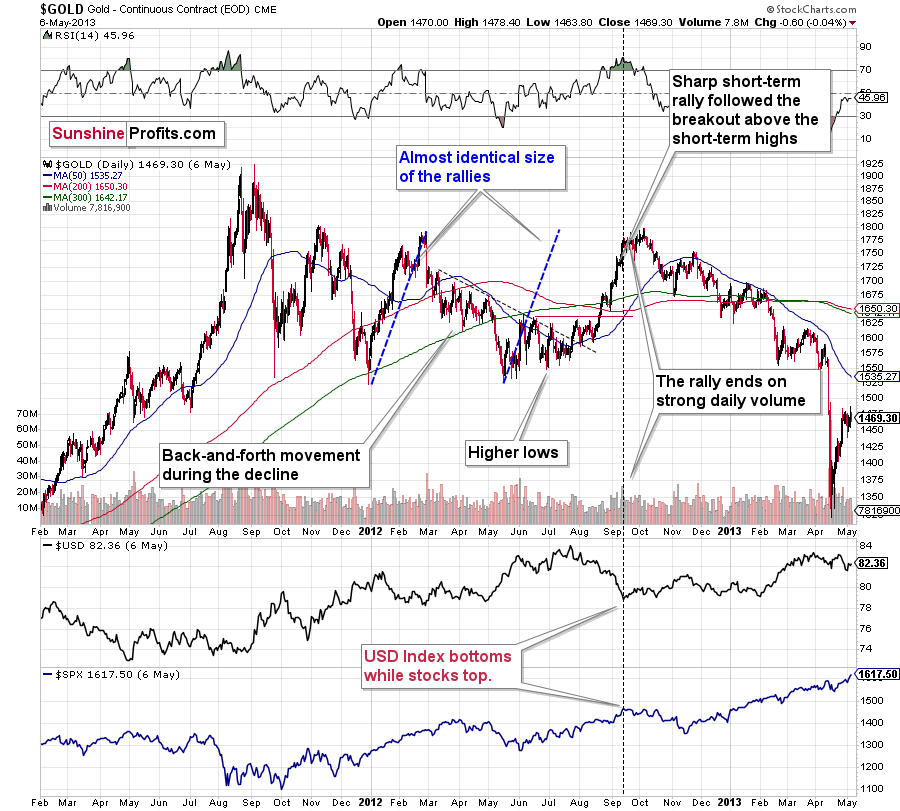
The March 2021 low formed well below the previous low, but as far as other things are concerned, the current situation is similar to what happened in 2012.
The relatively broad bottom with higher lows is what preceded both final short-term rallies – the current one, and the 2012 one. Their shape as well as the shape of the decline that preceded these broad bottoms is very similar. In both cases, the preceding decline had some back-and-forth trading in its middle, and the final rally picked up pace after breaking above the initial short-term high.
Interestingly, the 2012 rally ended in huge volume, which is exactly what we saw also on May 19 this year.
What is even more interesting is that back in 2013 gold started its gargantuan (…) slide from about $1,800 and it is not far (from the long-term point of view) from this level also today.
Moreover, let’s keep in mind that the RSI indicator just topped slightly above 70, which is what tends to happen when gold tops. The upside seems very limited. In fact, it seems that the top in gold might already be in.
The lower part of the above chart shows how the USD Index and the general stock market performed when gold ended its late-2012 rally and was starting its epic decline. In short, that was when the USD Index bottomed, and when the general stock market topped.
Thank you for reading our free analysis today. Please note that the above is just a small fraction of the full analyses that our subscribers enjoy on a regular basis. They include multiple premium details such as the interim targets for gold and mining stocks that could be reached in the next few weeks. We invite you to subscribe now and read today’s issue right away.
Sincerely,
Przemyslaw Radomski, CFA
Founder, Editor-in-chief -
Gold, Silver, Miners: Reversals Never Look the Same
May 20, 2021, 8:25 AMAvailable to premium subscribers only.
-
Gold: Reversal Is the Name of the Game
May 19, 2021, 9:16 AMWhen the USDX declines, the PMs usually celebrate and rise as a result. However, this was not the case yesterday – and we can’t ignore it.
“Reversal” is the name of the game, at least when it comes to the precious metals market.
The USD Index declined profoundly once again yesterday (May 18), and gold, silver, and mining stocks ignored this move. They didn’t want to follow in its footsteps anymore.
As you can see, the USD Index reached its horizontal support provided by the previous important low. Low that was formed after a fake breakdown below the neck level of a supposedly bearish head-and-shoulders pattern. The USDX is not only at similar price levels; it’s also right after a supposedly bearish breakdown below. The reversal could be just around the corner, or we might have already seen it, given today’s (small, but still) pre-market move higher.
As I mentioned above, yesterday’s sizable decline in the USDX should have triggered substantial rallies in the PMs. What happened instead?
What Happened to Gold?
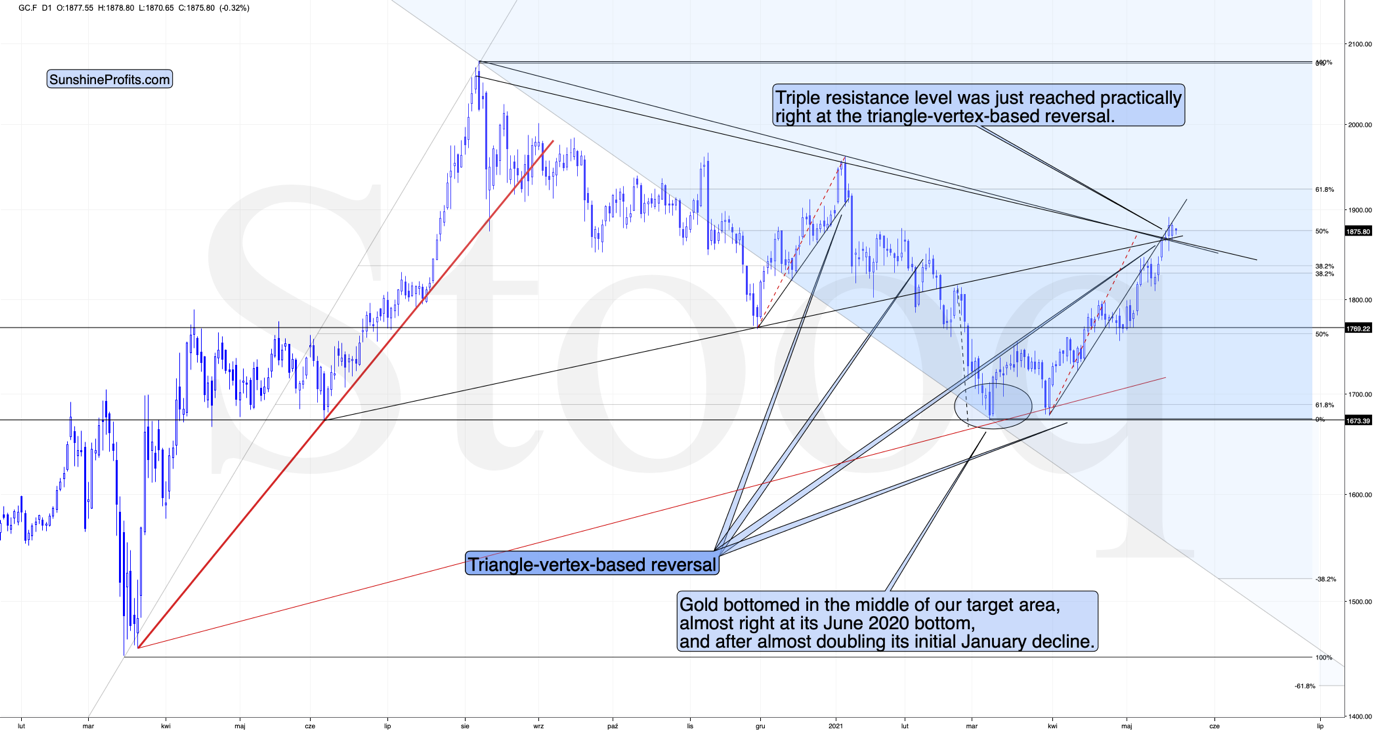
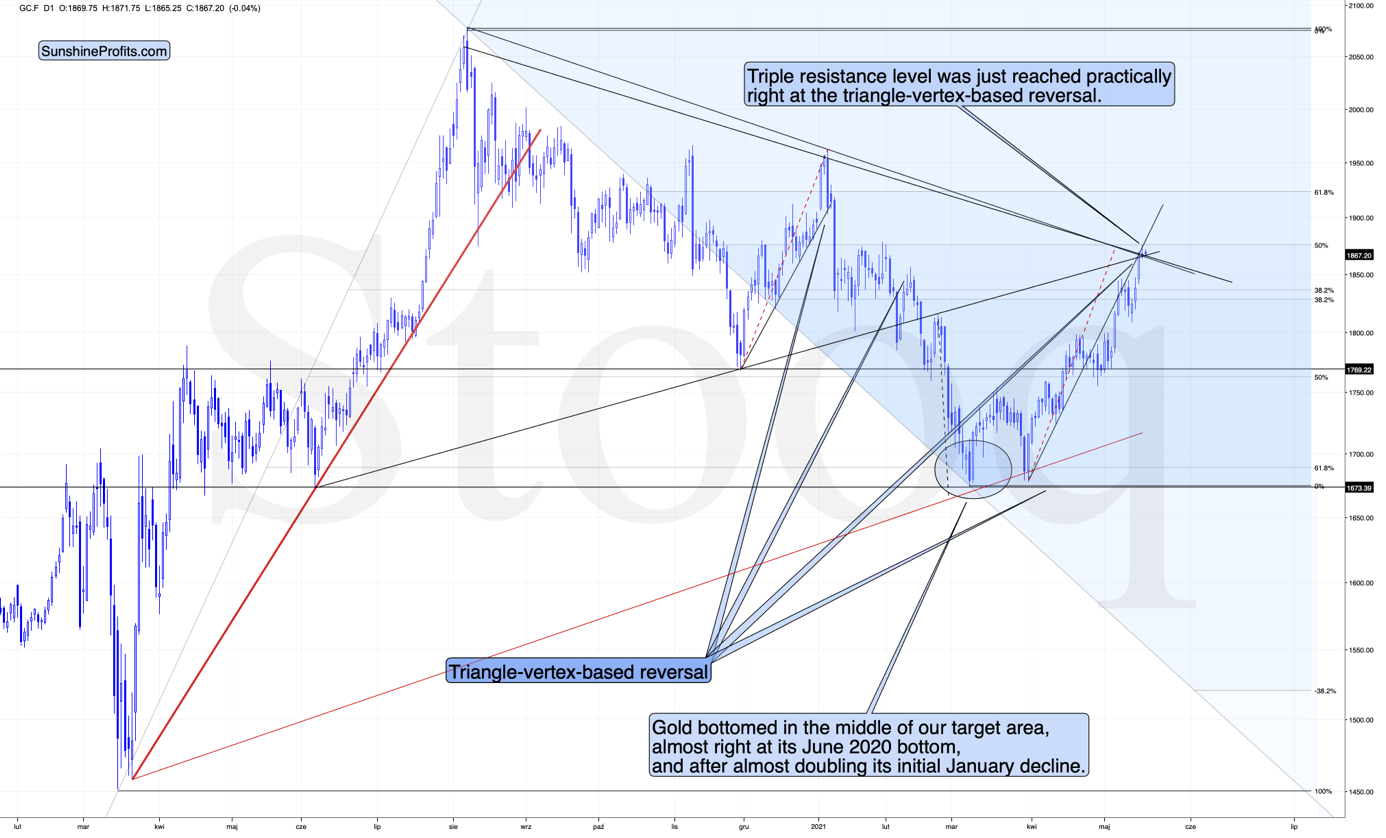
Gold reversed right at its triangle-vertex-based… well, reversal, and the combination of resistance lines.
The reversal in gold took place after gold moved very close to its mid-January highs and the 50% Fibonacci retracement based on the August 2020 – March 2021 decline.
The sizes of the current rally (taking the second March bottom as the starting point) and the rally that ended at the beginning of this year are practically identical at the moment.
Just as the rallies from early 2012 and late 2012 (marked with blue) were almost identical, the same could happen now.
The March 2021 low formed well below the previous low, but as far as other things are concerned, the current situation is similar to what happened in 2012.
The relatively broad bottom with higher lows is what preceded both final short-term rallies – the current one, and the 2012 one. Their shape as well as the shape of the decline that preceded these broad bottoms is very similar. In both cases, the preceding decline had some back-and-forth trading in its middle, and the final rally picked up pace after breaking above the initial short-term high.
Interestingly, the 2012 rally had ended in huge volume, which is exactly what we saw on Friday. To be 100% precise, the 2012 rally didn’t end then, but it was when over 95% of the rally was over. Gold moved very insignificantly higher since that time. Most importantly, though, it was the “dollars to the upside, hundreds of dollars to the downside” situation. And it seems that we are in this kind of situation right now once again.
Interestingly, back in 2013 gold started its gargantuan (…) slide from about $1,800 and it is not far from this level also today.
Moreover, let’s keep in mind that the RSI indicator just topped slightly above 70, which is what tends to happen when gold tops. The upside seems very limited. In fact, it seems that the top in gold is already in.
The lower part of the above chart shows how the USD Index and the general stock market performed when gold ended its late-2012 rally and was starting its epic decline. In short, that was when the USD Index bottomed, and when the general stock market topped. I don’t want to get into too many USD-related short-term details, as I did that yesterday, but let’s take a closer look at the short-term developments on the stock market.
Stock Market
In short, the situation doesn’t look pretty. To explain, I wrote the following on May 11:
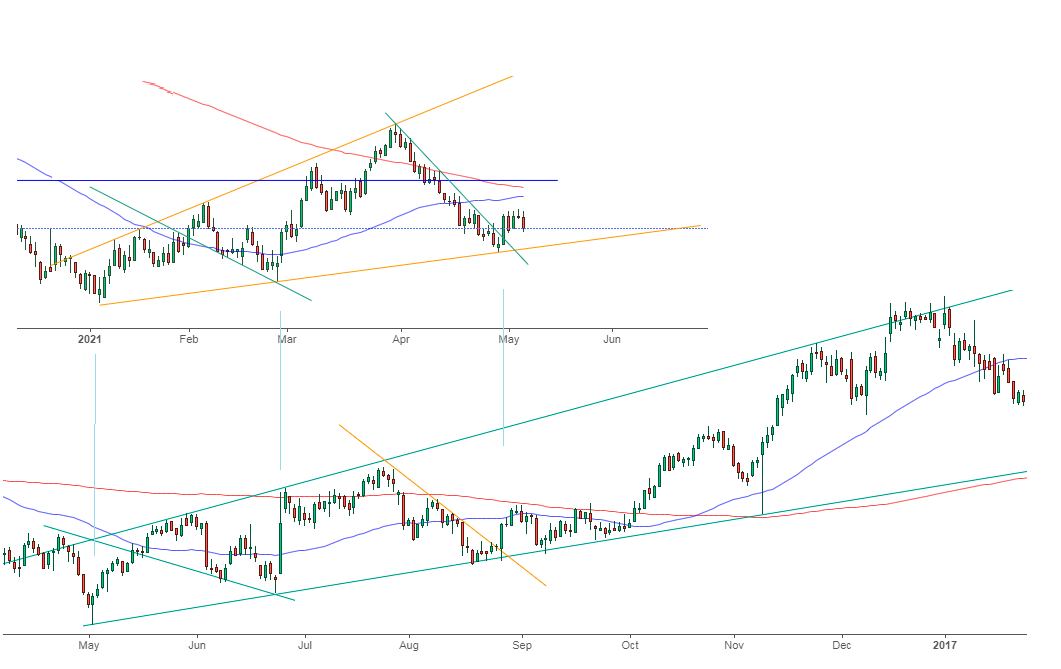
The markets are self-similar (which is another way of saying that they have a fractal nature), which generally means that while the history tends to rhyme, it also tends to rhyme in similar shapes of alike or various sizes.
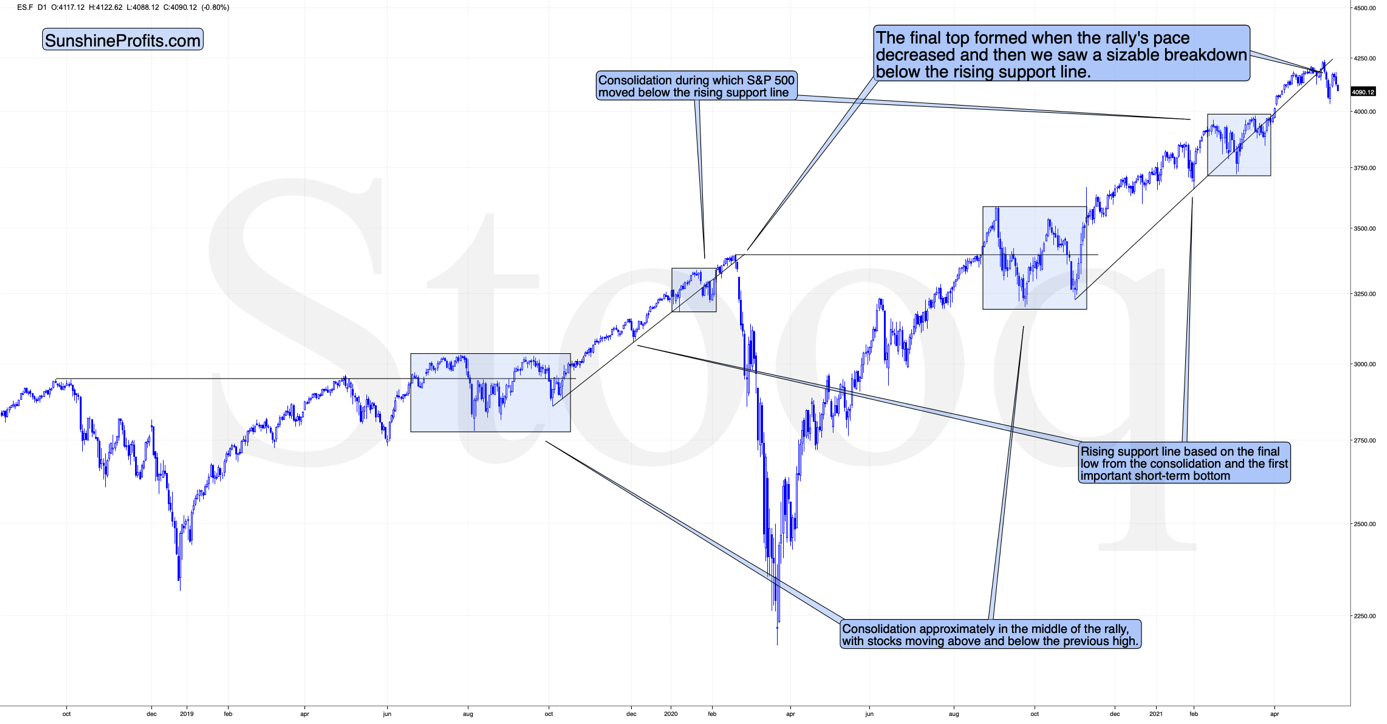
For example, the rally from 2018–2020 seems very similar to the rally from 2020 to the present. Both rallies started after a sharp decline, and the first notable correction took the form of back-and-forth trading around the previous high. I marked those situations with big rectangles.
Then the rally continued with relatively small week-to-week volatility. I created rising support lines based on the final low of the broad short-term consolidation and the first notable short-term bottom.
This line was broken, and some back-and-forth trading followed, but it was only about half of the previous correction in terms of price and time.
Then, we saw a sharp rally that then leveled off. And that was the top. The thing that confirmed the top was the visible breakdown below the rising support line right after stocks invalidated a tiny breakout to new highs. That’s what happened in February 2020, and that’s what happened this month.
“Time is more important than price; when the time comes, the price will reverse”. Both rallies took an almost identical amount of time: 60 weeks vs. 59 weeks.
Stocks moved a bit higher recently, but yesterday’s and today’s pre-market decline seem to be telling investors that the initial slide was not just another correction in the bull market. This is the first time when the S&P 500 was unable to get back above its rising support line after temporarily breaking below it. Instead, we saw an attempt to rally, and now we see another slide lower.
This is bearish for gold’s forecast, but also very bearish for silver and mining stocks, which are more correlated with the stock market than gold is.
Speaking of silver, let’s take a look at its price chart.
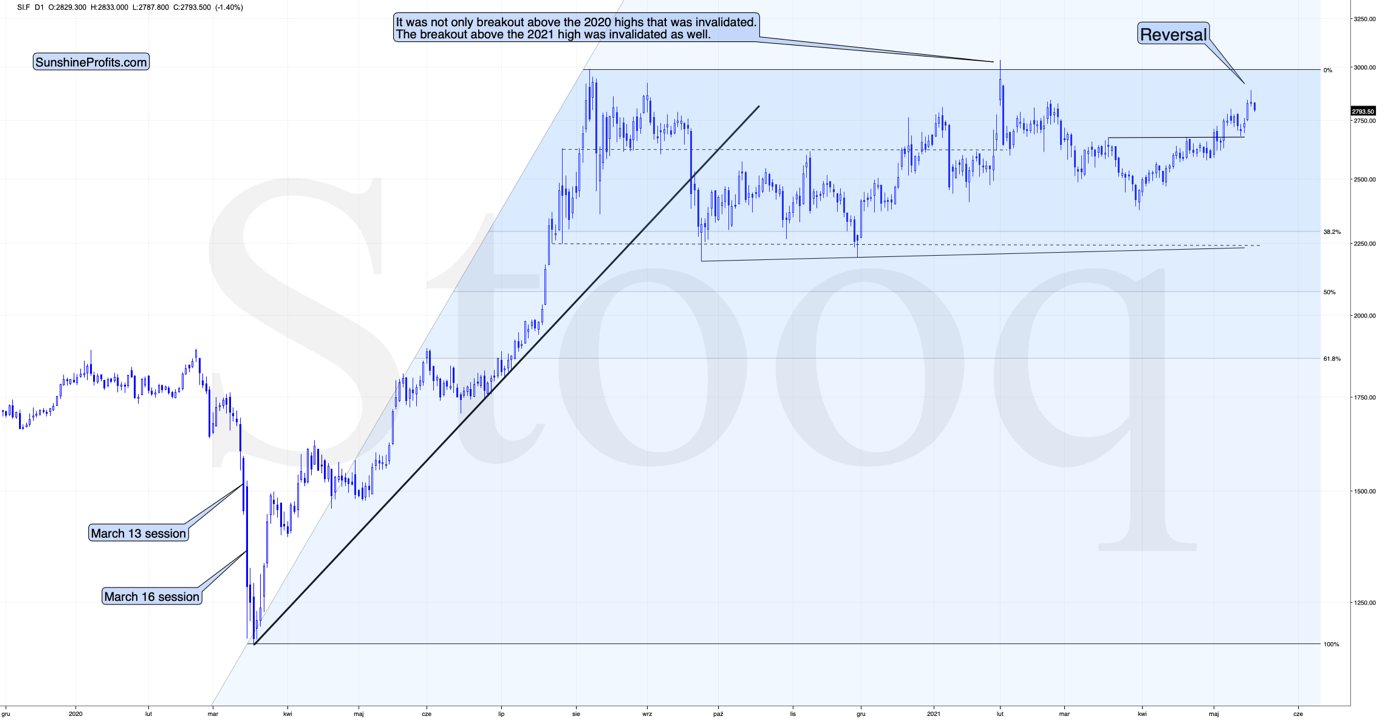
The white metal has clearly reversed yesterday (May 18), and at the moment of writing these words, it’s trading back below its May 10 high and the $28 level. Just like it is the case with gold, it seems to me that the outlook for silver is bearish.
Mining stocks seem to have reversed in a rather odd manner, but in one that’s ultimately in tune with how tops are formed based on technical analysis principles.
The same (or very similar) opening and closing price levels accompanied by an intraday reversal after an intraday decline – when seen after a short-term rally – are called a “hanging man” candlestick. In short, it’s one of the reversal candlestick patterns. It should have been confirmed by a huge volume – it wasn’t, so it’s not that important, though.
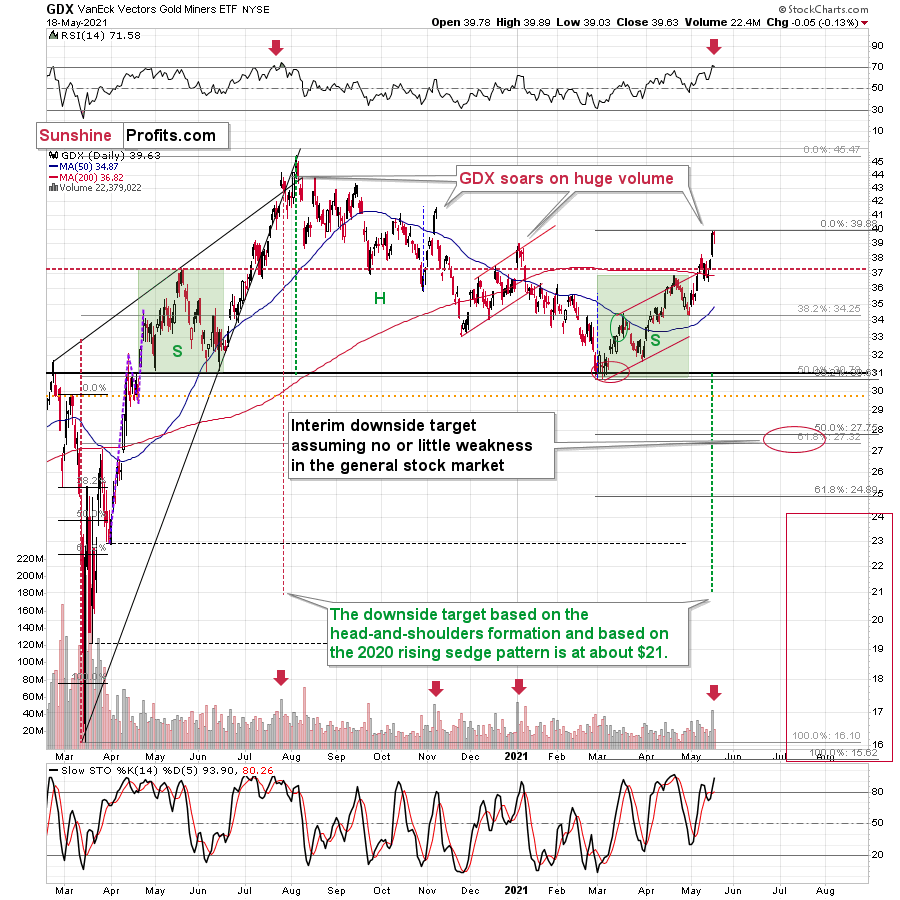
The most important details are still based on the preceding day’s huge volume, the RSI, and the way the GDX ETF topped in the past.
The GDX ETF soared to new highs on volume that was much greater than 40M shares. This happened only three times in the past 12 months. In each of those three cases, it was a major top, or it was very, very close to it.
The RSI just moved above 70, and it happened only twice recently. One time it heralded the 2020 top, and the other time we saw it in late February 2020 – right before a huge slide started.
Consequently, taking all the above into account, it seems to me that the situation in the precious metals market is very bearish right now, as it seems to be either topping or after the top. If I didn’t have a short position in the junior mining stocks right now, I would have opened it today.
Thank you for reading our free analysis today. Please note that the above is just a small fraction of the full analyses that our subscribers enjoy on a regular basis. They include multiple premium details such as the interim targets for gold and mining stocks that could be reached in the next few weeks. We invite you to subscribe now and read today’s issue right away.
Sincerely,
Przemyslaw Radomski, CFA
Founder, Editor-in-chief -
Gold, GDX, GDXJ: Have We Reached a Tipping Point?
May 18, 2021, 8:13 AMTaking history into consideration, we are on the brink of change. If I weren’t short on the miners already, I would open the position headfirst.
Disappointment, despair, and the need to urgently “do something to fix” the situation are all feelings that seem natural at this time, provided that one – just like me – decided to profit on the decline in the precious metals market. It’s true that the previous long position was closed profitably after we successfully exited short positions almost right at the March bottoms, but the emotional part of one’s brain tends to remember the very recent memories much more vividly.
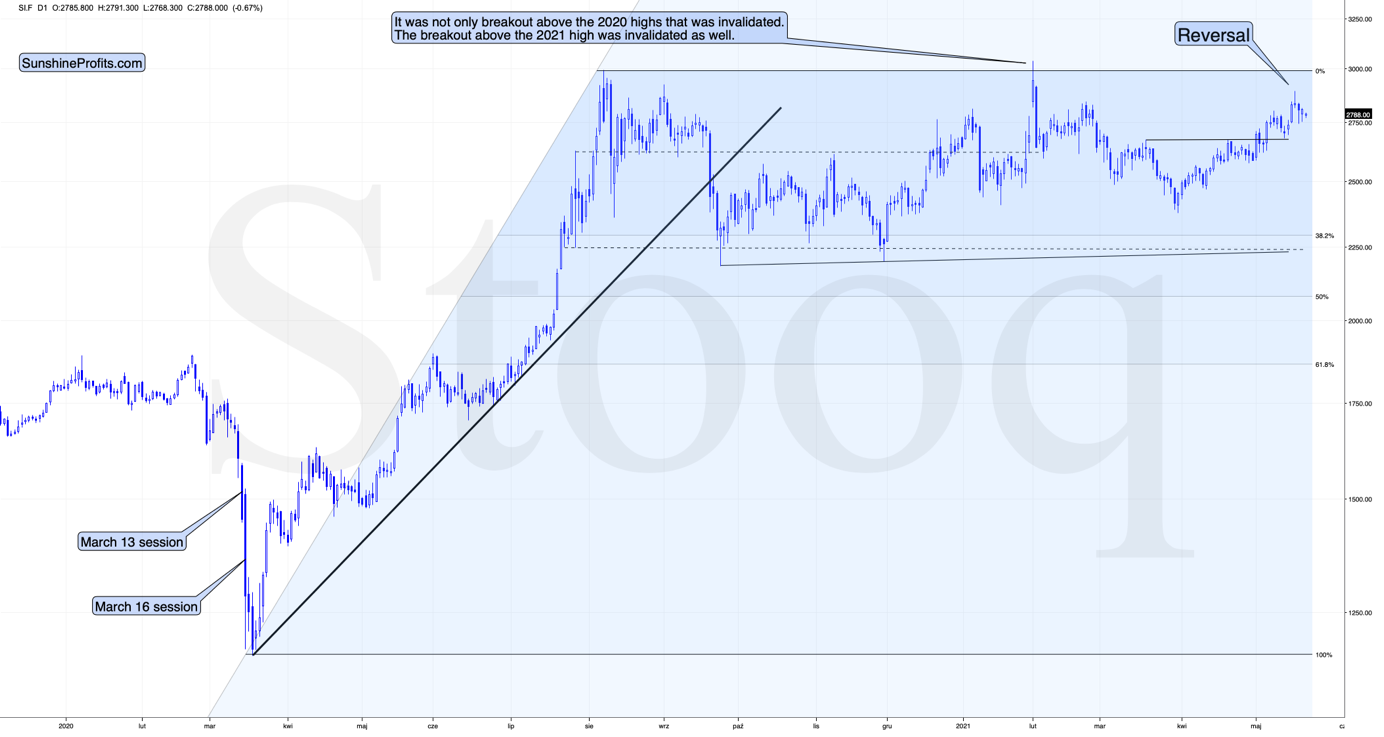
There are signs that might make the outlook bullish, like a decisive breakout above the 2020 highs, but so far we haven’t seen them. Conversely, it’s imperative to keep in mind what happened and what didn’t happen, while staying alert to all changes that might seem really positive.
The Fed has been keeping the interest rates at ultra-low levels for many months, and it has just pledged to keep them low for a long time. The world is enduring the pandemic, and the amount of money that entered the system is truly astonishing. The savings available to investors skyrocketed. The USD Index has been beaten down from over 100 to about 90. And yet, gold is not at new highs. In fact, despite the 2020 attempt to rally above its 2011 high, gold’s price collapsed, and it invalidated the breakout above these all-important highs. It’s now trading just a few tens of dollars higher than it had been trading in 2013, right before the biggest slide of the recent years.
Something doesn’t add up with regard to gold’s bullish outlook, does it?
Exactly. Gold is not yet ready to soar, and if it wasn’t for the pandemic-based events and everything connected to them, it most likely wouldn’t have rallied to, let alone above its 2011 highs before declining profoundly. And what happens if a market is practically forced to rally, but it’s not really ready to do so? Well, it rallies… For a while. Or for a bit longer. But eventually, it slides once again. It does what it was supposed to do anyway - the only thing that changes is the time. Everything gets delayed, and the ultimate downside targets could increase, but overall, the big slide is not avoided.
Let’s say that again. Not avoided, but delayed.
Gold Price Technicals
That’s what we can infer from looking at the entire landscape, but what can we infer from the day-to-day price movements and the latest technical developments?
In yesterday’s (May 17) intraday analysis, I wrote the following:
Based on today’s pre-market upswing, gold might reach its declining medium-term resistance line (~1,860) any hour now, which might seem like a very bullish development until one considers the following:
1. Based on the self-similarity to 2012, that’s exactly what gold “should” do right before topping and sliding.
2. This move would make the size of the current rally practically identical to the rally from late 2020 to early 2021, which was followed by a sharp slide.
3. We have a short-term triangle-vertex-based reversal in the junior miners early this week, so we would likely see some kind of reversal anyway, and since the current move is up, we’re likely to see a top shortly.
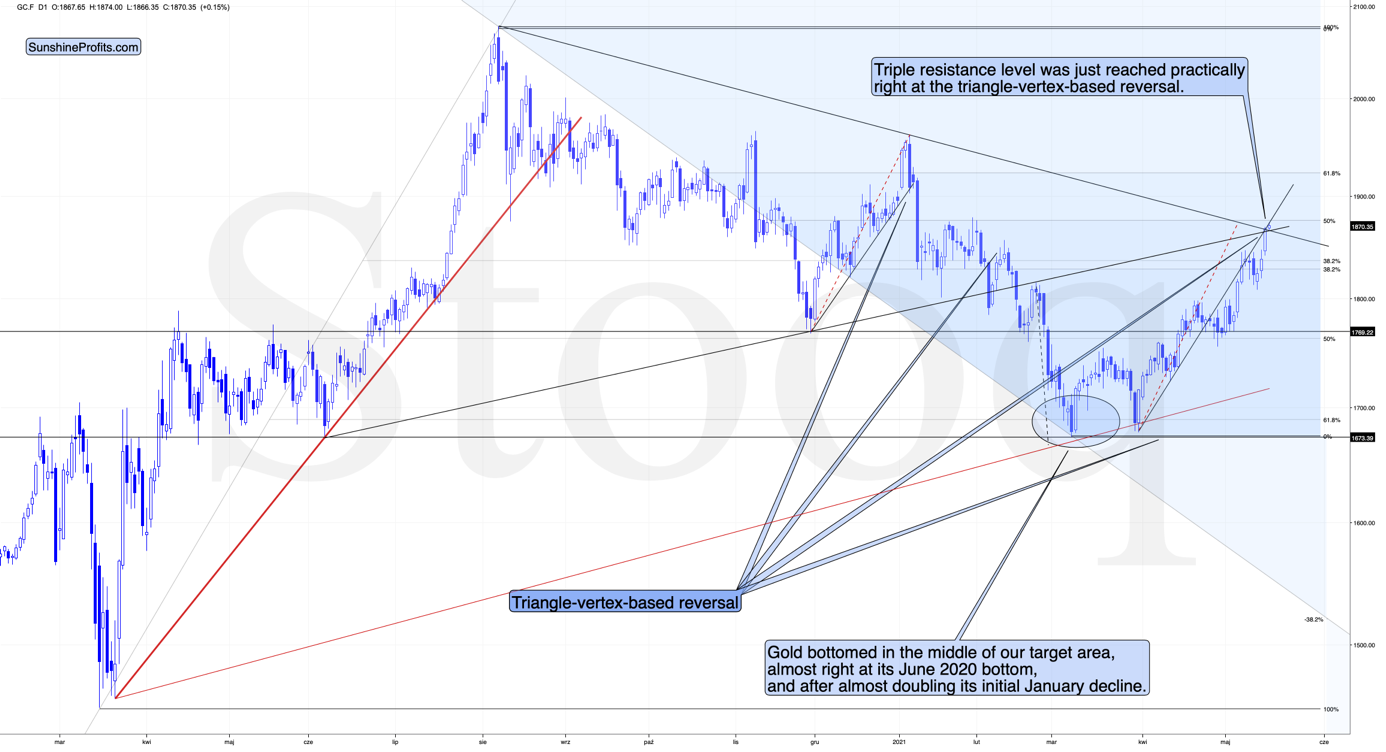
At the moment of writing these words, gold’s intraday high is $1,867.50 – right at the intersection of three resistance lines and the triangle-vertex-based reversal.
At the same time, the size of the recent upswing is almost identical to the size of the rally that preceded the early-2021 top. Consequently, it’s highly likely that what we see right now is the final reversal that we’ve been waiting for.
To be precise, there are two triangle-vertex-based reversals aligned next to each other. One was yesterday, and the other is today. Today’s reversal point is based on the rising support line based on the June and November 2020 bottoms, while the declining resistance line is based on the August 2020 and January 2021 tops. Today’s reversal is grounded on more important lines, so its indication is more profound.
So far today, we’ve seen a reversal in gold after gold moved very close to its mid-January highs and the 50% Fibonacci retracement based on the August 2020 – March 2021 decline.
The sizes of the current rally (taking the second March bottom as the starting point) and the rally that ended at the beginning of this year are practically identical at the moment.
Just as the rallies from early 2012 and late 2012 (marked with blue) were almost identical, the same could happen now.
The March 2021 low formed well below the previous low, but as far as other things are concerned, the current situation is similar to what happened in 2012.
The relatively broad bottom with higher lows is what preceded both final short-term rallies – the current one, and the 2012 one. Their shape as well as the shape of the decline that preceded these broad bottoms is very similar. In both cases, the preceding decline had some back-and-forth trading in its middle, and the final rally picked up pace after breaking above the initial short-term high.
Interestingly, the 2012 rally had ended in huge volume, which is exactly what we saw on Friday. To be 100% precise, the 2012 rally didn’t end then, but it was when over 95% of the rally was over. Gold moved very insignificantly higher since that time. Most importantly, though, it was the “dollars to the upside, hundreds of dollars to the downside” situation. And it seems that we are in this kind of situation right now once again.
Interestingly again, back in 2013 gold started its gargantuan (…) slide from about $1,800 and it is not far from this level also today.
Moreover, let’s keep in mind that the RSI indicator just topped slightly above 70, which is what tends to happen when gold tops. The upside seems very limited. In fact, it seems that the top in gold is already in.
The Reversal of the USD Index
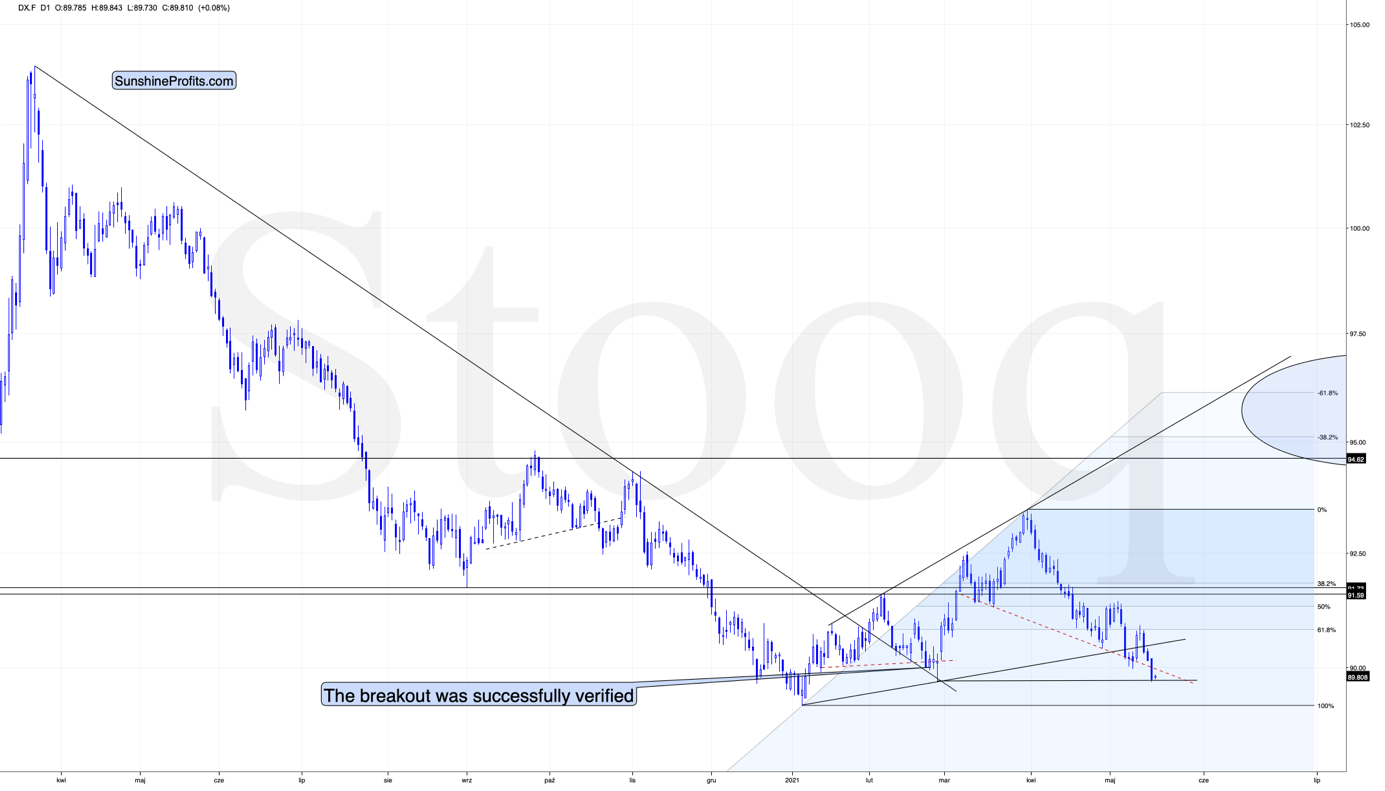
Gold is already reversing while the USD Index is not. Gold has likely topped, while the USDX is likely to reverse shortly. Today is the third session below the rising support line and another intraday attempt to move below the declining red support line (neckline of the potential head and shoulders pattern). Earlier this month, the USDX reversed and rallied precisely then – after three days below the rising support line.
To explain, I wrote on May 11:
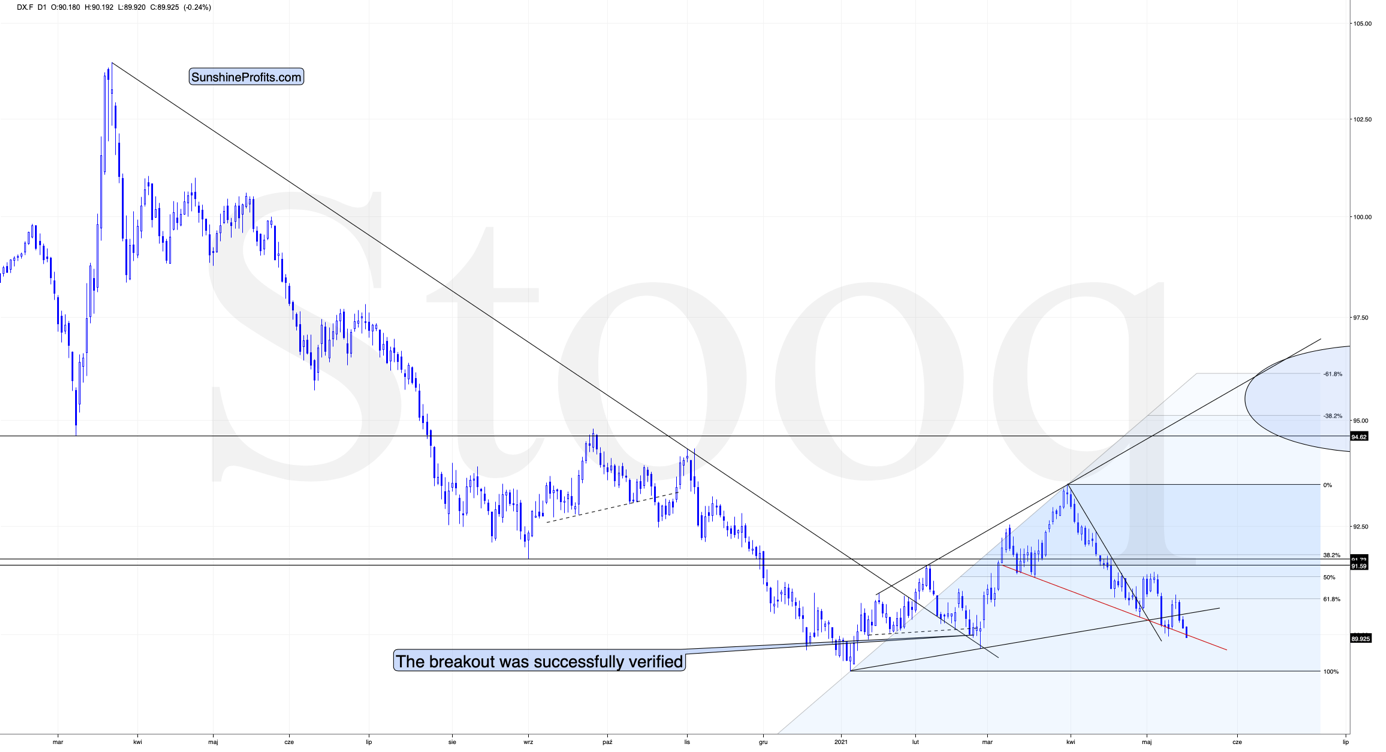
While the self-similarity to 2018 in the USD Index is not as clear as it used to be (it did guide the USDX for many weeks, though), there is also another self-similar pattern that seems more applicable now. One of my subscribers noticed that and decided to share it with us (thanks, Maciej!).
Here’s the quote, the chart, and my reply:
Thank you very much for your comprehensive daily Gold Trading Reports that I am gladly admitting I enjoy a lot. While I was analyzing recent USD performance, (DX) I have spotted one pattern that I would like to validate with you if you see any relevance of it. I have noticed the DX Index performing exactly in the same manner in a time frame between Jan. 1, 2021 and now as the one that started in May 2016 and continued towards Aug. 16. The interesting part is not only that the patterns are almost identical, but also their temporary peeks and bottoms are spotting in the same points. Additionally, 50 daily MA line is almost copied in. Also, 200 MA location versus 50 MA is almost identical too. If the patterns continue to copy themselves in the way they did during the last 4 months, we can expect USD to go sideways in May (and dropping to the area of 90,500 within the next 3 days) and then start growing in June… which in general would be in line with your analysis too.
Please note the below indices comparison (the lower represents the period between May-Dec 2016 and higher Jan – May 2021). I am very much interested in your opinion.
Thank you in advance.
And here’s what I wrote in reply:
Thanks, I think that’s an excellent observation! I read it only today (Monday), so I see that the bearish note for the immediate term was already realized more or less in tune with the self-similar pattern. The USDX moved a bit lower, but it doesn’t change that much. The key detail here would be that the USDX is unlikely to decline much lower, and instead, it’s likely to start a massive rally in the next several months - that would be in perfect tune with my other charts/points.
I wouldn’t bet on the patterns being identical in the very near term, though, just like the late June 2016 and early March 2021 weren’t that similar.
As soon as the USD Index rallies back above the rising support line, the analogy to 2016 will be quite clear once again –the implications will be even more bullish for the USDX and bearish for the precious metals market for the next several months.
Please note that back in 2016 there were several re-tests of the rising support line and tiny breakdowns below it before the USD Index rallied. Consequently, the current short-term move lower is not really concerning, and forecasting gold at much higher levels because of it might be misleading. I wouldn’t bet on the silver bullish forecast either.
So, why has gold rallied recently? Quite likely to complete the similarity to 2012. As it has already achieved this goal, the price of the yellow metal seems ready to slide once again, taking the rest of the precious metals market (especially the junior mining stocks) along with it.
GDX and GDXJ
Speaking of junior mining stocks, unlike GDX, the GDXJ didn’t move to new yearly highs yesterday.
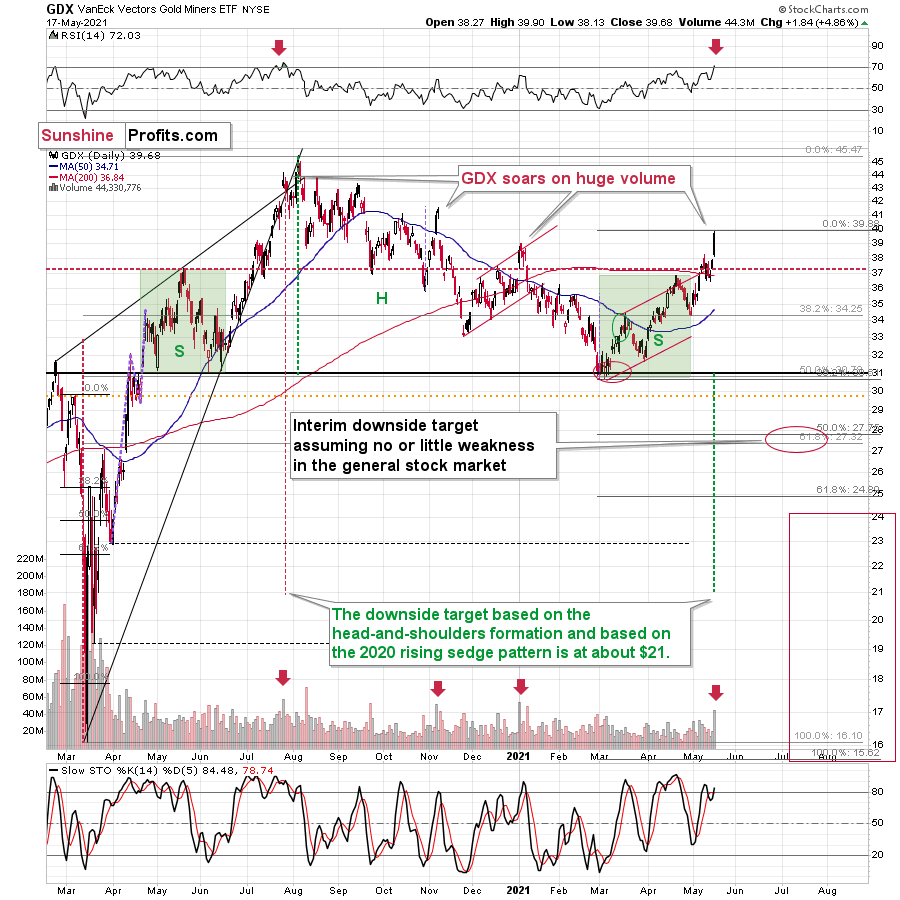
The GDX ETF soared to new highs on volume that was much greater than 40M shares. This happened only three times in the past 12 months. In each of those three cases, it was a major top, or it was very, very close to it.
The RSI just moved above 70, and it happened only twice recently. One time it heralded the 2020 top, and the other time we saw it in late February 2020 – right before a huge slide started.
This is a very bearish combination of factors, and the linkage wasn’t accidental, as we saw something similar in the GDXJ ETF.
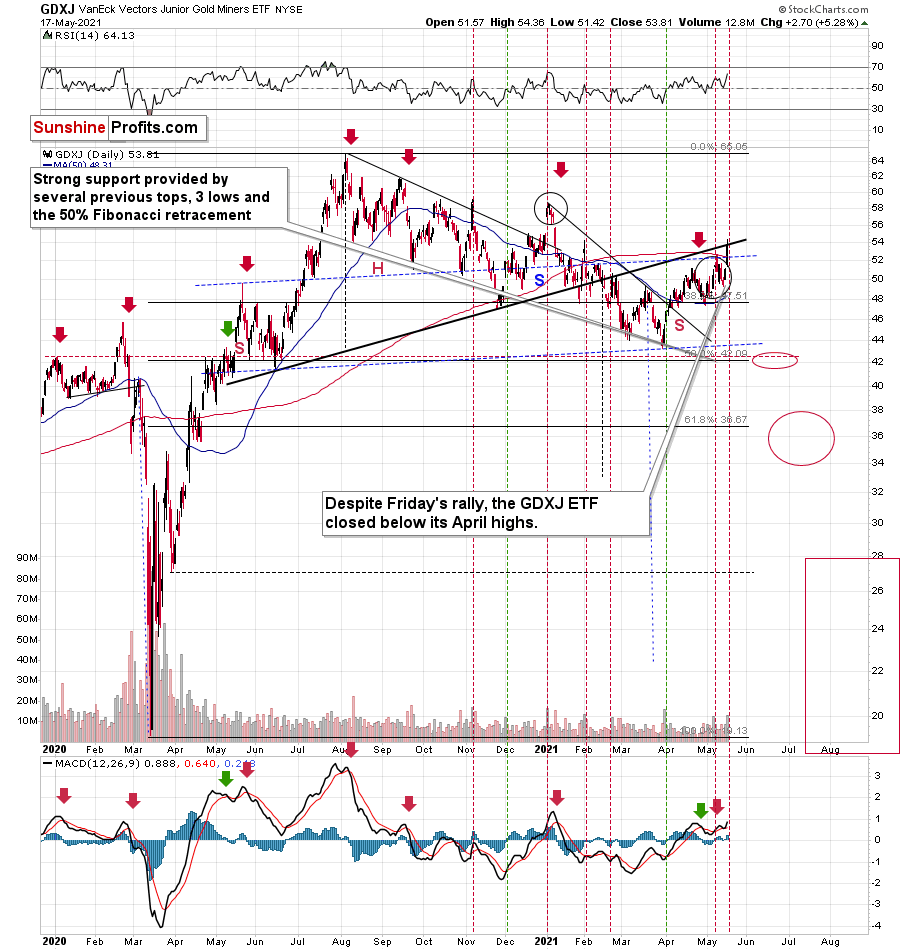
On the above chart, the big daily volumes are marked with horizontal, dashed lines. In most cases in general, and in all cases after sizable rallies, this meant that the top was in.
It’s also notable that while yesterday’s session took junior miners higher, it didn’t take them back above the thick neck level of the previously broken head-and-shoulders pattern. So, the implications thereof remain bearish.
Consequently, taking all the above into account, it seems to me that the situation in the precious metals market is very bearish right now, as it seems to be either topping or after the top. If I didn’t have a short position in the junior mining stocks right now, I would have opened it today.
Thank you for reading our free analysis today. Please note that the above is just a small fraction of the full analyses that our subscribers enjoy on a regular basis. They include multiple premium details such as the interim targets for gold and mining stocks that could be reached in the next few weeks. We invite you to subscribe now and read today’s issue right away.
Sincerely,
Przemyslaw Radomski, CFA
Founder, Editor-in-chief


Gold Investment News
Delivered To Your Inbox
Free Of Charge
Bonus: A week of free access to Gold & Silver StockPickers.
Gold Alerts
More-
Status
New 2024 Lows in Miners, New Highs in The USD Index
January 17, 2024, 12:19 PM -
Status
Soaring USD is SO Unsurprising – And SO Full of Implications
January 16, 2024, 8:40 AM -
Status
Rare Opportunity in Rare Earth Minerals?
January 15, 2024, 2:06 PM

