

Briefly: in our opinion, full (300% of the regular position size) speculative short positions in mining stocks are justified from the risk/reward point of view at the moment of publishing this Alert.
Gold declined yesterday (Apr. 22), and the GDXJ is back below its late-Feb. highs. All things considered, the rallies in both appear to be over or almost over.
Just as I did yesterday, I will start the analysis with the long-term picture of the HUI Index – the flagship proxy for gold stocks.
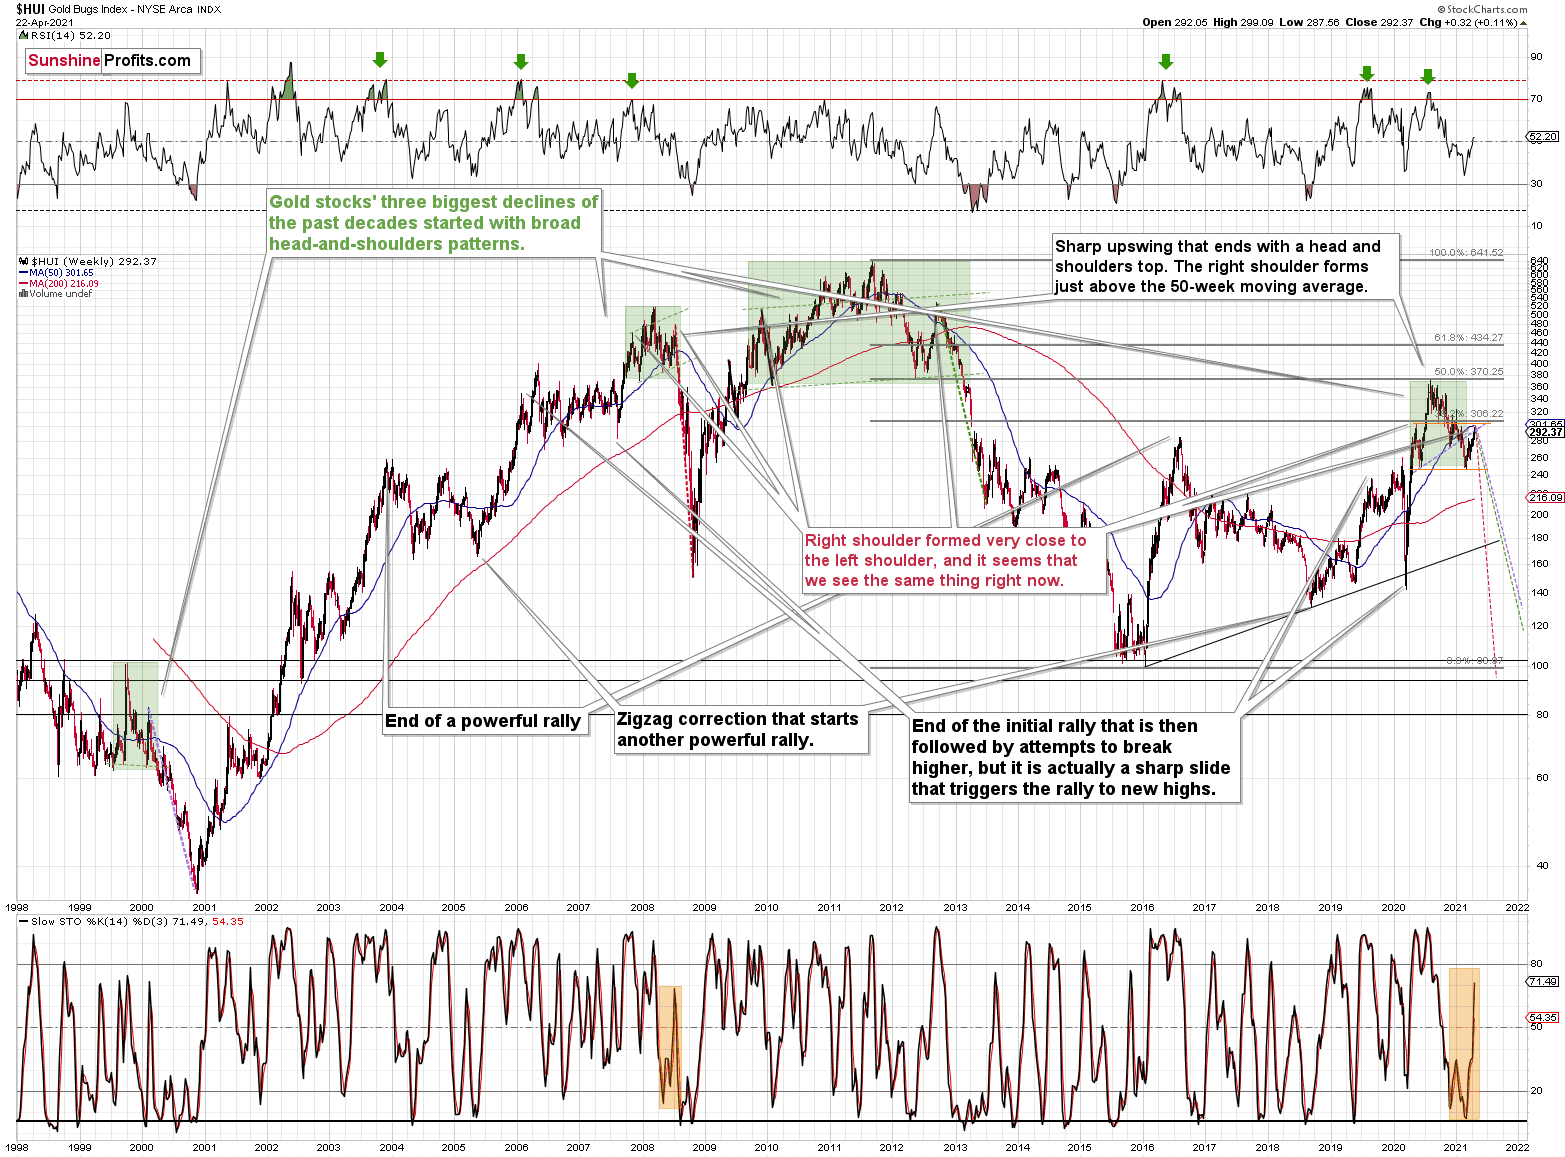
Please note that the 2007 – 2008 and the 2009 – 2012 head and shoulders pattern didn’t have the right shoulders all the way up to the line that was parallel to the line connecting the bottoms. I marked those lines with green in the above-mentioned formations. In the current case, I marked those lines with orange.
Now, even though the above wasn’t the case, in both cases, the final top – the right shoulder formed close to the price where the left shoulder topped. The left shoulder that formed in early 2020 topped at 303.02.
I previously wrote that it wouldn’t be surprising to see a move to about 300 in the HUI Index, and that’s exactly what we saw – this week’s high was slightly above 299.
This means that the recent rally is not a game-changer, but rather a part of a long-term pattern that’s not visible when one focuses on the short-term only.
The thing is that the vast majority of individual investors and – sadly – quite many analysts focus on the trees while forgetting about the forest. During the walk, this might result in getting lost, and the implications are no different in the investment landscape.
From the day-to-day perspective, a weekly – let alone monthly – rally seems like a huge deal. However, once one zooms out and looks at the situation from a broad perspective, it’s clear that:
What has been will be again, what has been done will be done again; there is nothing new under the sun. (-Ecclesiastes 1:9)
The rally is very likely the right shoulder of a broad head and shoulders formation. “Very likely” and not “certainly”, because the HUI Index needs to break to new yearly lows in order to complete the pattern – for now, it’s just potential. However, given the situation in the USD Index (i.a. the positions of futures traders as seen in the CoT report, and the technical situation in it), it seems very likely that this formation will indeed be completed. Especially when (not if) the general stock market tumbles.
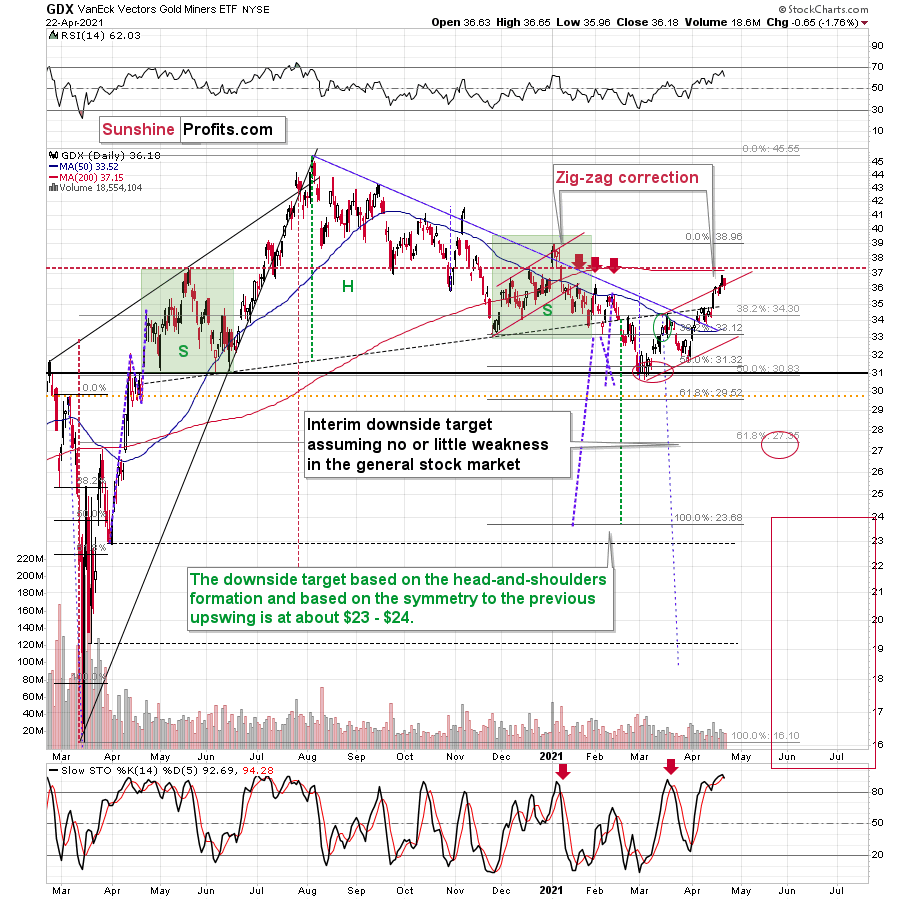
As far as the GDX ETF is concerned, I previously wrote that it could move slightly above $37, and even if it did, it would not invalidate the broad head and shoulders pattern. Well, GDX didn’t move to $37, but it was quite near doing so. It was close enough for this rally to be very similar to what we saw in May, 2020.
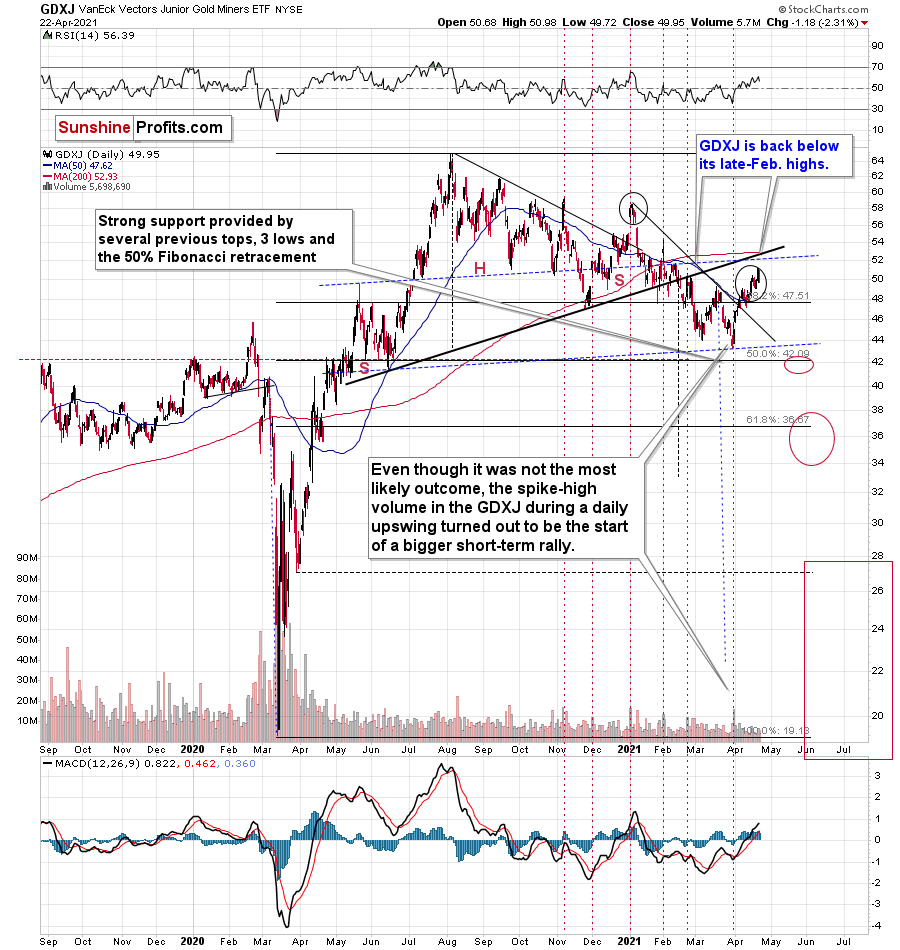
The GDXJ – a proxy for junior mining stocks – declined yesterday, and it’s now back below its late-Feb. highs - please note how weak it remains relative to other proxies for mining stocks. Unlike the HUI or the GDX, the GDXJ didn’t move visibly above its late-Feb. highs and it had already invalidated this small breakout.
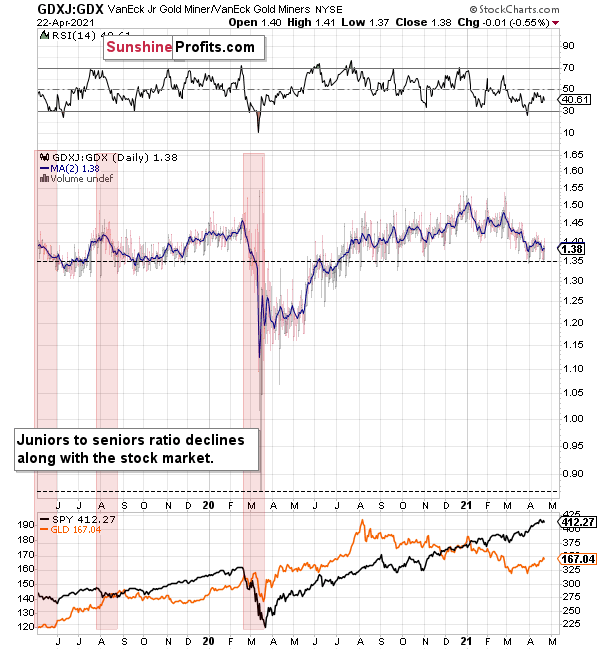
The ratio between the two ETFs has been declining since the beginning of the year, which is remarkable because the general stock market hasn’t plunged yet. This tells us that when stocks finally slide, the ratio is likely to decline in a truly profound manner – perhaps similarly to what we saw last year.
Now, as far as gold is concerned, we saw a move lower after an attempt to rally above the psychologically-important (due to being a round number) $1,800 level and the 300-day moving average (at $1,801.39).
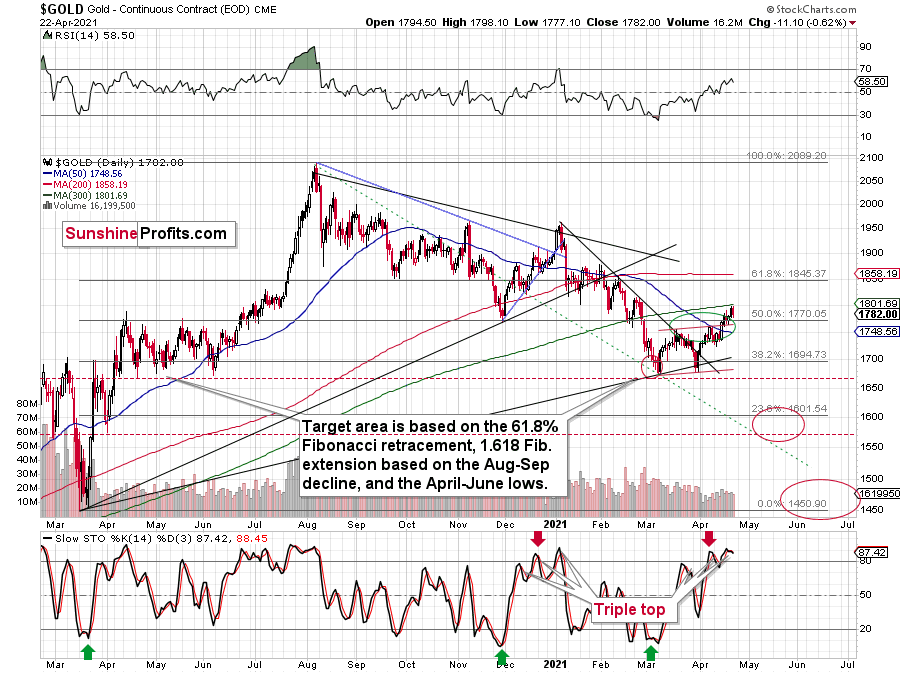
The sell signal in the stochastic indicator continues to signal that gold is about to move much lower – just like it did in early 2021.
This perfectly fits the scenario in which the HUI Index will start to decline soon, thus completing the broad head and shoulders formation so similar to the patterns that triggered the massive 2008 and 2013 slides.
Interestingly, gold didn’t rally today despite the pre-market lowering in the USD Index, which suggests that the top might have already been formed.
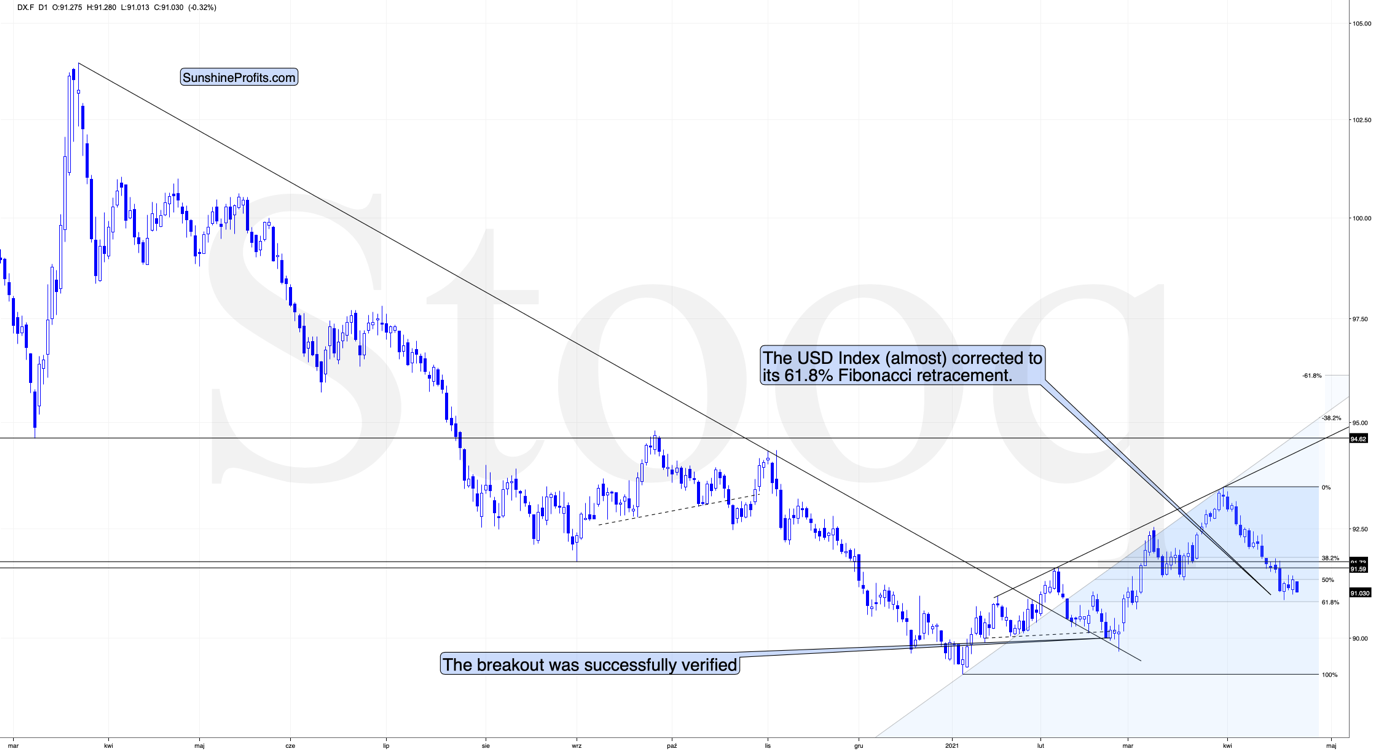
Indeed, the USD Index declined once again, and traders likely thought that the short-term correction was over, so they got back in the sell-USDX mood. However, the 61.8% Fibonacci retracement was not broken, and, consequently, it’s likely to stop the current attempt to move lower once again.
Please note that during the previous important short-term bottom – in late Feb. 2021 – the USD Index’s bottom took a few days and ended with a very brief – intraday – slide. This was the thing that triggered the next big upswing in the USDX, and the sizable downswing in the PMs. This time the following rally is likely to be even bigger.
I wouldn’t be surprised to see this week end without any major reversal, but we could see one on Monday. Some traders won’t be able to adjust their stop-loss levels at that time, so if anyone “big” wants to squeeze the profits out of individual traders shorting the USDX before the latter rallies, it would be a perfect time. The idea could be to trigger a small sell-off early on Monday, which would then trigger stop-loss selling, and it would allow the “big” market participant to re-enter the long positions at lower prices. I’m not saying that it’s the most likely scenario, though, only that it wouldn’t surprise me to see something like that.
Having said that, let’s take a look at the markets from a more fundamental angle:
The Ball Is In Your Court
With a late-afternoon freak-out on Apr. 22 – incited by U.S. President Joe Biden’s rumored increase in the region’s capital gains tax – ushering gold back below $1,790, investors’ ‘get me out of here’ attitude was the first real bout of volatility that we’ve witnessed in over a month.
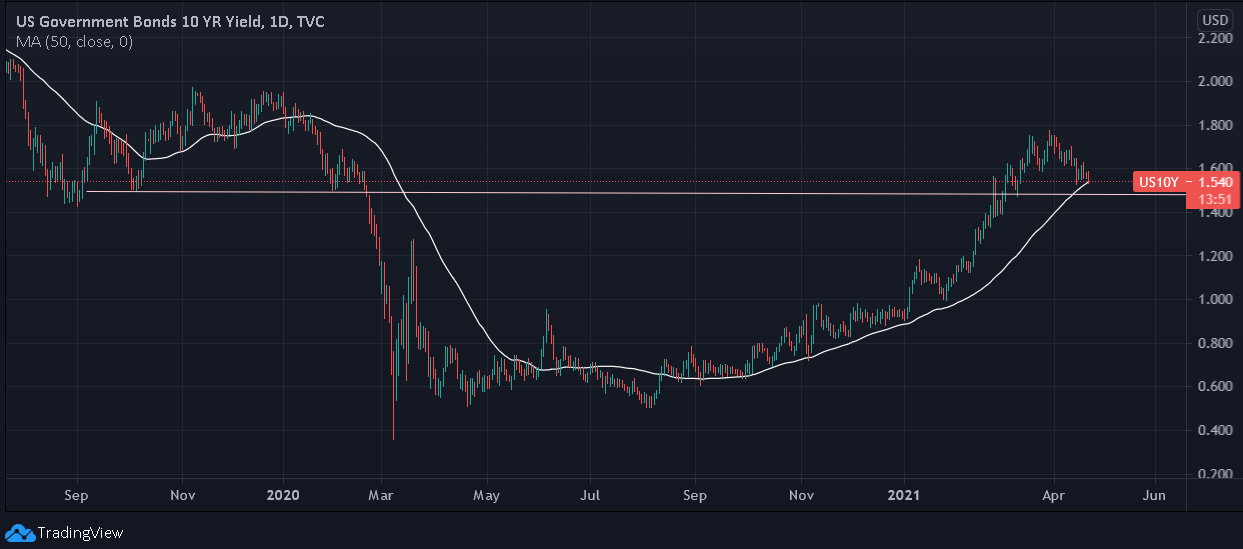
However, while Biden’s new-found fondness for austerity garnered all of the headlines, a slightly more important event was already unfolding. Case in point: despite the weakness in U.S. equities causing a bid for U.S. Treasuries, the U.S. 10-Year Treasury yield still managed to hold its 50-day moving average (MA). Moreover, with the October 2019 and January 2020 lows not far behind, the U.S. 10-Year Treasury yield may be only five basis points away from forming a lasting bottom.
Please see below:
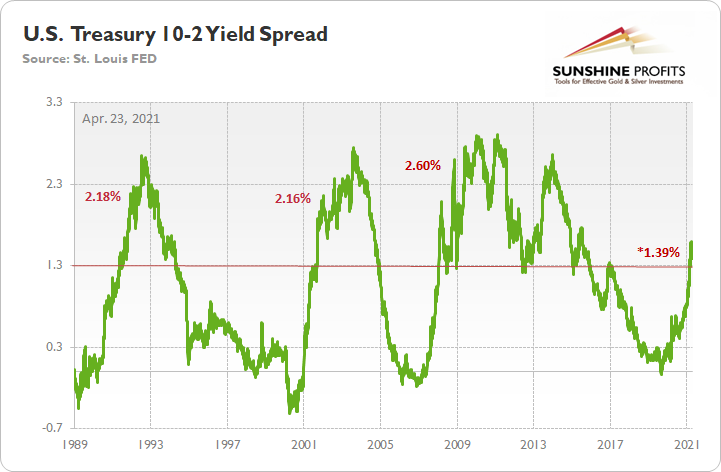
Along for the ride, the U.S. Treasury 10-2 spread fell to 1.39% on Apr. 22. More importantly, though, the milestone marks a 20-basis-point decline from its March peak, and if the bottom is in, the duration from peak to trough has reached 18 trading days.
Please see below:
To explain the significance, I wrote on Apr. 20:
When the green line above is rising, it means that the U.S. 10-Year Treasury yield is increasing at a faster pace or declining at a slower pace than the U.S. 2-Year Treasury yield. Conversely, when the green line above is falling, it means that the U.S. 2-Year Treasury yield is increasing at a faster pace or declining at a slower pace than the U.S. 10-Year Treasury yield.
If you analyze the horizontal red line, 1.30% is where historical roads got a little rocky. However, after recording a major bottom, rallying above 1.30% and then suffering a meaningful correction, the 10-2 spread proceeded to rally to 2.18% (1991), 2.16% (2002) and 2.60% (2008) before suffering a second meaningful correction.
Moreover, the behavior of the 10-2 spread in 1991 and 2001/2002 is nearly identical to the current behavior: after reaching an interim peak in 1991, the 10-2 spread declined by 26 basis points over a 24-day stretch. Likewise, in 2001, the 10-2 spread declined by 20 basis points over a 17-day stretch. Conversely, the 10-2 spread followed its 1991 swoon by rallying by 80 basis points over the following 57 days. Similarly, the 10-2 spread followed its 2001 swoon by rallying by 105 basis points over the following 97 days (into 2002).
Thus, with the 10-2 spread’s current behavior mirroring 2001, a bottom could be imminent. Moreover, while the 1991 analogue implies immaterial weakness continuing into next week, whenever the 10-2 spread officially bottoms, historical precedent implies that we’ll see a significant rally off of the lows. Furthermore, while an equity rout has the potential to disrupt the timeline – as a safe-haven bid for U.S. Treasuries often coincides with meaningful stock market pullbacks – the PMs are unlikely to elicit strength once the equity market falters.
The bottom line? Once the U.S. 10-Year Treasury yield forms a medium-term bottom, expect the PMs to form a medium-term top.
And why is that?
Well, gold and the U.S. 10-Year Treasury yield have demonstrated an inverse relationship for quite some time. Case in point: back in October 2018, the yellow metal’s bottom occurred alongside the U.S. 10-Year Treasury yield’s top. Similarly, in August 2020, the yellow metal’s top occurred alongside the U.S. 10-Year Treasury yield’s bottom.
Please see below:
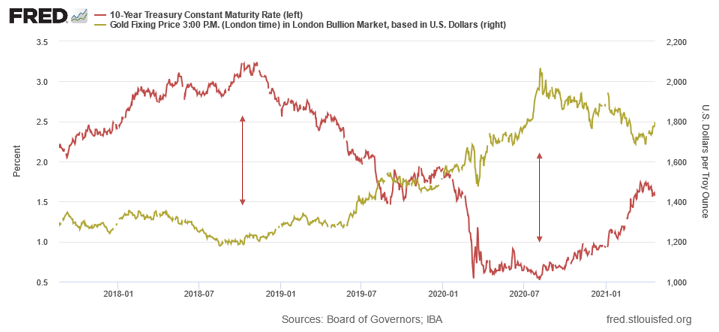
In addition, if you analyze the right side of the chart, you can see that battle lines have officially been drawn. With gold moving higher amid the U.S. 10-Year Treasury yield’s recent consolidation, the yellow metal has exuded confidence. However, with the current divergence occurring at a time when gold is near its historical highs and the U.S. 10-Year Treasury yield is near its historical lows, August’s reversal of fortunes is likely far from over.
But what’s stopping the U.S. 10-Year Treasury yield from moving lower?
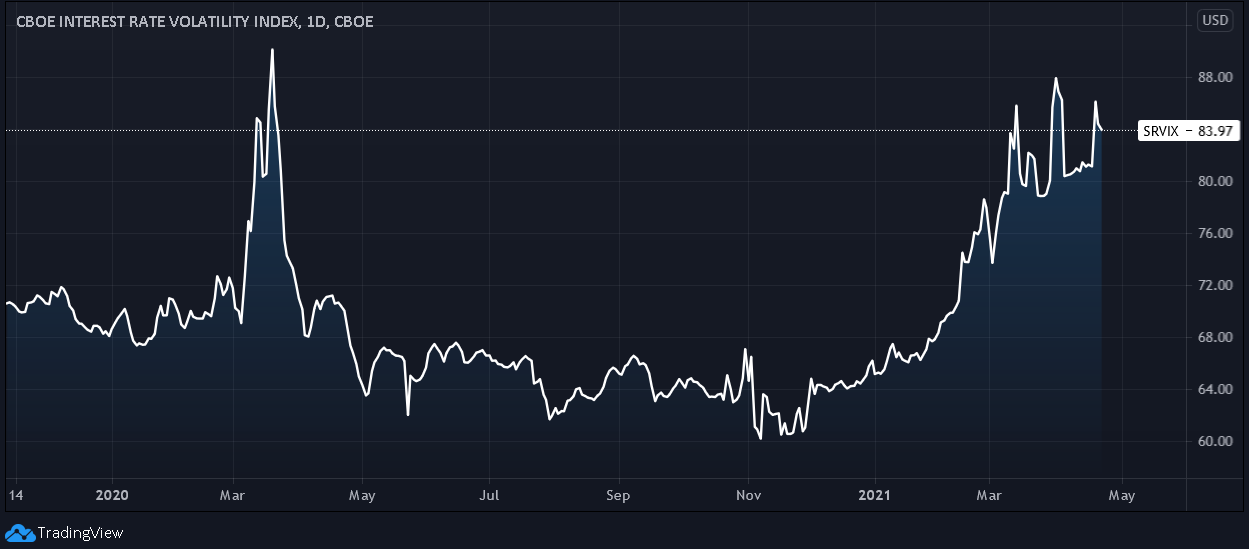
Well, adding to the historical precedent that I already outlined above, the Cboe Interest Rate Swap Volatility Index (SRVIX) remains on high alert. After surging by another 6.14% on Apr. 20, the SRVIX has barely come down from the recent spike.
Please see below:
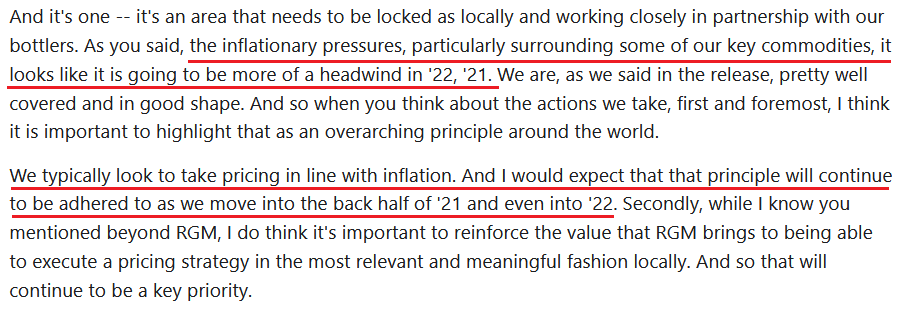
And with Coca-Cola announcing on Apr. 19 that the company will raise prices to offset higher commodity costs, I warned on Apr. 20 that inflation jitters are unlikely to abate anytime soon.
I wrote:
When asked about the company’s response to the inflationary pressures – during Coca-Cola’s first-quarter earnings call on Apr. 19 – CFO John Murphy had this to say:
 Source: Coca-Cola/The Motley Fool
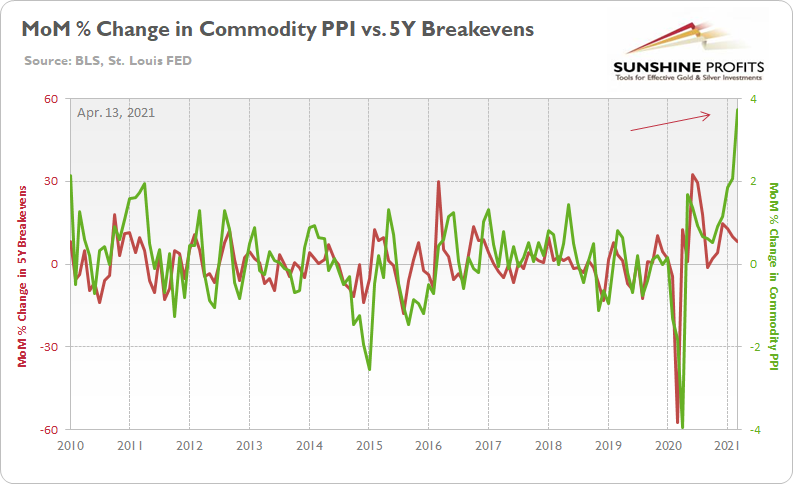
So let’s connect the dots: commodity inflation has surged and Murphy expects “pricing in line with inflation.” As a result, doesn’t the 5-Year breakeven inflation rate look more and more like a sleeping giant?
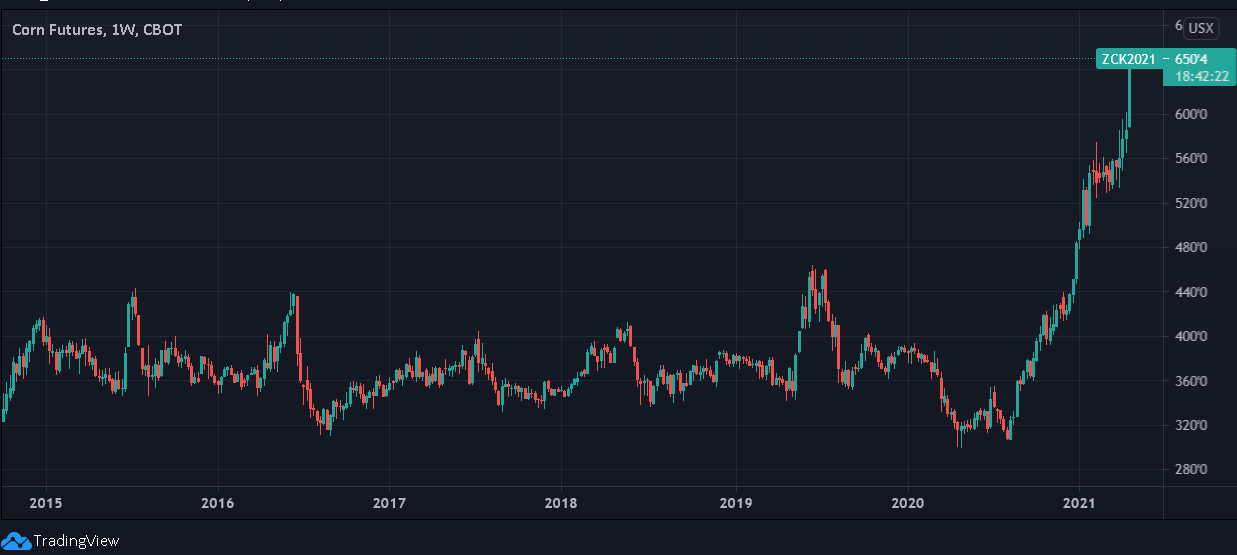
If that wasn’t enough, with lumber futures hitting ‘limit up’ on Apr. 19 – meaning that the contract rose so rapidly that regulators were forced to suspend trading for the day – we’ve witnessed a more than 50% rise in less than four months. But not to be outdone, corn futures have already surged by more than 11% this week (as of the Apr. 22 close).
Please see below:
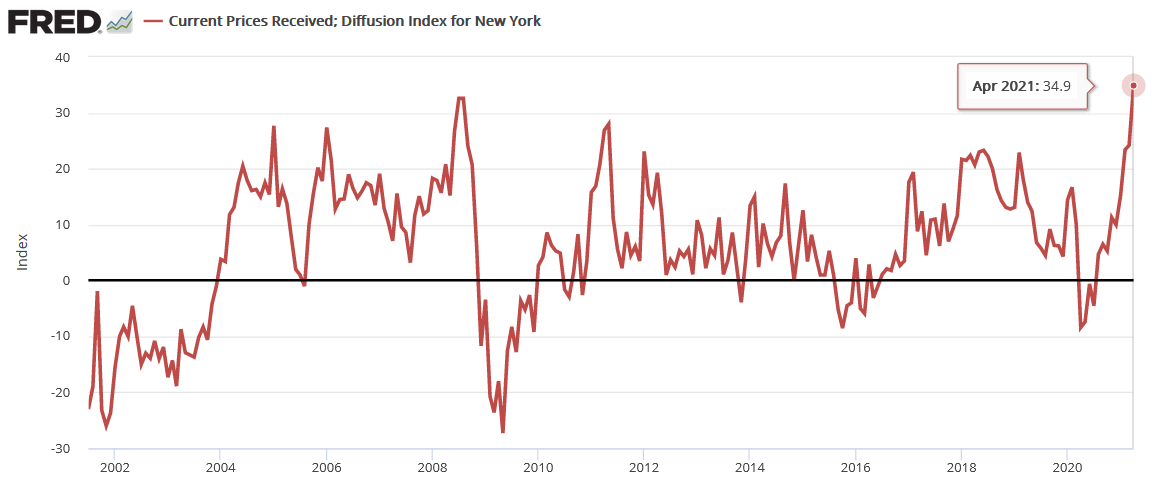
Continuing the theme, the Empire State Manufacturing Survey – a monthly survey of business conditions conducted by the New York Federal Reserve (FED) – revealed that not only are manufacturers’ input costs rising, but their output prices have hit an all-time high.
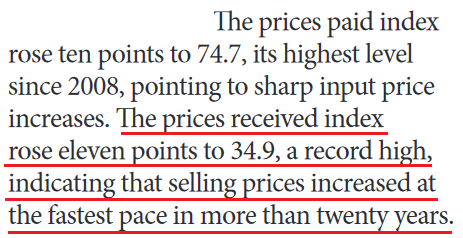 Source: New York FED
Furthermore, if you analyze the chart below, you can see that the record print is sharply higher than any other comparable reading since the Global Financial Crisis (GFC).
And looking to front-run the action, clients of JPMorgan have pushed their U.S. 10-Year Treasury short positions to their highest level since 2018.
Please see below:
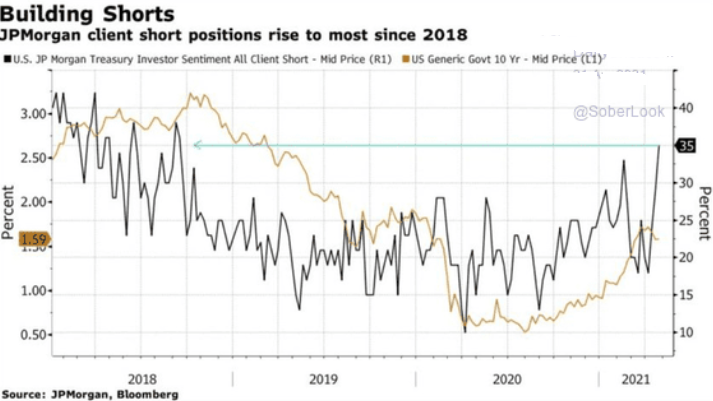
To explain, the brown line above tracks the U.S. 10-Year Treasury yield (the mid-price), while the black line above tracks the proportion of JPMorgan’s clients that short the U.S. 10-Year Treasury. If you analyze the right side of the chart, you can see that even amid the U.S. 10-Year Treasury yield’s recent consolidation, JPMorgan’s clients have been aggressively adding to their short positions.
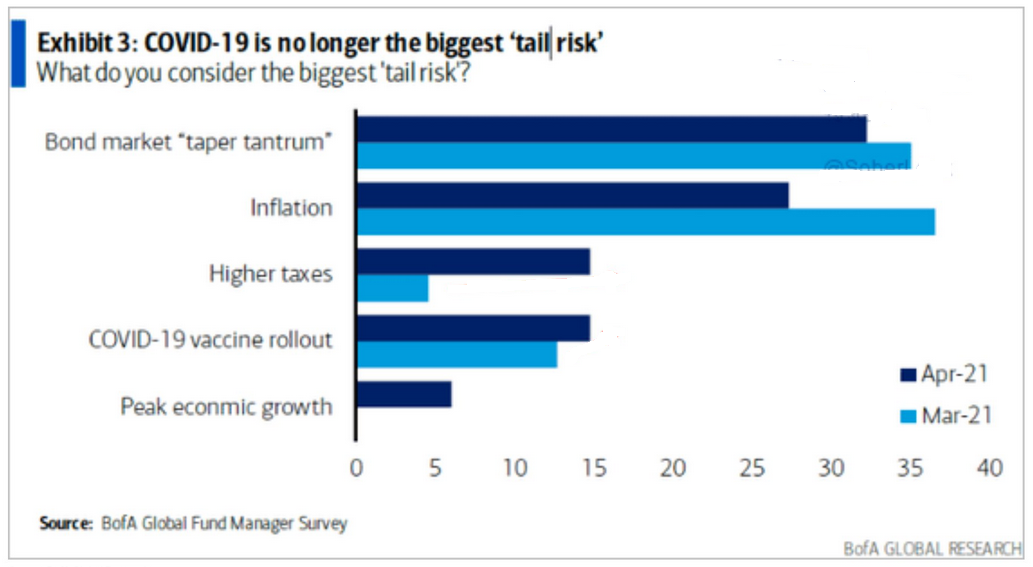
Furthermore, with Bank of America’s latest Global Fund Manager Survey revealing what we already know, institutional investors remain increasingly fearful of a bond market sell-off. With inflation fears and a potential taper tantrum still accounting for roughly 60% of what keeps institutional investors up at night, if the prospect unfolds, the PMs won’t be the only assets affected by the unwind.
In conclusion, while Thursday (Apr. 22) afternoon was quite entertaining, the PMs’ fireworks have yet to begin. With the USD Index catching a bid on Apr. 22 and the U.S. 10-Year Treasury yield already aligning with technical and historical support, the road ahead for the PMs could become increasingly treacherous. Furthermore, while the European Central Bank’s (ECB) Thursday meeting was largely uneventful, The Governing Council said that PEPP purchases are still going to be “conducted at a significantly higher pace than during the first months of the year.” Thus, despite the EUR/USD’s muted reaction, the ‘same old, same old’ remains USD bullish, as relative outprinting and Eurozone-U.S. growth differentials should weigh on the currency pair over the medium term. As a result, the USD Index is poised to be the main beneficiary, while the PMs will likely be stuck with the short end of the stick.
Overview of the Upcoming Part of the Decline
- It seems likely to me that the corrective upswing was already completed or that it will be completed this week. Consequently, it seems that the next big move lower is already underway or about to start.
- After miners slide once again in a meaningful and volatile way, but silver doesn’t (and it just declines moderately), I plan to switch from short positions in miners to short positions in silver (this could take another 1-2 weeks to materialize). I plan to exit those short positions when gold shows substantial strength relative to the USD Index, while the latter is still rallying. This might take place with gold close to $1,450 - $1,500 and the entire decline (from above $1,700 to about $1,475) would be likely to take place within 1-12 weeks, and I would expect silver to fall hardest in the final part of the move. This moment (when gold performs very strongly against the rallying USD and miners are strong relative to gold – after gold has already declined substantially) is likely to be the best entry point for long-term investments, in my view. This might happen with gold close to $1,475, but it’s too early to say with certainty at this time. In other words, the entire decline could take between 1 and 12 weeks, with silver declines occurring particularly fast in the final 1-2 weeks.
- If gold declines even below $1,500 (say, to ~$1350 or so), then it could take another 10 weeks or so for it to bottom, but this is not what I view as a very likely outcome.
- As a confirmation for the above, I will use the (upcoming or perhaps we have already seen it?) top in the general stock market as the starting point for the three-month countdown. The reason is that after the 1929 top, gold miners declined for about three months after the general stock market started to slide. We also saw some confirmations of this theory based on the analogy to 2008. All in all, the precious metals sector would be likely to bottom about three months after the general stock market tops. If the mid-February 2020 top was the final medium-term top (based on NASDAQ’s top, then it seems that we might expect the precious metals sector to bottom in mid-May or close to May’s end. If, however, the upcoming (unless we just saw one) top in the S&P 500 is the key one, then it seems that we’re at least ~3 months from the final bottom.
- The above is based on the information available today, and it might change in the following days/weeks.
Please note that the above timing details are relatively broad and “for general overview only” – so that you know more or less what I think and how volatile I think the moves are likely to be – on an approximate basis. These time targets are not binding or clear enough for me to think that they should be used for purchasing options, warrants or similar instruments.
Summary
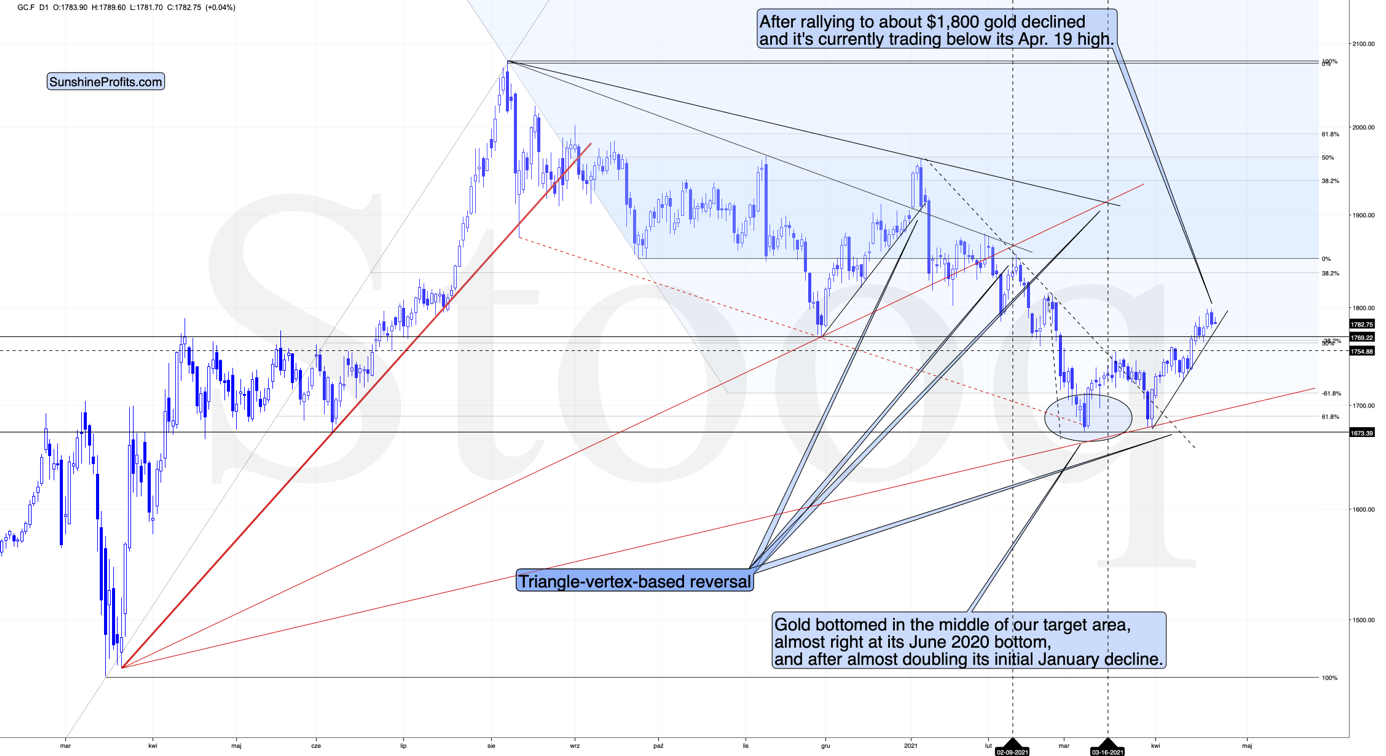
To summarize, the PMs’ medium-term decline is well underway, and based on the recent performance of the USD Index, gold and mining stocks, it seems that the corrective upswing is close to being over. Based on gold’s triangle-vertex-based reversal, it seems that we saw the initial top on April 8, and it seems that – based on gold stocks’ analogy to the previous broad head-and-shoulders patterns -the final top is about to be in, or it’s already in. Please note that while the medium-term trend remains down, it’s not out of the question that the market will form the final reversal early next week - perhaps on Monday (Apr. 26). The key thing here is that the really big move seems very close to starting, and when it does start, the recent upswing will likely seem to have been nothing more than a blip on the radar screen.
In addition, because we’re likely entering the “winter” part of the Kondratiev cycle (just like in 1929 and then the 1930s), the outlook for the precious metals’ sector remains particularly bearish during the very first part of the cycle, when cash is king.
The confirmed breakout in the USD Index is yet another confirmation of the bearish outlook for the precious metals market.
After the sell-off (that takes gold to about $1,450 - $1,500), we expect the precious metals to rally significantly. The final part of the decline might take as little as 1-5 weeks, so it's important to stay alert to any changes.
Most importantly, please stay healthy and safe. We made a lot of money last March and it seems that we’re about to make much more on this March decline, but you have to be healthy to enjoy the results.
As always, we'll keep you - our subscribers - informed.
By the way, we’re currently providing you with a possibility to extend your subscription by a year, two years or even three years with a special 20% discount. This discount can be applied right away, without the need to wait for your next renewal – if you choose to secure your premium access and complete the payment upfront. The boring time in the PMs is definitely over and the time to pay close attention to the market is here. Naturally, it’s your capital, and the choice is up to you, but it seems that it might be a good idea to secure more premium access now, while saving 20% at the same time. Our support team will be happy to assist you in the above-described upgrade at preferential terms – if you’d like to proceed, please contact us.
To summarize:
Trading capital (supplementary part of the portfolio; our opinion): Full speculative short positions (300% of the full position) in mining stocks are justified from the risk to reward point of view with the following binding exit profit-take price levels:
Mining stocks (price levels for the GDXJ ETF): binding profit-take exit price: $24.12; stop-loss: none (the volatility is too big to justify a stop-loss order in case of this particular trade)
Alternatively, if one seeks leverage, we’re providing the binding profit-take levels for the JDST (2x leveraged) and GDXD (3x leveraged – which is not suggested for most traders/investors due to the significant leverage). The binding profit-take level for the JDST: $39.87; stop-loss for the JDST: none (the volatility is too big to justify a SL order in case of this particular trade); binding profit-take level for the GDXD: $94.87; stop-loss for the GDXD: none (the volatility is too big to justify a SL order in case of this particular trade).
For-your-information targets (our opinion; we continue to think that mining stocks are the preferred way of taking advantage of the upcoming price move, but if for whatever reason one wants / has to use silver or gold for this trade, we are providing the details anyway.):
Silver futures upside profit-take exit price: unclear at this time - initially, it might be a good idea to exit when gold moves to $1,512.
Gold futures upside profit-take exit price: $1,512.
Long-term capital (core part of the portfolio; our opinion): No positions (in other words: cash
Insurance capital (core part of the portfolio; our opinion): Full position
Whether you already subscribed or not, we encourage you to find out how to make the most of our alerts and read our replies to the most common alert-and-gold-trading-related-questions.
Please note that we describe the situation for the day that the alert is posted in the trading section. In other words, if we are writing about a speculative position, it means that it is up-to-date on the day it was posted. We are also featuring the initial target prices to decide whether keeping a position on a given day is in tune with your approach (some moves are too small for medium-term traders, and some might appear too big for day-traders).
Additionally, you might want to read why our stop-loss orders are usually relatively far from the current price.
Please note that a full position doesn't mean using all of the capital for a given trade. You will find details on our thoughts on gold portfolio structuring in the Key Insights section on our website.
As a reminder - "initial target price" means exactly that - an "initial" one. It's not a price level at which we suggest closing positions. If this becomes the case (like it did in the previous trade), we will refer to these levels as levels of exit orders (exactly as we've done previously). Stop-loss levels, however, are naturally not "initial", but something that, in our opinion, might be entered as an order.
Since it is impossible to synchronize target prices and stop-loss levels for all the ETFs and ETNs with the main markets that we provide these levels for (gold, silver and mining stocks - the GDX ETF), the stop-loss levels and target prices for other ETNs and ETF (among other: UGL, GLL, AGQ, ZSL, NUGT, DUST, JNUG, JDST) are provided as supplementary, and not as "final". This means that if a stop-loss or a target level is reached for any of the "additional instruments" (GLL for instance), but not for the "main instrument" (gold in this case), we will view positions in both gold and GLL as still open and the stop-loss for GLL would have to be moved lower. On the other hand, if gold moves to a stop-loss level but GLL doesn't, then we will view both positions (in gold and GLL) as closed. In other words, since it's not possible to be 100% certain that each related instrument moves to a given level when the underlying instrument does, we can't provide levels that would be binding. The levels that we do provide are our best estimate of the levels that will correspond to the levels in the underlying assets, but it will be the underlying assets that one will need to focus on regarding the signs pointing to closing a given position or keeping it open. We might adjust the levels in the "additional instruments" without adjusting the levels in the "main instruments", which will simply mean that we have improved our estimation of these levels, not that we changed our outlook on the markets. We are already working on a tool that would update these levels daily for the most popular ETFs, ETNs and individual mining stocks.
Our preferred ways to invest in and to trade gold along with the reasoning can be found in the how to buy gold section. Furthermore, our preferred ETFs and ETNs can be found in our Gold & Silver ETF Ranking.
As a reminder, Gold & Silver Trading Alerts are posted before or on each trading day (we usually post them before the opening bell, but we don't promise doing that each day). If there's anything urgent, we will send you an additional small alert before posting the main one.
Thank you.
Przemyslaw Radomski, CFA
Founder, Editor-in-chief

