

Briefly: in our opinion, full (250% of the regular size of the position) speculative short position in gold, silver, and mining stocks is justified from the risk/reward point of view at the moment of publishing this Alert.
The Brexit saga continues with no clear and irreversible decisions. Over the weekend, the can was kicked down the road again (and again appears on the menu today), but we doubt that anything major will change. What may be surprising to some, this doesn't mean that we don't have any new signals. Actually, we do. The way gold (hasn't) reacted to sharply lower USD values and the UK turmoil in general, tells a lot about the next big move brewing.
Let's start with a quote from Friday's Alert:
As said, the announced Brexit deal was behind yesterday's volatility. But it isn't over yet as Boris Johnson has to get it through the Parliament first. And the odds are that the vote will not go in his favor. As Bloomberg reports:
"If he is to win Saturday's vote, Johnson needs to secure the support of Northern Ireland's Democratic Unionist Party, which has categorically opposed the agreement he reached with the European Union on Wednesday. He is also seeking to woo reluctant members of his own side, and persuade opposition Labour politicians to back him, if he is to prevail."
Securing the support of the party that categorically opposed this agreement doesn't seem likely at all. The market moved yesterday and the USD Index fell, but there was no real basis for that. The stagnation regarding Brexit seems to be so severe and so little happened in the previous months that yesterday's no-news news seems like a game changer. But just because a turkey is noticeably different and bigger than a chicken, it doesn't make it an ostrich. The difference between the previous stagnation and yesterday's news is noticeable, but it's not the game-changer it's portrayed to be. The USD Index reacted to the ostrich-like scare, but it seems that the market will soon realize that what we have here is the chicken that just got a few extra feathers.
Let's see what the U.S. currency did exactly.
The USD Index Gyrations
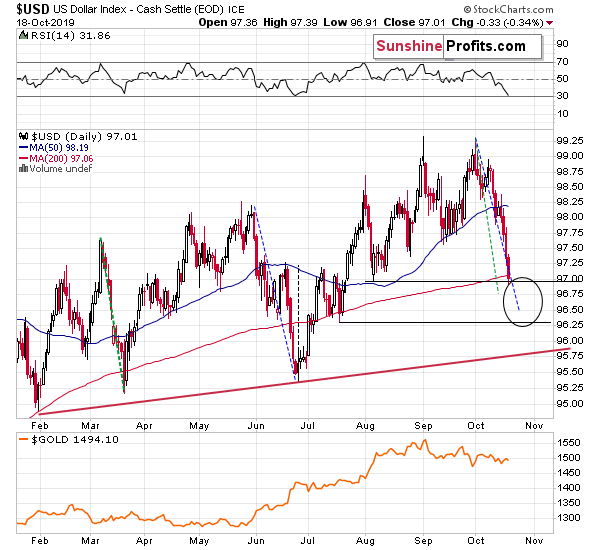
In Friday's analysis, we featured two support levels and the upper of them was reached on Friday. This means that the bottom in the USDX might already be in right now. However, it might also be the case that the USDX declines to about 96.3 before rallying first. A sustainable move below 96.3 seems very unlikely. We explained how we determined these two bottoming targets on Friday, so we'll quote what we wrote:
The USDX just moved below the September and late-August lows, closing below them. This breakdown opens the way to further declines, so the question becomes how far can the USDX slide. It seems that not much. The index has been trading in a specific manner in the previous months and nothing suggests that this short-term correction is going to be anything bigger than the previous ones.
We copied the previous declines (marked with green and blue) to the current situation and it clear that if the USD Index was to match these moves than it could decline some more, but the size of this move is not likely to be huge.
The nearest support levels are provided by the previous lows and the 200-day moving average. The upper target is at about 97 and the lower target is at about 96.3. There's also the rising red support line a bit below 96, but it's highly unlikely that the USD Index would drop as low.
There's also another line that's not visible on the previous chart and it's the blue line based on i.a. the mid-2018 low. It's a bit above 96, so it strengthens the support provided by the mid-July 2019 low.
So, in the more bullish scenario, USDX could rally once bottoming close to 97, and in the less bullish scenario it could rally once bottoming close to 96.3. In case of the former, the decline would be smaller than the March 2019 decline, and in case of the latter, the decline would be a bit bigger than the May - June 2019 decline. Both scenarios seem possible, but the bottom at 97 is more probable in our view.
The scenario in which the USDX breaks below 96 and continues to fall for weeks is very unlikely in our view, given the resilience that the U.S. currency has been consistently showing in the previous months in light of bearish news like Trump calling for a lower dollar or significantly lower interest rates.
Now, why are we describing the USD Index instead of starting the analysis with gold, silver, or mining stocks? Because the U.S. currency is likely the factor preventing the slide from continuing. In the previous months, when the USD declined, gold rallied. Now, it's just verifying the breakdown below $1,500. The short-term trend has definitely changed. However, as long as the USDX keeps declining, the gold market and the rest of the PM sector may have a difficult time launching a powerful slide.
This has no actionable implications for our short positions, because the possible rally is likely to be very limited (or perhaps it's already over), but it serves as a good reply to the "how long do we have to wait now" question.
Perhaps we will have to wait just until Monday. The failure to confirm the Brexit deal during the Saturday vote could immediately reverse USD's decline. Or we might need to wait for a few extra days before the support levels are reached which would then trigger the reversal. All in all, the decline in the precious metal sector could accelerate as early as on Monday, but even if it doesn't, we most likely won't have to wait for long, anyway.
Friday's action in the USD Index and in the precious metals sector confirm the above bold text. The reaction to USD's decline was very weak. Let's take a closer look.
Friday in PMs
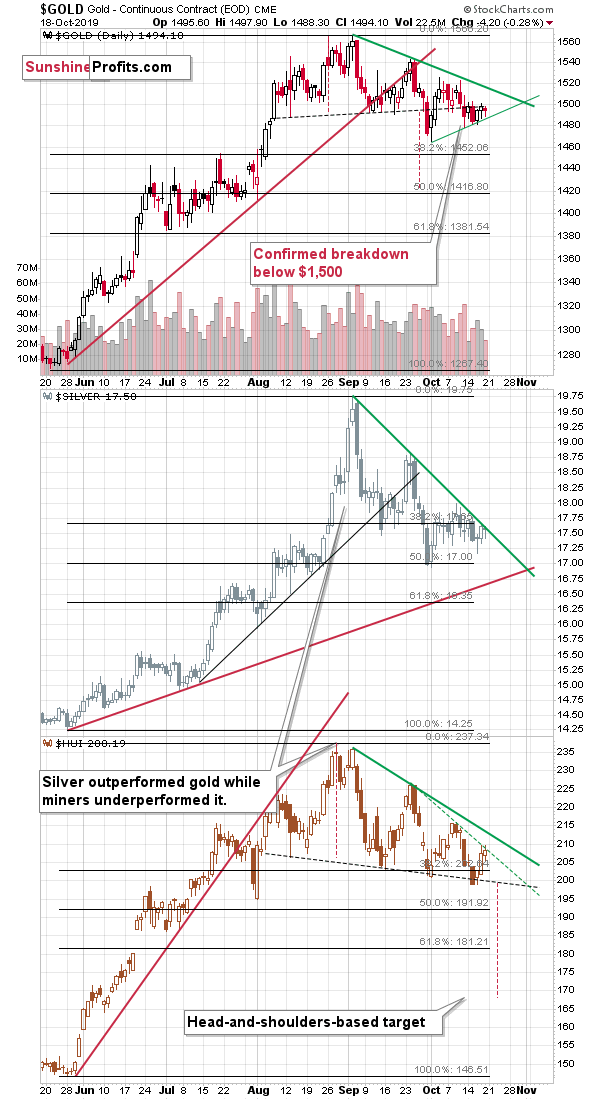
Despite USD's move lower, gold was actually down by a few dollars (closing the week below $1,500), which is incredibly bearish on a short-term basis. Silver, and gold stocks didn't move much either. Neither of them rallied above their respective resistance lines, which is what one might expect given USD's short-term weakness.
If anyone still had doubts where the precious metals sector wants to move now, the above lack of action should erase them.
Moreover, our comments on the next reversal date remain up-to-date:
Moreover, please note that the above chart features three short-term triangle-vertex-based reversals in early November. The support and resistance lines for gold, silver and mining stocks all cross at practically the same time. Consequently, if the PMs break lower shortly, it will likely mean that the next short-term bottom takes place in about two weeks.
There's one more thing that we would like to show you about the mining stocks.
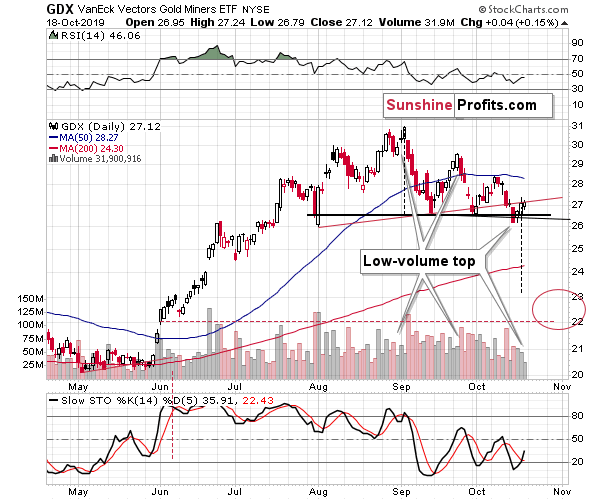
It's the volume. It was very small on Friday and the volume on which the GDX moved higher was generally low in the last few days. We saw something very similar twice in the last couple of weeks. Namely, it was how miners topped. The lack of buying power made it clear that the bulls will have to wait much longer for higher PM prices and we see the same kind of thing right now. The implications are bearish.
Silver rallied in today's pre-market trading, and it broke above its rising short-term resistance line, but let's keep in mind that silver is known for such fake moves right before plunging. Neither gold, nor mining stocks confirm any strength here, so it's very unlikely that silver indicates anything major.
We will get back to the topic of mining stocks a bit later, and before we do, we would like to show you what gold is doing in terms of the British pound.
After all, given the Brexit-related turmoil one would expect gold to rally in terms of the British currency as people (can be expected to) purchase safer alternatives to the pound.
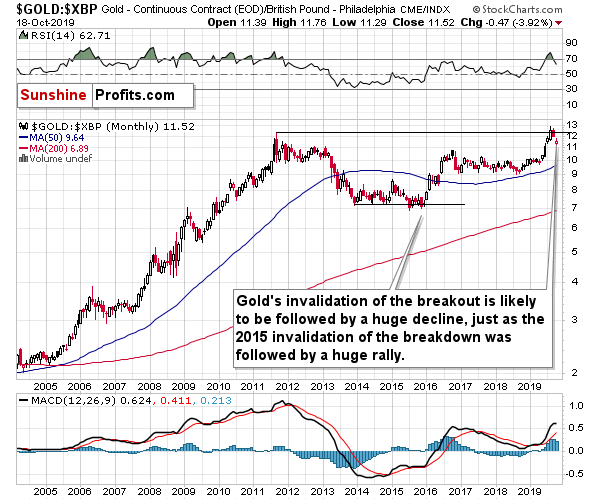
It's simply not happening. Instead of soaring in the recent days, gold invalidated the breakout above the 2011 highs. This is an extremely bearish event for the following months. The opposite of breakout's invalidation is breakdown's invalidation and we saw it in the late 2015. It was followed by a huge rally even though the price level below which gold broke back then was not as significant as the 2011 high is. This means that the implications now are even stronger.
Having said that, we would like to follow-up with the discussion of our Wednesday long-term analysis of gold mining stocks.
Let's start with what we wrote on Wednesday, as it remains entirely up-to-date:
So... What would you say if we told you that the gold stock history is repeating with an almost exact 20-year delay? It might raise a few eyebrows and nothing more... Until you saw the chart that shows you how precise it is and how well it fits to what happened now and what happened in 2012 as well. On to the chart, then!
The Miners' Analogy
(as a reminder, clicking on the chart will expand it)
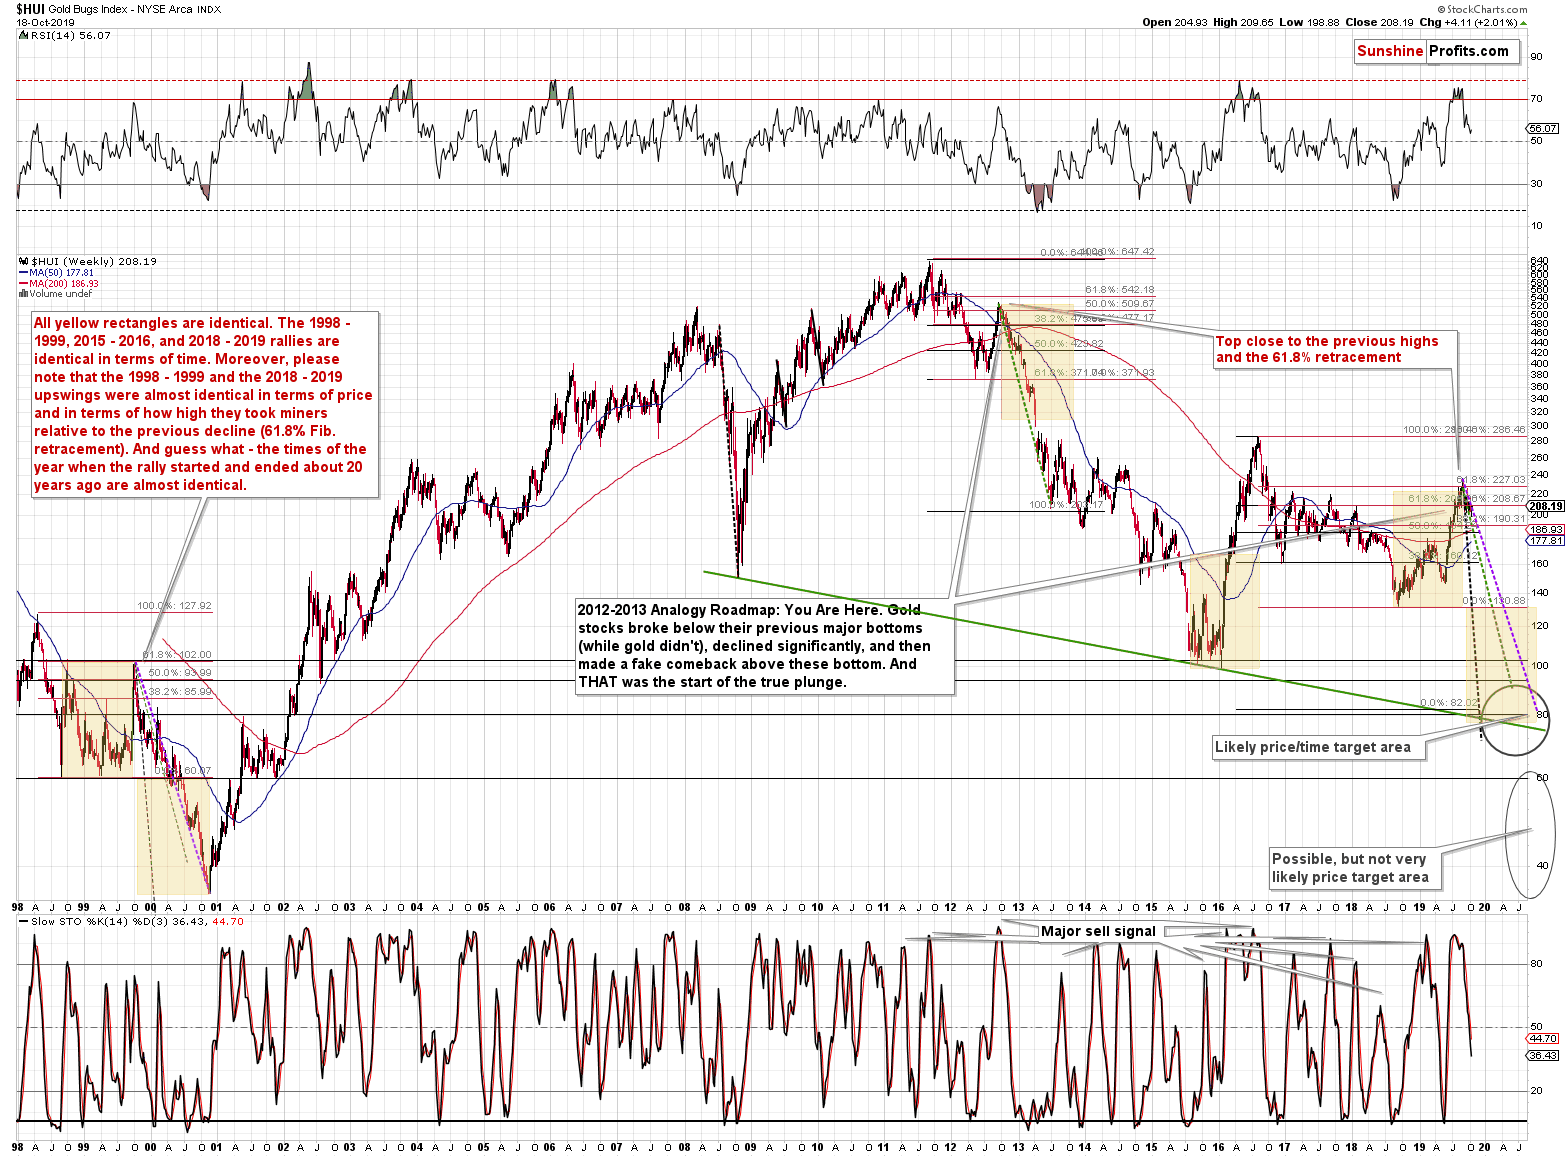
Let's start with something relatively more familiar - the Fibonacci retracements. Back in 2012, the HUI Index retraced almost 61.8% of the preceding rally before the decline continued. That was one of the reasons that we thought that the 2019 rally won't get much above this retracement, if at all. Indeed, the breakout above this retracement was very short-lived. However, this is not the only time when this retracement stopped a sizable, yet counter-trend rally before a big decline.
The 1999 top formed almost exactly at the 61.8% Fibonacci retracement. That's one similarity between what happened recently and in 2012.
The second similarity is what's so exciting about this discovery. The length of the rally. All yellow rectangles on the above chart are identical. The 1998 - 1999, 2015 - 2016, and 2018 - 2019 rallies are identical in terms of time. Most importantly, the 1998 - 1999 and the 2018 - 2019 upswings were almost identical in terms of both: time and price. And that's in addition to both rallies ending at the same Fibonacci retracement.
Let's re-state it again. Both rallies took practically the same amount of time, and the rallies were almost alike in terms of size - percentagewise.
But wait, there's more!
The times of the year when the rally started and ended about 20 years ago are almost identical as well. The 1998 rally started right after the middle of the year and the same thing happened in 2018. The rally ended in the second part of 1999 and the same was the case right now. The month is not the same, but it's so close that the gold stock seasonality might have influenced the prices in the similar way, which means that the follow-up action could be very similar.
The Follow-Up Action
Based on the way in which the previous bear market in gold stocks ended, it seems that we have about a year of lower prices ahead of us and the HUI Index will decline to or a bit below the 80 level. That's in perfect tune with the upper one of the price target areas that we've been featuring on the above chart for some time now. The key of the additional trading techniques pointing to the 80 level or its proximity as the downside target are the early 1999, and 2011 tops as well as the early 2002 bottom, and the long-term declining support line based on the 2008 and 2016 lows.
The implications extend beyond just the final target - the analogy can tell us something important about the likely corrective upswings that we'll see along the way. Some of them will be relatively small, but there will also be those that are visible even from the long-term point of view, such as the one that we saw in early 2000.
How to detect them? Let's get back to the basics. When does a price rally, even though it remains in a downtrend? When it gets too low, too fast - at least in many cases. The key follow-up question is "too low compared to what?". And that's where the analogy to the 1999 - 2000 decline comes into play.
The purple line is the line that connects the start and the end of the 1999 - 2000 decline. The green line marks the start and the end of the 2012 - 2013 decline and the black one is based on the 2008 decline. There are two rules that we can detect based on these analogies.
First, the time after which we saw corrections during longer declines is similar to the times when the quicker decline ended. The end of the black line (early 2000) is also when we - approximately - saw the first big corrective upswing during the decline. Applying the same technique to the recent top provides us with mid-December (that's in about 2 months) as the likely bottoming target date. Naturally, it's likely to be just a short-term bottom that would be followed by a corrective upswing and then even lower prices.
Second, the chance of a corrective upswing and the chance that such upswing would be significant increases dramatically when price moves visibly below the dashed line. There are 3 dashed lines to choose from - each based on a different decline - so the question is which one should be used. It seems that the middle one is appropriate as it was most useful in 2000. The 2012-2013 decline took place mostly above the dashed line that connected its starting and ending point and it didn't have profound corrective upswings until it ended. What we saw 20 years ago, however, was very different. The price declined sharply initially, but then corrected a few times and the more price moved below the declining green dashed line, the bigger the corrective upswing was.
So, if the HUI moves visibly below the declining green dashed line, it will suggest that the miners got too low too fast and are likely to bounce back up sooner rather than later.
Now, what we want to add today is that there is one other important confirmation that tells us that the recent top was just like the 1999 top.
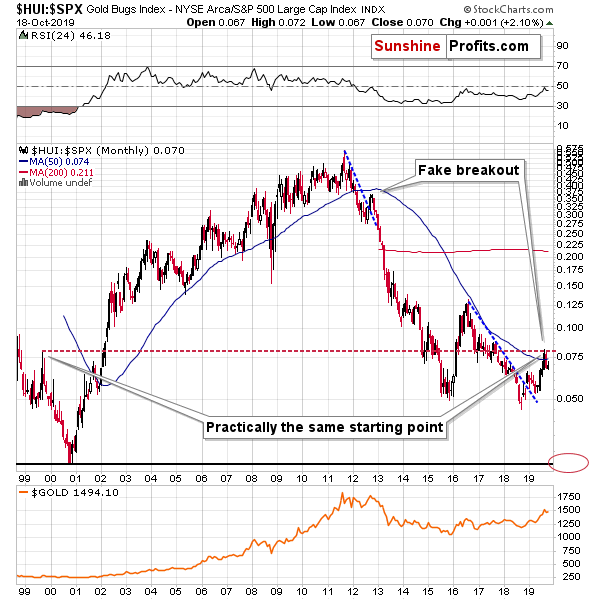
Dividing the value of the HUI Index by the value of the S&P 500 Index provides us with a ratio that shows us how miners are performing relative to other stocks. The interpretation is quite straightforward. During bull markets this ratio rallies and during bear market this ratio declines.
The ratio was on the rise between 2000 and 2011 and it's been declining since 2011 with two notable corrective upswings. The one in 2016 was big, and the recent one was relatively small.
Now, what is so remarkable about the recent corrective upswing is that it ended at practically the same level, just where the 1999 corrective upswing had ended.
This is astonishing. Based on other analogies, that year was very similar to what we saw right now, and it turns out that relative to other stocks, both situations were practically identical. These rallies (the 1999 and 2018-2019 one) started from similar price levels too.
History tends to rhyme, which suggests that we should expect the HUI to S&P 500 ratio to decline severely in the following months. The target is at about 0.027. The S&P 500 is currently trading at about 3000, which means that the HUI Index could fall to about 0.027 x 3000 = 81. This level is in tune with the target that we described based on the HUI Index chart, which further validates this forecast.
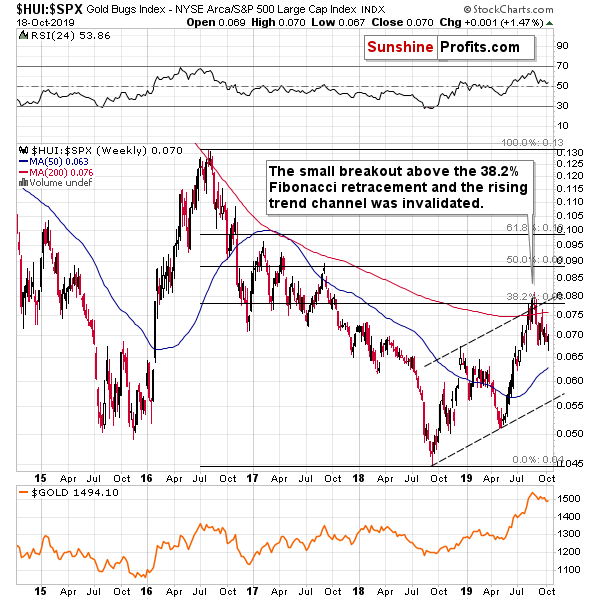
On a medium-term basis, the rally in the ratio seems to be over as well. The ratio moved a bit above its 38.2% Fibonacci retracement and the rising trend channel (dashed lines), but both small breakouts were invalidated, which acted as a strong sell signal. The ratio has been in the decline mode ever since.
Naturally, the other key bearish factors for the medium term remain intact.
Key Factors to Keep in Mind
Critical factors:
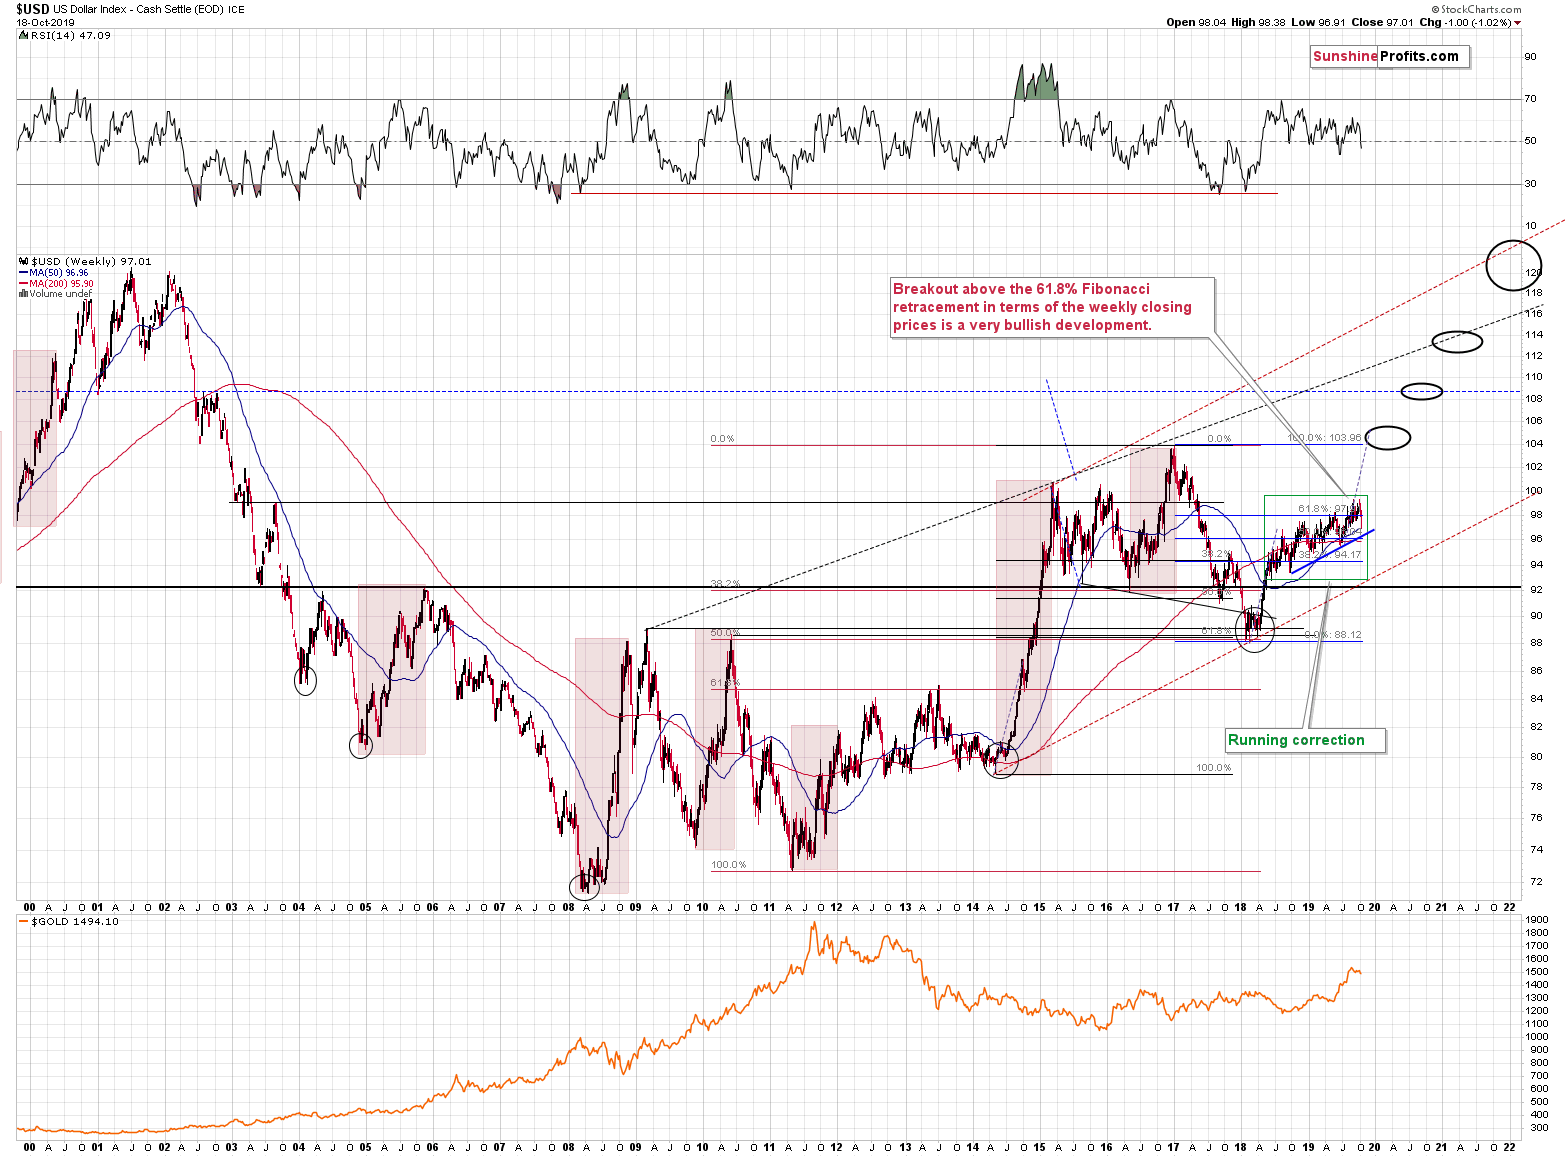
- The USD Index broke above the very long-term resistance line and verified the breakout above it. Its huge upswing is already underway.
- The USD's long-term upswing is an extremely important and bearish factor for gold. There were only two similar cases in the past few decades, when USD Index was starting profound, long-term bull markets, and they were both accompanied by huge declines in gold and the rest of the precious metals market
- Out of these two similar cases, only one is very similar - the case when gold topped in February 1996. The similarity extends beyond gold's about a yearly delay in reaction to the USD's rally. Also the shape of gold price moves prior to the 1996 high and what we saw in the last couple of years is very similar, which confirm the analysis of the gold-USD link and the above-mentioned implications of USD Index's long-term breakout.
- The similarity between now and 1996 extends to silver and mining stocks - in other words, it goes beyond USD, gold-USD link, and gold itself. The white metal and its miners appear to be in a similar position as well, and the implications are particularly bearish for the miners. After their 1996 top, they erased more than 2/3rds of their prices.
- Many investors got excited by the gold-is-soaring theme in the last few months, but looking beyond the short-term moves, reveals that most of the precious metals sector didn't show substantial strength that would be really visible from the long-term perspective. Gold doesn't appear to be starting a new bull market here, but rather to be an exception from the rule.
- Gold stocks appear to be repeating their performance from 20 years ago, which means that a bottom in the entire precious metals sector is quite likely to form at much lower prices, in about a year
Very important, but not as critical factors:
- Long-term technical signs for silver, i.a. the analogy in terms of price to what we saw in 2008, shows that silver could slide even below $10.
- Silver's very long-term cycles point to a major reversal taking place right now and since the most recent move was up, the implications are bearish (this is also silver's technical sign, but it's so important that it deserves its own point)
- Long-term technical signs for gold stocks point to this not being a new gold bull market beginning. Among others, it's their long-term underperformance relative to gold that hint this is rather a corrective upswing within a bear market that is not over yet.
- Record-breaking weekly volume in gold is a strong sign pointing to lower gold prices
Important factors:
- Extreme volume reading in the SIL ETF (proxy for silver stocks) is an effective indication that lower values of silver miners are to be expected
- Silver's short-term outperformance of gold, and gold stocks' short-term underperformance of gold both confirm that the precious metals sector is topping here
- Gold topped almost right at its cyclical turning point, which makes the trend reversal more likely
- Copper broke below its head-and-shoulders pattern and confirmed the breakdown. The last time we saw something similar was in April 2013, when the entire precious metals sector was on the verge of plunging lower.
Moreover, please note that while there may be a recession threat, it doesn't mean that gold has to rally immediately. Both: recession and gold's multi-year rally could be many months away - comparing what happened to bond yields in the 90s confirms that.
Summary
Summing up, it seems that the corrective upswing in gold is over and that the yellow metal's big decline is already underway (and that it had started in August as we had written previously), and that it will resume shortly. The similarity to how gold stocks rallied and then declined about 20 years ago provides us with a specific time target for the decline in the entire precious metals sector - it's likely to take place for about 1 year from now. That's not particularly close, but the road lower that gold, silver, and miners are likely to take is not short either. The profits from the short position in gold, silver and mining stocks are likely to be legendary, but the difficult part is not to miss the decline. Fortunately, the pace of decline that we saw 20 years ago provides suggestions regarding when it might be worth to bet on the corrective upswing with one's trading capital and when it's better to wait it out. Based on the analogy to the above-mentioned decline, the next medium-term bottom might take place in about 2 months, in mid-December. There are additional indications pointing to a short-term reversal (likely a bottom) in early November.
As always, we'll keep you - our subscribers - informed.
To summarize:
Trading capital (supplementary part of the portfolio; our opinion): F speculative short position (250% of the full position) in gold, silver, and mining stocks are justified from the risk/reward perspective with the following stop-loss orders and binding exit profit-take price levels:
- Gold: profit-take exit price: $1,391; stop-loss: $1,573; initial target price for the DGLD ETN: $36.37; stop-loss for the DGLD ETN: $25.44
- Silver: profit-take exit price: $15.11; stop-loss: $19.06; initial target price for the DSLV ETN: $24.88; stop-loss for the DSLV ETN: $14.07
- Mining stocks (price levels for the GDX ETF): profit-take exit price: $23.21; stop-loss: $30.11; initial target price for the DUST ETF: $11.69; stop-loss for the DUST ETF $6.08
In case one wants to bet on junior mining stocks' prices, here are the stop-loss details and target prices:
- GDXJ ETF: profit-take exit price: $31.62; stop-loss: $41.22
- JDST ETF: profit-take exit price: $24.88 stop-loss: $12.46
Long-term capital (core part of the portfolio; our opinion): No positions (in other words: cash)
Insurance capital (core part of the portfolio; our opinion): Full position
Whether you already subscribed or not, we encourage you to find out how to make the most of our alerts and read our replies to the most common alert-and-gold-trading-related-questions.
Please note that the in the trading section we describe the situation for the day that the alert is posted. In other words, it we are writing about a speculative position, it means that it is up-to-date on the day it was posted. We are also featuring the initial target prices, so that you can decide whether keeping a position on a given day is something that is in tune with your approach (some moves are too small for medium-term traders and some might appear too big for day-traders).
Plus, you might want to read why our stop-loss orders are usually relatively far from the current price.
Please note that a full position doesn't mean using all of the capital for a given trade. You will find details on our thoughts on gold portfolio structuring in the Key Insights section on our website.
As a reminder - "initial target price" means exactly that - an "initial" one, it's not a price level at which we suggest closing positions. If this becomes the case (like it did in the previous trade) we will refer to these levels as levels of exit orders (exactly as we've done previously). Stop-loss levels, however, are naturally not "initial", but something that, in our opinion, might be entered as an order.
Since it is impossible to synchronize target prices and stop-loss levels for all the ETFs and ETNs with the main markets that we provide these levels for (gold, silver and mining stocks - the GDX ETF), the stop-loss levels and target prices for other ETNs and ETF (among other: UGLD, DGLD, USLV, DSLV, NUGT, DUST, JNUG, JDST) are provided as supplementary, and not as "final". This means that if a stop-loss or a target level is reached for any of the "additional instruments" (DGLD for instance), but not for the "main instrument" (gold in this case), we will view positions in both gold and DGLD as still open and the stop-loss for DGLD would have to be moved lower. On the other hand, if gold moves to a stop-loss level but DGLD doesn't, then we will view both positions (in gold and DGLD) as closed. In other words, since it's not possible to be 100% certain that each related instrument moves to a given level when the underlying instrument does, we can't provide levels that would be binding. The levels that we do provide are our best estimate of the levels that will correspond to the levels in the underlying assets, but it will be the underlying assets that one will need to focus on regarding the signs pointing to closing a given position or keeping it open. We might adjust the levels in the "additional instruments" without adjusting the levels in the "main instruments", which will simply mean that we have improved our estimation of these levels, not that we changed our outlook on the markets. We are already working on a tool that would update these levels on a daily basis for the most popular ETFs, ETNs and individual mining stocks.
Our preferred ways to invest in and to trade gold along with the reasoning can be found in the how to buy gold section. Additionally, our preferred ETFs and ETNs can be found in our Gold & Silver ETF Ranking.
As a reminder, Gold & Silver Trading Alerts are posted before or on each trading day (we usually post them before the opening bell, but we don't promise doing that each day). If there's anything urgent, we will send you an additional small alert before posting the main one.
=====
Latest Free Trading Alerts:
The markets remained surprisingly calm last week, despite worse than expected U.S. economic data releases. The third-quarter earnings season along with Brexit play may have overweighed the data pessimism. This week, we will have some potentially moving news releases along with more big names corporate earnings. So let's take a look at those events.
Important Economic News Calendar: October 21 - October 25, 2019
=====
Thank you.
Sincerely,
Przemyslaw Radomski, CFA
Editor-in-chief, Gold & Silver Fund Manager

