
HUI Seasonality
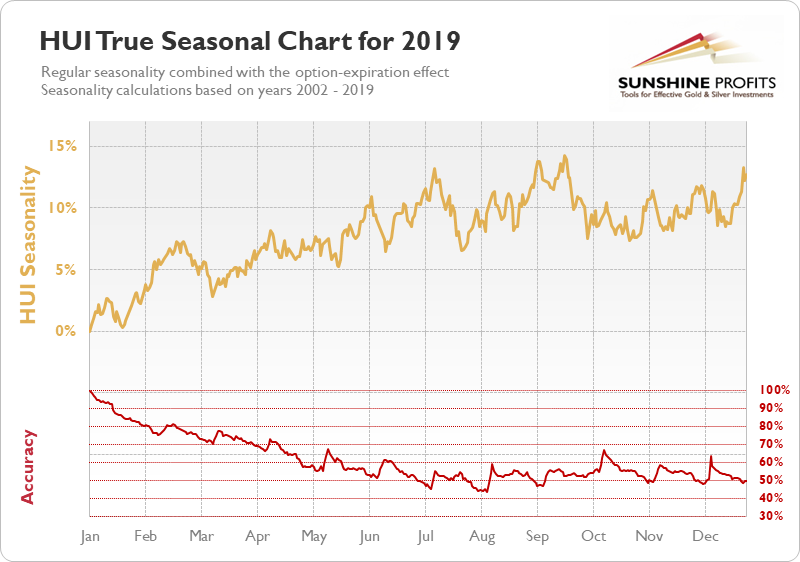
(Psst! If the above chart seems confusing, don’t worry, we’ll explain everything below, just after a quick info regarding the data that we used and once we show you why it’s worth your time to read the rest).
We prepared the above NYSE Arca Gold BUGS Index seasonal chart for 2019 based on the 2002 - 2018 data and then adjusted it for the options' expiration effect that we observed between 2009 and 2018.
Show Me the Money!
Instead of going looking at the engine’s manufacturing process, let’s do a quick test drive. The dataset that we used ends in 2018, so we can only test it this year (in 2019). How did gold move in the first quarter of the year? Based on the above seasonal chart, gold should have moved about 5% higher and top in the second half of February, then slide initially and then move more or less in a back-and-forth manner while not making new lows. What happened?
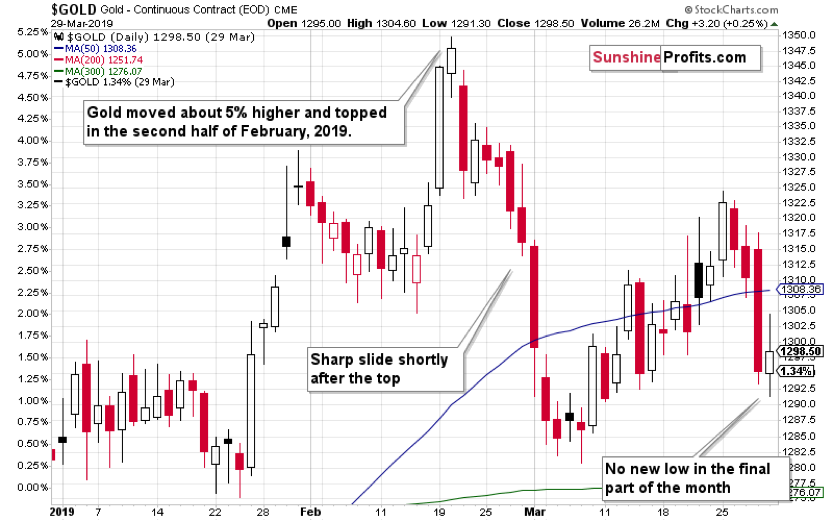
Well,gold moved exactly as the True Seasonal Chart had indicated. Of course, it was not perfect – the size of decline was bigger in reality, but this level of accuracy (don’t worry, we’ll move to this issue later) was never something that one could have expected. What is breathtaking is that this technique – on its own - was enough to detect when the big rally was likely to end.
Do we have your attention?
Great! Then let’s gain knowledge, details, and reap some solid profits.
True Seasonal Charts: Beyond Regular Seasonality
Plain seasonality is detecting things that happen at the same time of the year on average – it’s snowing in winter, it’s hot in the summer, each type of flowers blooms at its own specific time more less the same time of the year, and gold price tends to… You get the idea. And if you want more details on the seasonality concept, please visit the above link. Below we’ll focus on what people usually fail to take into account. You see, the plain seasonality ignores an important part of information. Some events don't take place on exactly the same day, but their occurrence is known in advance, nonetheless. Thanksgiving serves as a real-life example. It's on the fourth Thursday of each November, but the exact day of the month varies from year to year. The most important event that impacts the gold price moves is the expiration of gold options. Like Thanksgiving, it may not be on the same day each month / each year. Consequently, the accuracy of the regular seasonal gold charts would be improved, if one was able to look at the both effects at the same time: regular seasonality and the effect that option’s expiration has on the price of gold.
And that's exactly what we did in the above True Seasonal Gold Chart. Instead of looking at regular seasonality while knowing that what you see will be distorted close to the options' expiration, you're analyzing a chart that takes this into account and gives you the clearer view.
Before moving further, let’s take a look at the options’ expiration effect in practice. The last expiration date of 2018 was November 27th.
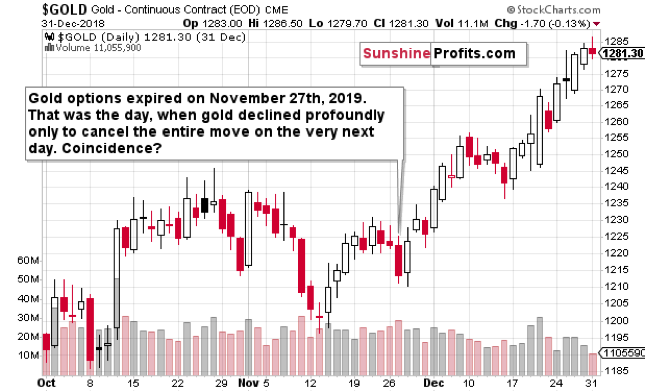
The daily decline doesn’t distort the entire picture, but the accuracy of the projected price path would be better when things like that were taken into account. Each market reacts differently, and we are applying each market’s usually reaction to its own True Seasonal Charts. For instance, gold's True Seasonal Chart is based on gold’s regular seasonality and on the impact gold option expiration tends to have on the price on gold.
Seasonal Charts’ Accuracy
There's one more question that you should be asking yourself before applying any seasonal chart in practice. Did the HUI Index price swings at specific parts of each year happen consistently over the years or did they vary a lot? The answer is critical, because in the former case, the odds are that the repeating pattern will repeat itself once again, while in the latter, one shouldn't count on the average of the moves to take place.
In other words, before applying any statistics (after all, seasonality is a statistical measure), you need to know what you're looking at, and you need to be sure that it is indeed applicable with regard to what you want to do. Seasonal charts are created based on averages of relative price moves. And the problem with averages is that they can be misleading. You see, me and my dog have on average 3 legs. It's true, but you can see how ridiculous predictions one could make based on this assumption. Looking at seasonal charts without checking the consistency, is like buying yourself 3 shoes based on the average from the above example.
Yet, practically all seasonal charts that you can find online ignore this obvious issue. But not our True Seasonal charts. The red line below the chart that we described as "Accuracy" is based on the variability of prices at a given date. Cool, right? And you're free to use / share these charts too.
It may be perplexing at the first sight, especially that the Accuracy measure always declines from 100% at the start, but please give us just 2 minutes and it will all be clear.
The key thing to keep in mind is that the Accuracy measure for any given day means how consistently gold was in a given position (or close to it) on this particular day, relative to the first day on the chart.
For instance, if half of the time gold was much higher and half of the time gold was much lower, then on average it was more or less unchanged, but in this case, the Accuracy measure would be low, because the consistency (variability) would be low. In this case, you would know not to bet a farm on the no-change scenario.
Why does the Accuracy start with 100%? Because that's the day to which all other days are compared. The first day compared to the first day is no prediction at all - it's just a statement of a price on that day - that's why it says 0% change and 100% accuracy. That's just a technical detail. The usefulness starts on the following day and that's when the Accuracy is no longer 100%. The interesting thing is that the Accuracy declines over time. Is there anything special about the early part of the year that causes the Accuracy levels to be closer to 100% than it's the case with the last quarter? No, there's nothing special about it, the Accuracy declines over time, because it always compares a given price to the first date on the chart. In case of the yearly chart, it's January 1st. The key point is that much more can happen between January 1st and November 1st, than between January 1st and January 10th. Many different things can - and will - take place that can make gold move in either direction and move away from the regular patterns. Some things repeat each year, but some things are very different, and the longer the time frame is being considered, the more such unpredictable things can take place. Consequently, it's normal that relative to the beginning of the year, we get predictions that are less accurate if we try to estimate gold's performance for the final part of the year compared to making the predictions for the early part of the year. That's why on average, the Accuracy measure declines over time.
There are temporary increases in the Accuracy value, which means that at certain times during the year the relative value of gold compared to the beginning of the year is more likely to be where the chart suggests than in the surrounding area.
All in all, the true usefulness of HUI's yearly seasonal chart comes from checking when the Accuracy is particularly high and when it is particularly low. This can tell us if we should take attribute big predictive weight to seasonal charts' indications or not.
What’s Better Than One Seasonal Chart? Four Seasonal Charts
Ok, but if we're already in July, it means that we already know what the price was on July 1st. Can't we just check what happened in each quarter separately?
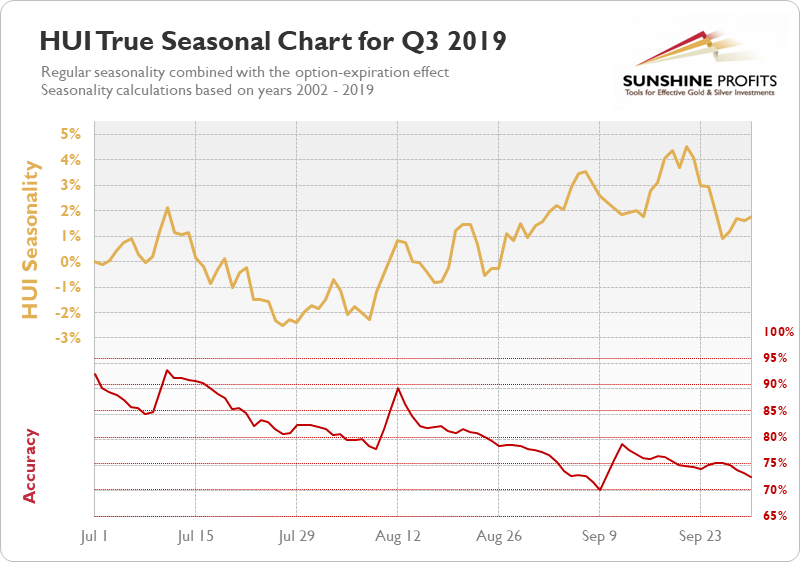
That's exactly what we can do! Better yet, we have already done it and you can see the quarterly values below. It's not just zooming in on the yearly chart - it's checking the performance relative to the beginning of each quarter and then calculating the Accuracy measure for it. It's much easier and more useful to compare price changes that are based on the recent prices than to try to figure out what the price should be compared to when the year started. The odds are that due to the prevailing trend, gold mining stocks index will not be where the yearly seasonal charts would suggest, but the shape of HUI's move will still be somewhat in tune with it. Looking at the quarterly seasonal charts can make it clearer what HUI price should we expect to see based on the seasonal patterns, not only what kind of shape of the price might be in the cards.
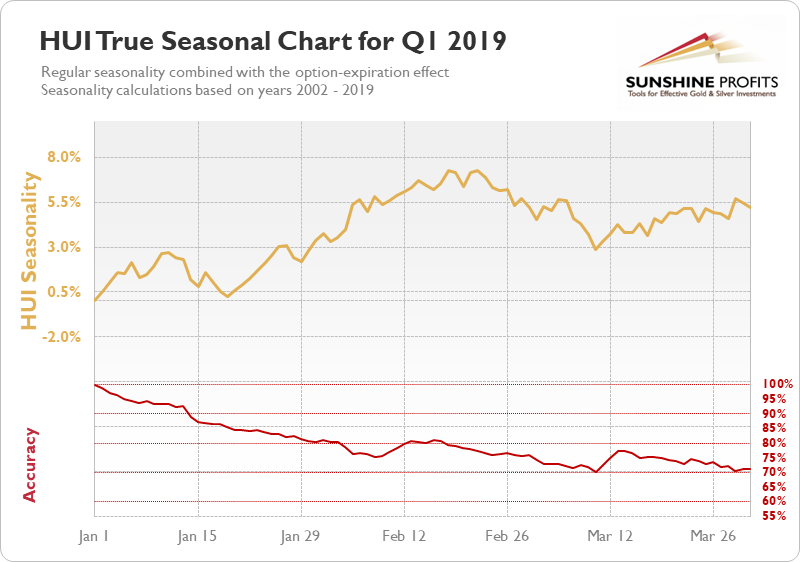
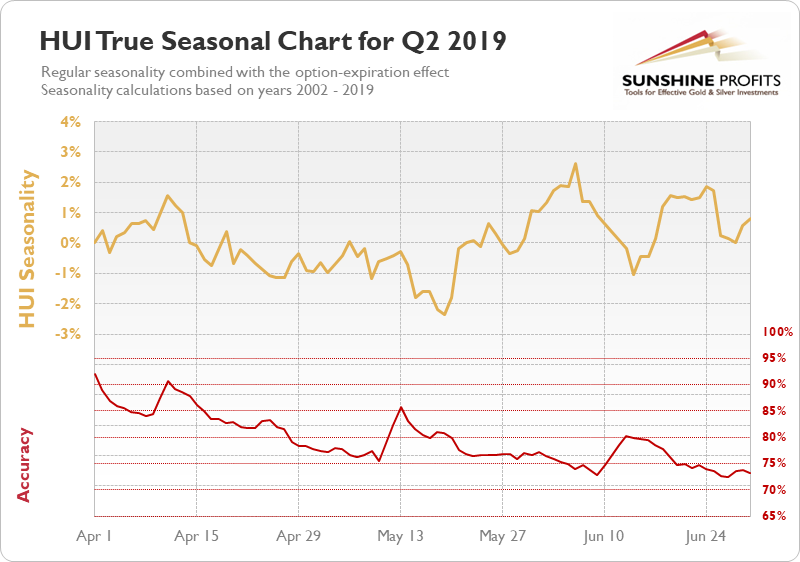
Quarterly vs. Yearly Seasonals
Ok, so but if the quarterly charts as better, then why use the yearly one at all?
Because it still gives us additional insight over the quarterly charts and it’s generally best to review both: yearly and quarterly seasonal charts and see how they confirm each other, when they do, the likelihood of a specific pattern being repeated increases. For instance, let’s consider the April performance. The quarterly chart tells us that gold mining stocks index tend to decline almost 0.5% in the middle of the month compared to April’s starting price. However, the yearly chart tells us that the mid-April price is likely to be about 4% higher than at the beginning of the year. If HUI had already rallied in a given year (say 5% or more), then the yearly chart has little implications, but if it didn’t, the bearish implications of the quarterly chart would not be as bearish, as the bearish quarterly indication would be combined than the bullish yearly indication. The accuracy measure for the quarterly indication is bigger, so it final implication would still be bearish, but not as bearish as it would be if gold was after a rally in the first quarter in the year and yearly seasonality wouldn’t suggest a move to value about 4% greater than the January 1st price.
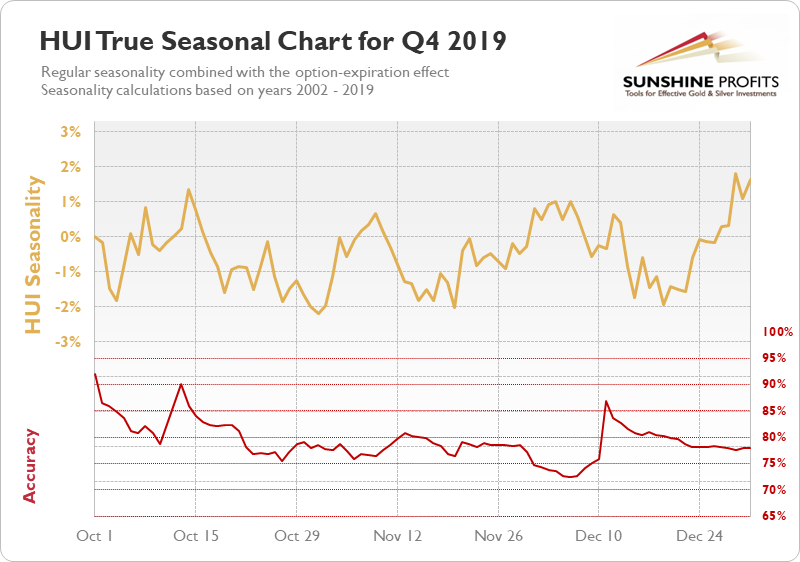
Moreover, close to the end of the quarter, it’s not clear what happens after the right edge of the chart and the yearly chart provides the necessary heads-up.
In general, the further we move from the beginning of the year, the lower Accuracy will the yearly chart have, but it will still be a valuable addition to the quarterly seasonal chart, which would be used as the key one.
So, to make a long story short, the quarterly chart is usually more useful and it’s good to start with it, but it’s also worth to keep the overall yearly seasonal trend in mind, as it might make indications from the quarterly charts weaker or stronger.
Key Takeaways
Let’s summarize:
- Seasonal charts and seasonality in general is a useful tool that can help you detect the shape of the HUI Gold Index price movement. There are many additional techniques and trading tips that one should investigate before trading or investing in gold.
- Seasonal charts will not give you a 100% precise price path for HUI Gold Index or any other asset, simply because the history doesn’t repeat itself to the letter. However, it can help you estimate the moments where the price corrects and when the big moves are likely to start.
- The usefulness of regular seasonal charts can be enhanced by combining them with the effect of options’ expiration. These are important dates for each market as option sellers and buyers strive to push the price in their favor when options expire, which often causes specific price moves. As options don’t expire on the same day each month, regular seasonal charts provide less clarity than our True Seasonal Charts.
- The usefulness of the regular seasonal charts as well as True Seasonal Charts can be further improved by adding the Accuracy measure. Without it, it’s impossible to tell when the seasonal charts point to a useful outcome, and when they don’t. Thanks to the Accuracy measure, one can also estimate the overall usefulness and the entire point of using the seasonal charts for a given market. For example, it’s useful for gold, but it’s rather useless for the CDE stock price.
- From time to time, we will publish a free article on seasonality and we will use this tool in our premium analyses, but please note that we are publishing our True Seasonal Charts free of charge, so you are free to examine them when you wish. You can also use them in your own analyses or send them to your favorite analyst so that they can use them in their analyses. The only thing that we request in this case is that the analyses include a clickable backlink to us (to https://www.SunshineProfits.com. The same rule applies to posting our True Seasonal Charts on forums and anywhere else. You can do it, as long as you link to us as the source.
- If you’d like to stay updated on what we publish, we encourage you to sign up for our free mailing list. It’s the fastest way to get your hands on our free analyses of gold, silver, crude oil, and other markets and it comes with a great starting bonus - 7 days of free access to our premium: Gold & Silver Trading Alerts, Oil Trading Alerts, and Forex Trading Alerts. It’s really free and if you don’t like it, you can easily unsubscribe. Sign up today!
True Seasonal charts for other markets:
Precious metals' seasonality:
Indices' and currencies' seasonality:
- Dow Jones Industrial Average seasonality
- S&P 500 seasonality (a.k.a. Stock seasonality)
- USD Index seasonality
- HUI Index (gold stocks) seasonality
- XAU Index seasonality
- TSX Venture Index (proxy for juniors) seasonality
- CADUSD exchange rate seasonality
Individual gold stocks' seasonality:
- AUY - Yamana Gold Inc. seasonality
- IAG - IAMGOLD Corp. seasonality
- EGO - Eldorado Gold Corp. seasonality
- RGLD - Royal Gold, Inc. seasonality
- KGC - Kinross Gold Corp. seasonality
- NGD - New Gold Inc. seasonality
- GSS - Golden Star Resources Ltd. seasonality
- HMY - Harmony Gold Mining Company Ltd. seasonality
- AU - Anglogold Ashanti Ltd. seasonality
- NEM - Newmont Mining Corp. seasonality
- ABX - Barrick Gold Corp. seasonality
- BVN - Compania de Minas Buenaventura seasonality
- GFI - Gold Fields Ltd. seasonality
- GOLD - Randgold Resources Ltd. seasonality
- AEM - Agnico-Eagle Mines Ltd. seasonality
- GG - Goldcorp Inc. seasonality
- FCX - Freeport - McMoRan Copper & Gold Inc. seasonality
Individual silver stocks' seasonality:
- PAAS - Pan American Silver Corp. seasonality
- SLW - Silver Wheaton Corp. seasonality
- HL - Hecla Mining Company seasonality
- SVM - Silvercorp Metals Inc. seasonality
- EXK - Endeavour Silver Corp. seasonality
- SSRI - Silver Standard Resources Inc. seasonality
- CDE - Coeur d'Alene Mines Corp. seasonality
- AG - First Majestic Silver Corp. seasonality
If you're interested in the precious metals market in general, sign up for our free mailing list. You'll get 7 days of free access to our Gold & Silver Trading Alerts, Oil Trading Alerts, Forex Trading Alerts, and Day Trading Signals. And after the trial is over you'll still receive our free articles on gold and much more. Sign up today!
Free Gold Newsletter
with details not available
to 99% investors
+ 7 days of Gold Alerts
+ Mining Stock Rankings
Gold Alerts
More-
Status
New 2024 Lows in Miners, New Highs in The USD Index
January 17, 2024, 12:19 PM -
Status
Soaring USD is SO Unsurprising – And SO Full of Implications
January 16, 2024, 8:40 AM -
Status
Rare Opportunity in Rare Earth Minerals?
January 15, 2024, 2:06 PM
Recent
More- May 4, 2021, 6:54 AM Mushrooms in the Park?
- April 11, 2021, 12:24 PM Your Week In Brief
- March 12, 2021, 11:28 AM Dear Bill Gates, Please Stop Commenting about Bitcoin
Dear Sunshine Profits,

