

Briefly: in our opinion, full (250% of the regular size of the position) speculative short position in gold, silver, and mining stocks are justified from the risk/reward point of view at the moment of publishing this Alert.
What a fast reversal in gold we say yesterday! That's certainly a far cry from the many less volatile sessions prior. The excitement in the gold community keeps rising, and in today's gold Alert, we'll look at everything that this gold rally has and has not changed. The exhaustive view throughout the precious metals'sector will show you clearly where we stand on this matter. And why.
For quite a long time, we wrote that our Alerts were going to be short, as nothing changed from the long-term point of view. And while the latter is still the case, we would like to bring to your attention the details of some of the long-term points once again, so that they don't appear less important just because we haven't mentioned them recently.
Looking at the short-term charts makes one think "wow, what a big rally in gold!" and this is being said as if it's the only important thing right now. That's simply false. Yes, we did see a short-term rally in gold. Silver and miners followed, but that's significant only if we stubbornly insist on viewing the silver and mining stock charts through magnifying lenses.
Looking through a microscope is useful at times, but when you want to safely drive home, you'd be much better off by looking at the road directly, or with sunglasses, not looking at it through a microscope. Absurd, right? And yet, that's exactly the approach that many investors take, when things get hot on a very short-term basis. Yes, on the small scale, something happened, but does it really matter with regard to the big picture?
Gold is an important part of the precious metals market, but one's portfolio shouldn't depend on just one asset - it should include more of them. Our thorough (seriously, don't click this link without a cup of coffee at hand) research shows that it's best to combine gold, silver, gold stocks and silver stocks (part of the mining stocks ideally should be in the junior miners) for one's investment portfolio. How did all these key parts of the portfolio fare recently? Was the rally really that big as the "wow, what a big rally in gold!" phrase suggests?
Let's start with gold.
The 360-Degree View of This Gold Rally
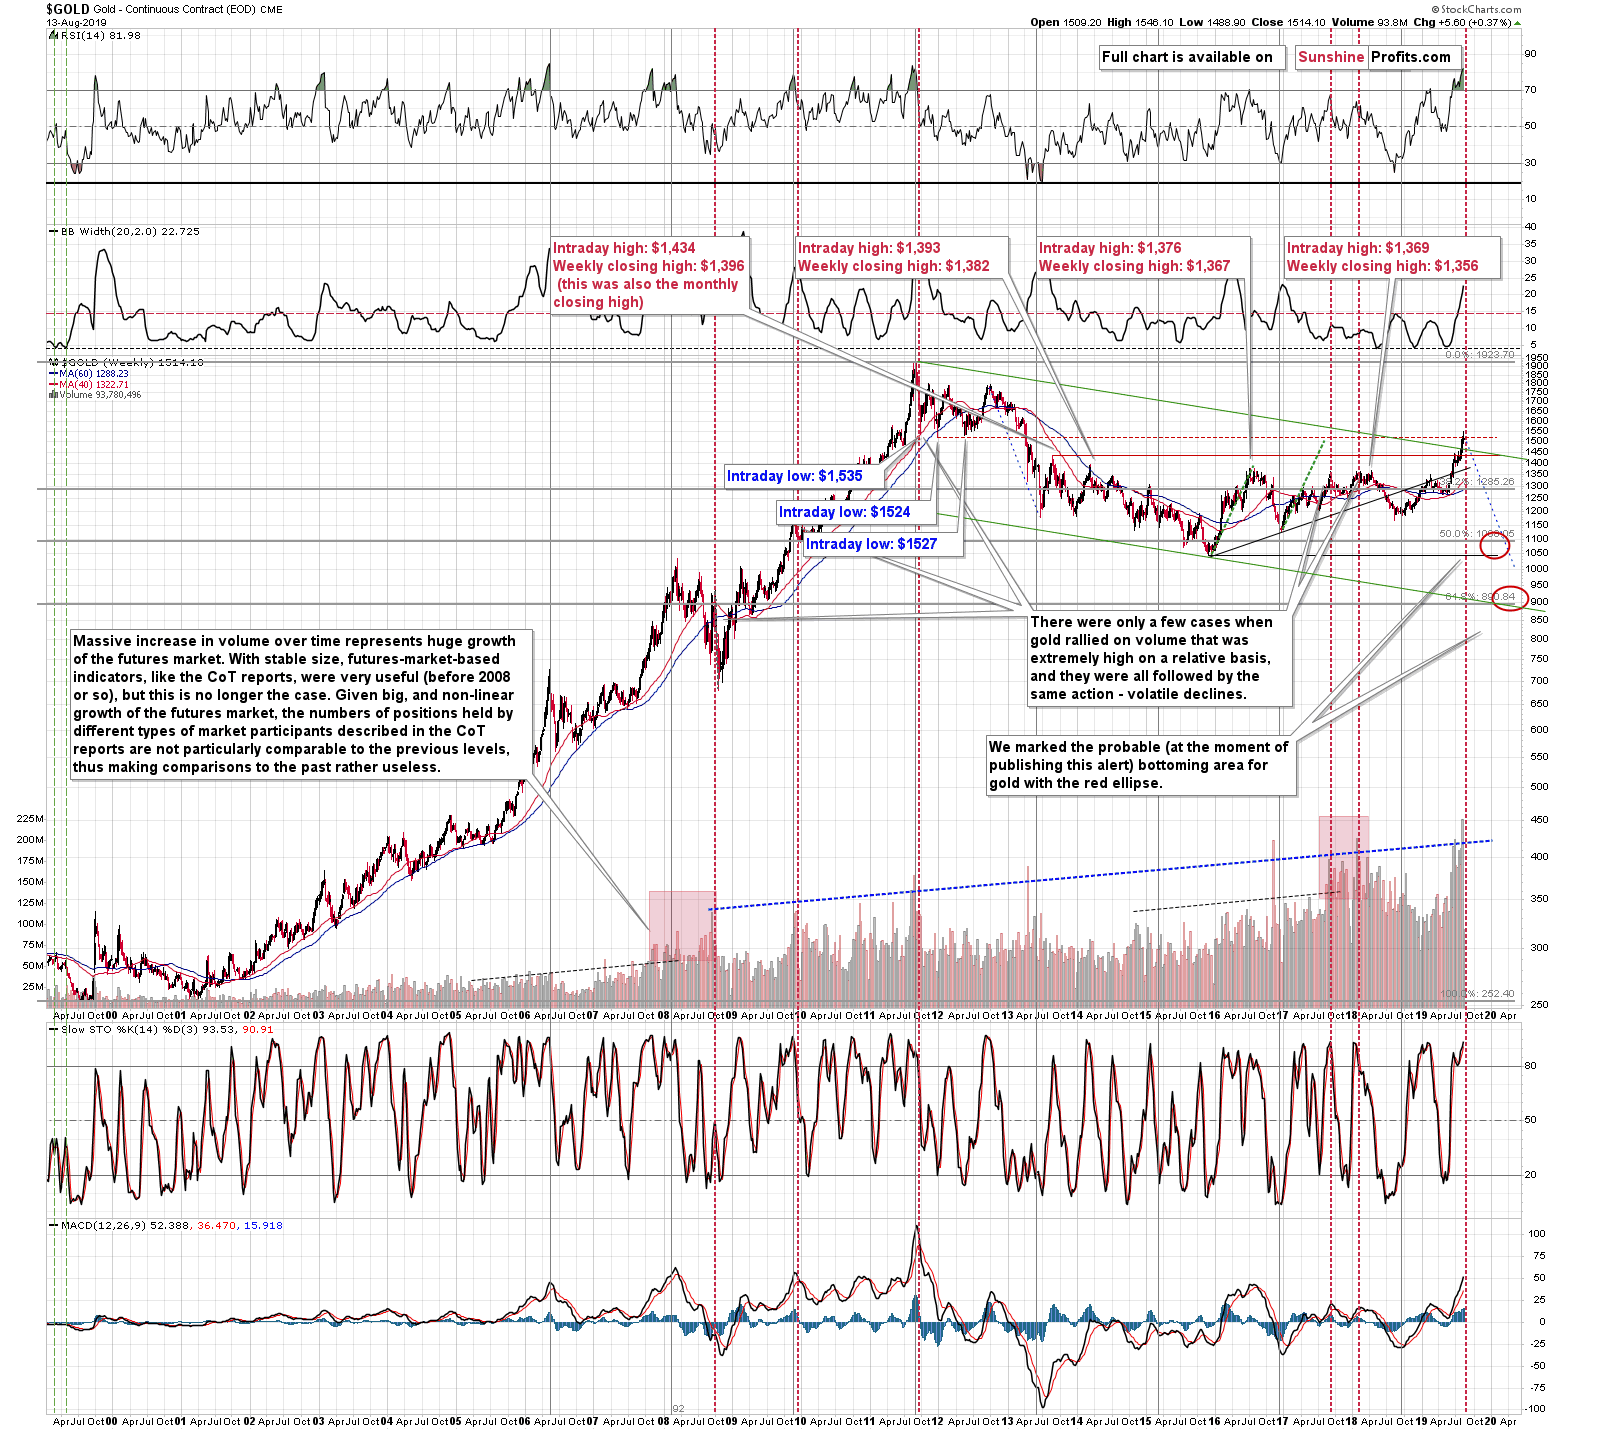
Yes, gold moved higher significantly. It moved to the 2011 and 2012 lows, and the April 2013 price gap. It verified these levels as resistance and yesterday's slide indicated that the top was most likely in. Consequently, while the move higher is definitely visible from the long-term point of view, it's likely temporary.
Let's be realistic. If one owns gold or bought it recently with the long-term investment in mind, what are the chances that they will exit their position here, or at least above $1,400 (or $1,300), while other investors and analysts continue to be so cheerful about gold? The record-breaking volume proves just how hot the situation has become. The chances of people getting out before gold slides substantially, are slim. At least for most people. And if - because of how "emotionally" hot the market has become - people are not able to realize their profits from the long positions, how significant is it that the current price is still above $1,500?
But why would gold fall from the current levels in the first place?
Because the resistance levels that were just reached (2011 and 2012 lows along with the 2013 price gap) are extremely strong, the RSI indicator shows extremely overbought conditions, while we have the bullish setup in the USD Index, and topping confirmations from silver and mining stocks. Plus the extreme volume that has almost always corresponded to major tops in the past - not the vertical red lines on the above chart.

On the above short-term gold chart, we see that yesterday's session was a very volatile doji candlestick. It's one of the reversal candlesticks, and the fact that it was accompanied by huge volume serves as the confirmation. Very strong buying power was overwhelmed by an even greater strength of the sellers.
The rally seems to have run its course and topped yesterday. What is also remarkable is that it happened just before gold's cyclical turning point. The most recent short-term move was definitely up, and we saw one of the classic reversal candlesticks. In this environment, the implications of the turning point are clearly bearish.
Summing up, gold moved significantly higher in the past months, but the outlook for it is bearish. Given where the nearest (38.2%) Fibonacci retracement is, it seems that gold could slide to $1,400 relatively quickly.
Ok, it seems that we covered 1/3 to 1/5 of the investment portfolio so far (depending on whether one wants to use mining stocks as the entire group, divide it into silver stocks and gold stocks, or divide it into senior gold stocks, senior silver stocks, and junior mining stocks). What about the rest (66.7% - 80%) of the portfolio?
Let's take a look at gold's sister metal - silver.
The White Metal in Detail
Is silver's rally even visible in the first plance - without zooming in the chart by clicking on it?
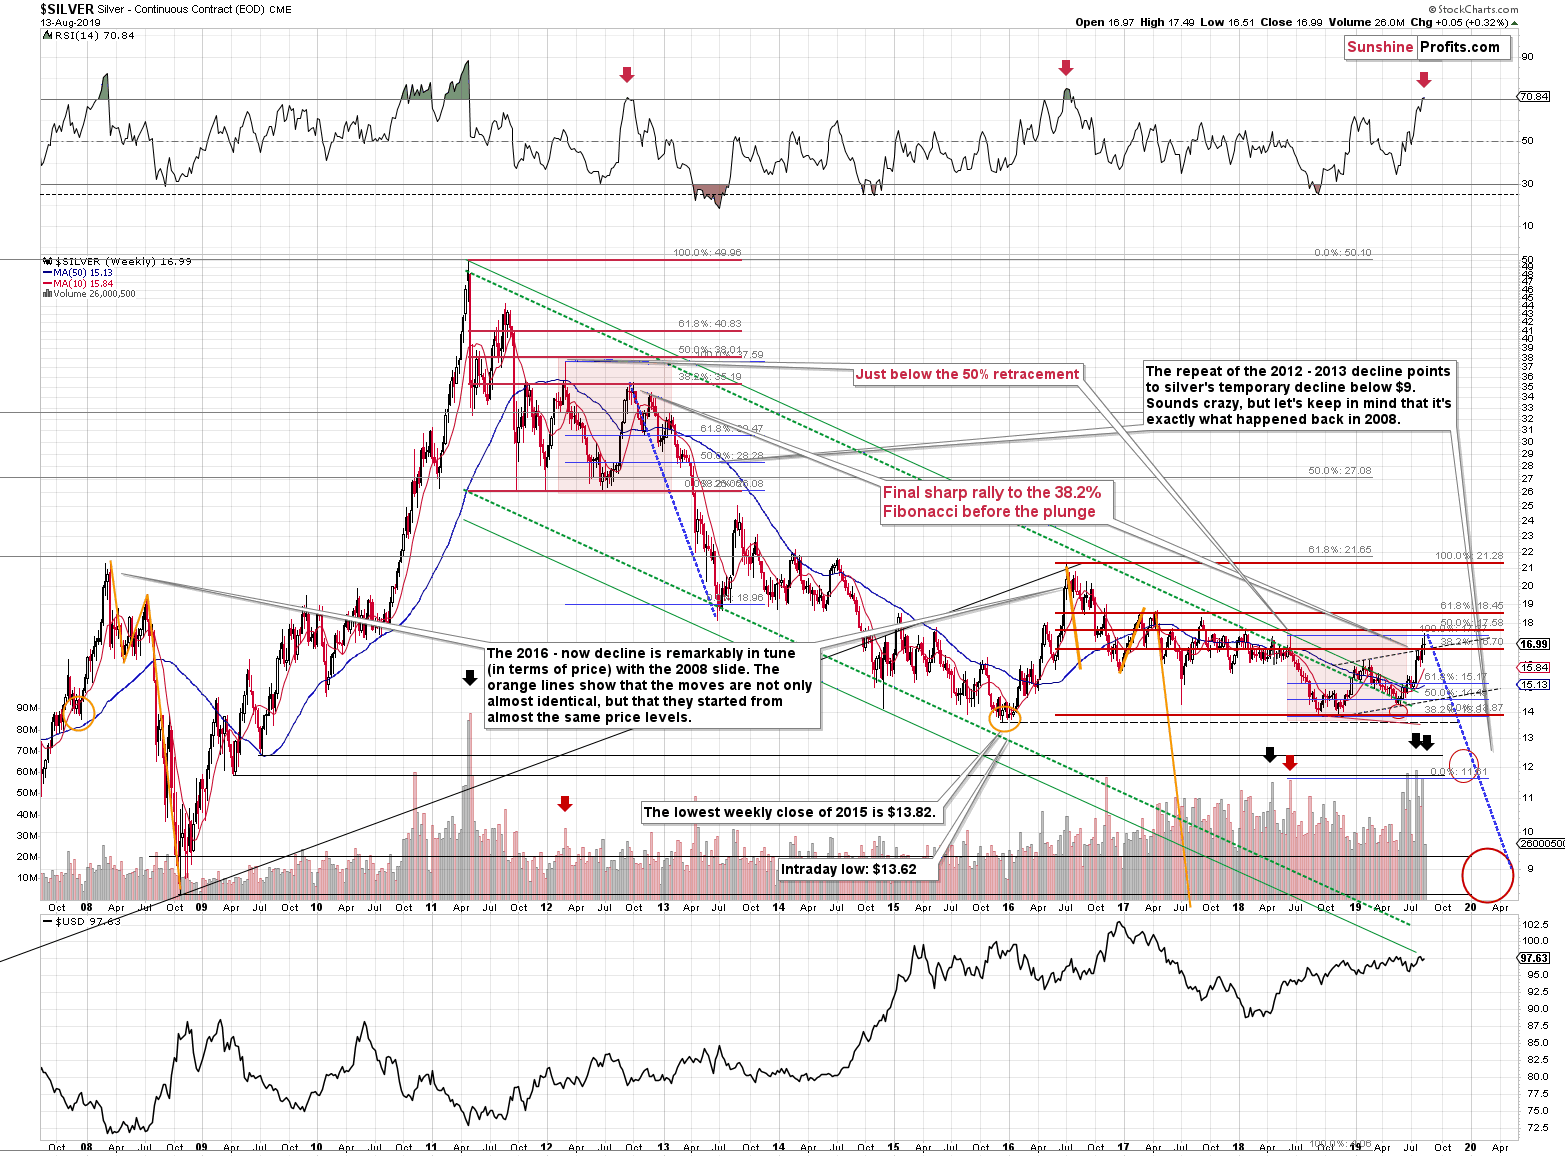
Have you noticed that silver is not only below its 2016 high, but also below its 2008 high? It didn't even move above its 2017 high!
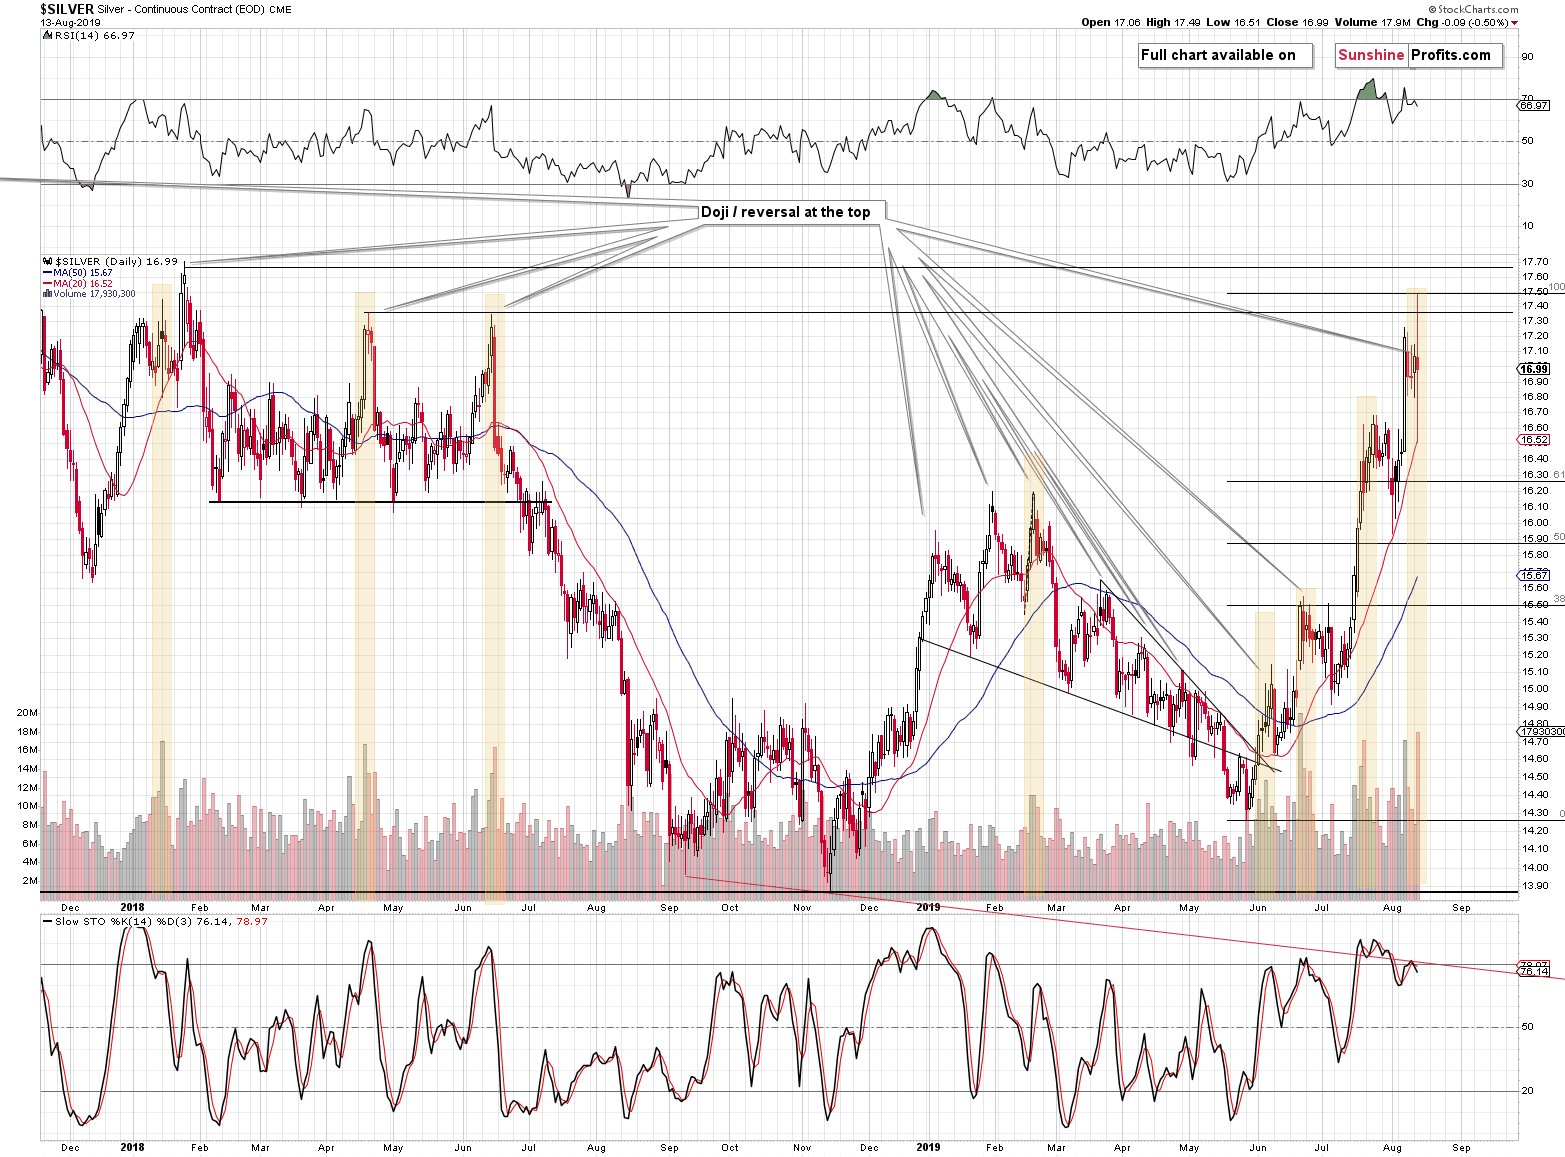
Silver didn't manage to correct even 50% of the decline from the 2016 high. While gold's rally is clearly visible from the long-term point of view, the one in silver definitely isn't. Silver managed to only move above the early 2019 and very briefly above the mid-2018 highs (but not the early 2018 high). What does it mean? It means that the rally is not very significant from the long-term point of view.
And what about silver's outlook? Silver's long-term upside potential is great, but as far as the next several months are concerned, the future looks gloomy.
There are many things that emphasize that the outlook is extremely bearish (such as the recent volume readings in silver and silver stocks), but with regard to the price level that was reached recently, there is one more very important detail that most investors likely miss.
The entire 2016 - now situation and the 2011 - late-2012 price movement are very similar.
In both cases there were actually four bottoms at very similar price levels that preceded the final upswing and the first one of them was very sharp (late 2011 and mid-2017). The timing between the following bottoms was different, but there are two major similarities that just can't be ignored or left unmentioned.
The first thing is that all major tops were lower than the previous ones. The only outlier is the current top, which was based on multiple fundamental surprises (Fed's approach, trade war etc.), which means that the price was virtually forced to move higher despite the negative technicals (that are likely to ultimately win anyway).
The second thing is that the top (the one in early 2012) that preceded the final top of the consolidation is extremely similar to the mid-2018 one (both were big-volume shooting star reversals) and this an extremely useful roadmap sign that tells us where silver is in light of the entire analogy.
The key thing is that the final pre-slide (late-2012) top formed at the 38.2% Fibonacci retracement level based on the preceding decline. The early 2012 top formed slightly below the 50% retracement (intraday high) and the weekly close was a bit below the 38.2% retracement. The mid-2018 top (analogous to the late-2012 one) also formed a bit below the 50% retracement and the weekly close of that top was a bit below the 38.2% retracement.
This means that if the analogy remains intact, silver should top at the 38.2% retracement right now, which is at $16.70. Silver moved a bit above this level, but it didn't reach the 50% retracement. Whilet his is not a 100% repeat of the previous price movement, it's still very similar (silver futures closed at $16.99 yesterday). Moreover, given the number of bullish fundamental surprises that we saw this year, the lacking strength of silver's reaction could be viewed as very bearish.
Why didn't silver soar above its 2016 high, just like gold did? Maybe silver is not lagging behind; maybe it's gold that rallied too much? Gold stocks and silver stocks should provide us with confirmation of either theory.
Strength in the Gold Stocks?
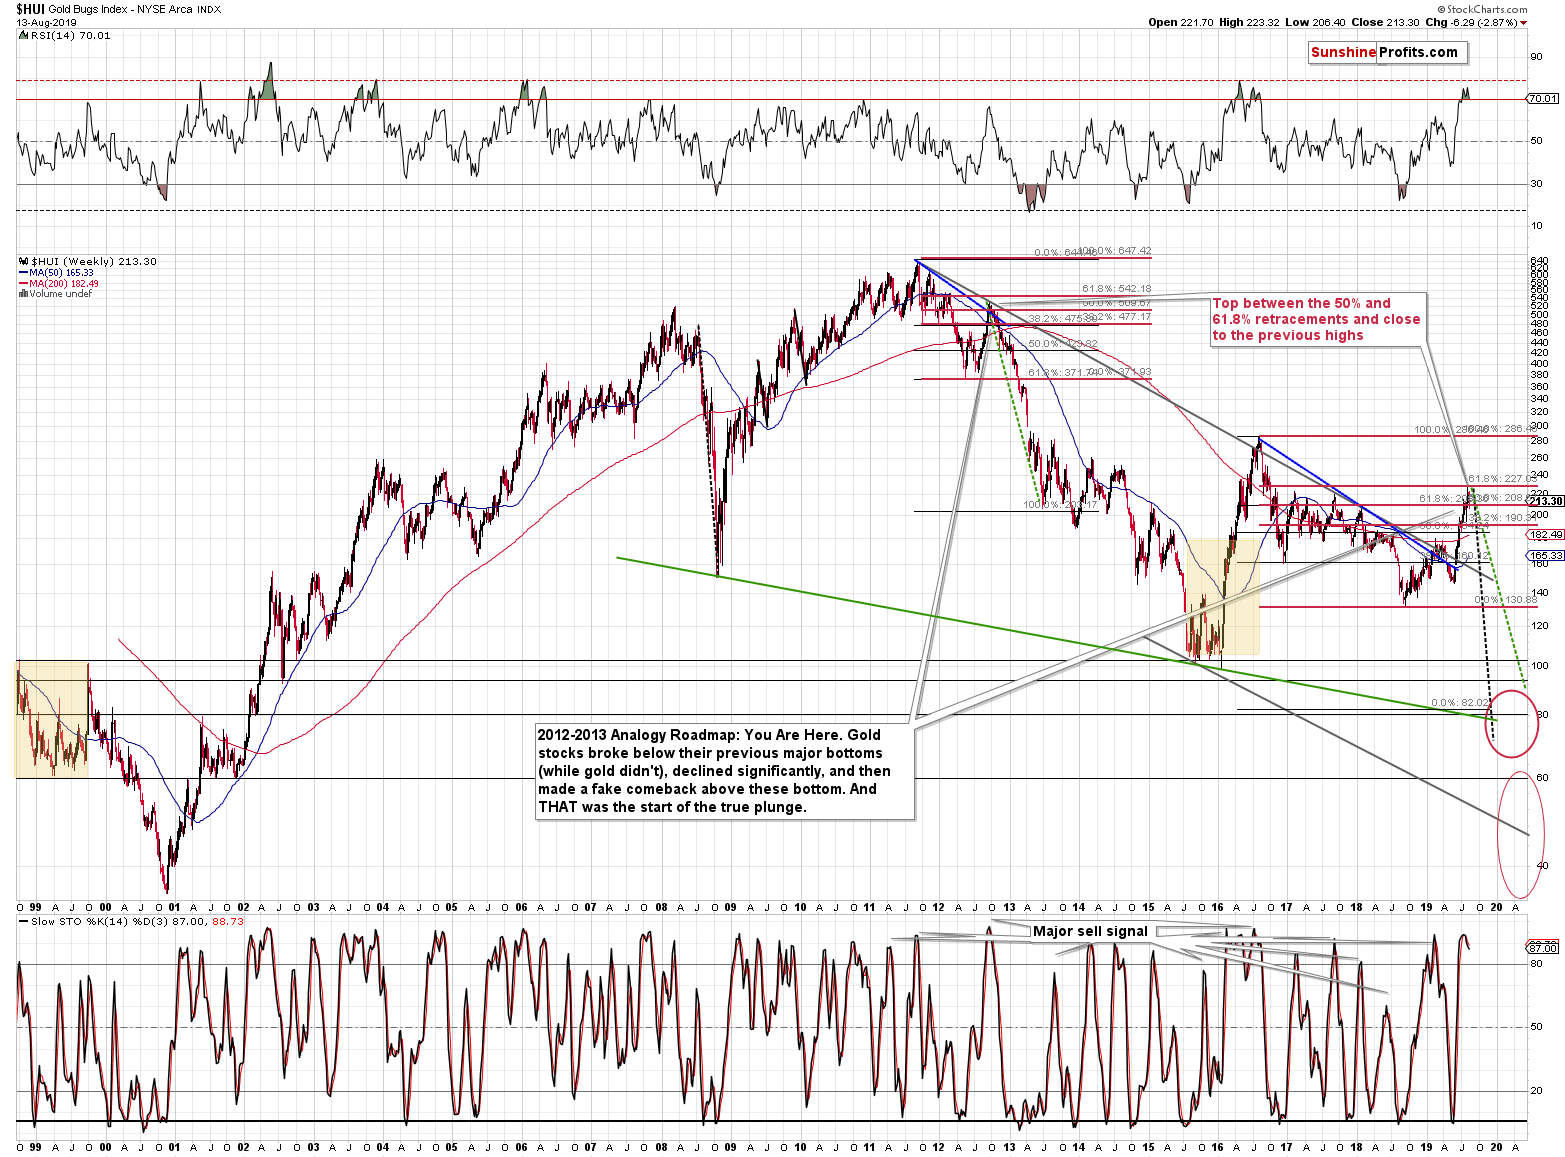
We wrote that silver was not even at its 2016 and 2008 highs right now. And where are the gold miners? They are practically just as low with regard to their 2016 high and they are much lower with regard to their 2008 high.
In fact, gold miners are barely above their 2008 low from the long-term point of view.
And that's how the new bull market is supposed to start? With weak gold mining stocks despite sharply higher gold prices? Something's not right here, is it? Please take a look at what happened between 2000 and mid-2002. The HUI Index soared from below 35.31 to above 154.99. Its value increased over 4 times! And how much did mining stocks gain from their 2018 bottom? Less than 70%.
Why are we comparing these two periods? Because gold moved about 30% higher from its 2018 bottom and more or less the same characterized the 2000 - mid-2002 rally. To be precise, back then gold rallied only a bit above 25%, so miners' past rally is even more profound on a relative basis.
Gold mining stocks are simply not showing the long-term strength that they should if this was the beginning of a new bull market in the precious metals sector.
The fact that gold stocks' rally was not very visible from the long-term point of view is not only an important observation of its own - it's also an indication that lower precious metals prices are on the horizon.
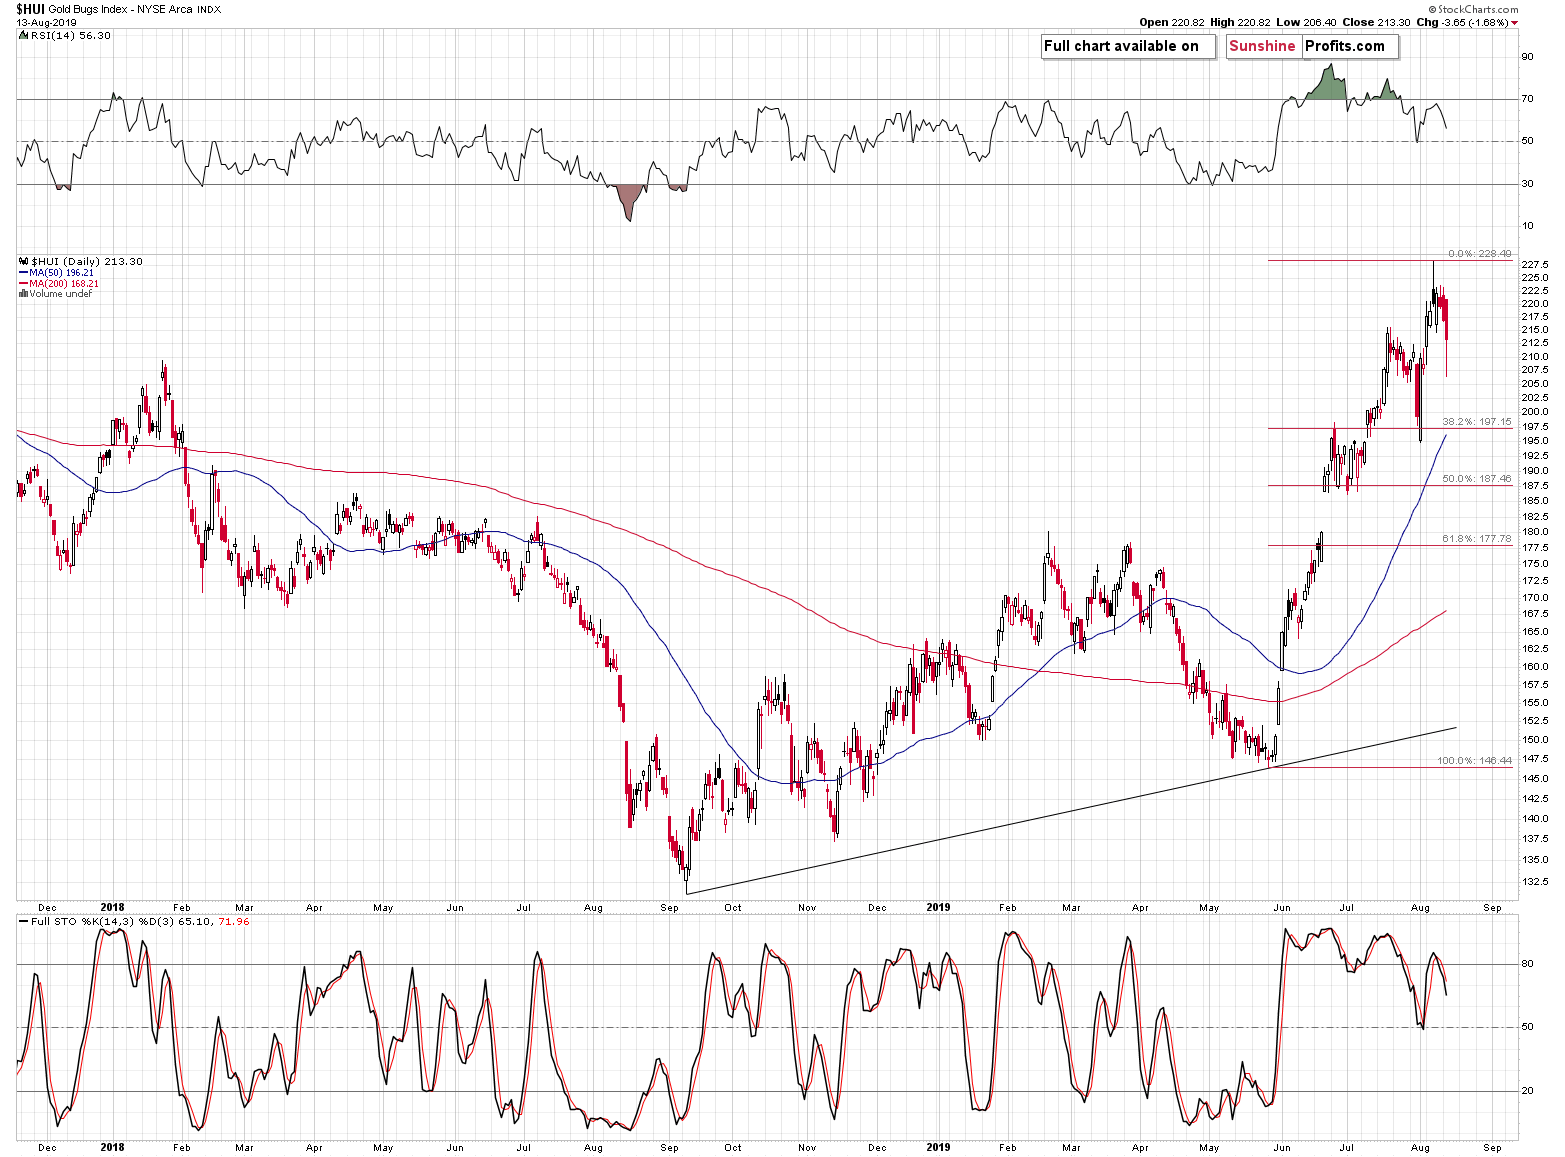
On HUI Index's short-term chart we see that despite the late-session reversal, gold stocks closed the day below the late-July high. Do you remember when gold topped in late July? The highest closing price of gold in mid-July was $1428.10. That's right. Gold closed yesterday's session almost $100 higher and gold stocks closed lower. If that's not the screaming sign of gold stocks' underperformance, then we don't know what is.
The above is one of the key short-term indications that declines are on the horizon and they are particularly reliable when silver outperforms at the same time when gold stocks underperform gold.
Silver and Silver Stocks Weigh In
And silver definitely outperformed gold in the last few weeks.
Moreover, please note that - just like gold - silver formed a doji reversal candlestick that was confirmed by huge volume. The implications are very bearish, especially that silver tends to end its rallies in this way (as we marked on the above chart).
Let's keep the focus on the big picture. Gold's upswing was clearly visible from the long-term point of view. Silver's upswing wasn't. Gold stocks' upswing wasn't. Maybe silver stocks can confirm gold's strength?
Out of all things that the above chart could confirm, gold's strength is the last.
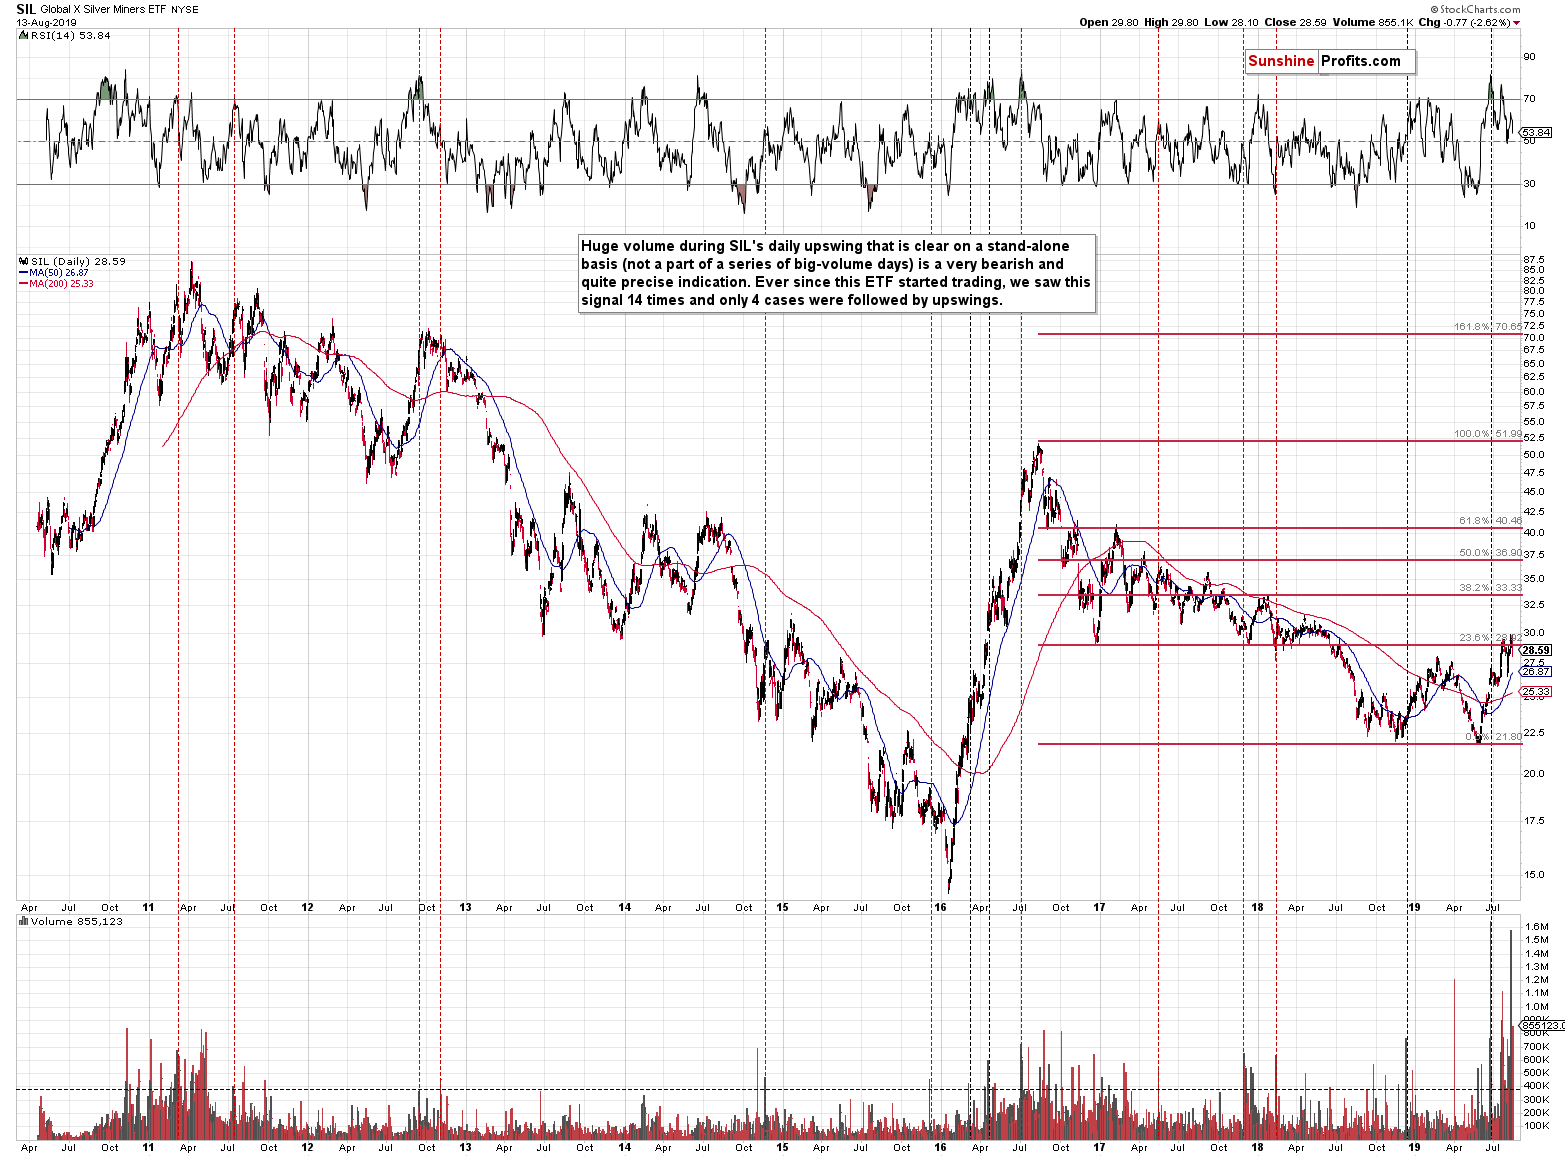
The SIL ETF was not trading in 2008, so we can't compare the current price to the 2008 top, but we can definitely compare it to the 2016 high. And the comparison shows that the most recent upswing was not only small, it was pathetic. Silver mining stocks managed to correct mere 25% of the 2016 - 2018 decline. They are nowhere close to the 2016 high.
Moreover, we saw extremely high volume reading in the silver miners, which has been a reliable sell signal. In 10 out of 14 previous cases when we saw big volume spikes in the SIL ETF, silver stocks declined shortly. That's another strong bearish confirmation of what we wrote so far today.
Summary
Summing up, taking the big investment picture into account, out of the following: gold, silver, gold stocks, silver stocks, the recent upswing was only visible in case of gold. Most of the precious metals portfolio: silver, gold miners, and silver miners suggest that what we saw in the last several months is nothing more than a corrective upswing within a bigger downtrend. Mining stocks' recent weakness and silver's strong performance in the very short term both suggest that one should be prepared for much lower, not higher precious metals prices.
As always, we'll keep you - our subscribers - informed.
To summarize:
Trading capital (supplementary part of the portfolio; our opinion): Full speculative short position (250% of the full position) in gold, silver, and mining stocks is justified from the risk/reward perspective with the following stop-loss orders and exit profit-take price levels:
- Gold: profit-take exit price: $1,241; stop-loss: $1,552; initial target price for the DGLD ETN: $51.87; stop-loss for the DGLD ETN $25.37
- Silver: profit-take exit price: $13.81; stop-loss: $17.73; initial target price for the DSLV ETN: $39.08; stop-loss for the DSLV ETN $18.27
- Mining stocks (price levels for the GDX ETF): profit-take exit price: $17.61; stop-loss: $33.37; initial target price for the DUST ETF: $32.28; stop-loss for the DUST ETF $5.78
In case one wants to bet on junior mining stocks' prices (we do not suggest doing so - we think senior mining stocks are more predictable in the case of short-term trades - if one wants to do it anyway, we provide the details), here are the stop-loss details and target prices:
- GDXJ ETF: profit-take exit price: $23.71; stop-loss: $48.42
- JDST ETF: profit-take exit price: $73.32 stop-loss: $9.67
Long-term capital (core part of the portfolio; our opinion): No positions (in other words: cash)
Insurance capital (core part of the portfolio; our opinion): Full position
Whether you already subscribed or not, we encourage you to find out how to make the most of our alerts and read our replies to the most common alert-and-gold-trading-related-questions.
Please note that the in the trading section we describe the situation for the day that the alert is posted. In other words, it we are writing about a speculative position, it means that it is up-to-date on the day it was posted. We are also featuring the initial target prices, so that you can decide whether keeping a position on a given day is something that is in tune with your approach (some moves are too small for medium-term traders and some might appear too big for day-traders).
Plus, you might want to read why our stop-loss orders are usually relatively far from the current price.
Please note that a full position doesn't mean using all of the capital for a given trade. You will find details on our thoughts on gold portfolio structuring in the Key Insights section on our website.
As a reminder - "initial target price" means exactly that - an "initial" one, it's not a price level at which we suggest closing positions. If this becomes the case (like it did in the previous trade) we will refer to these levels as levels of exit orders (exactly as we've done previously). Stop-loss levels, however, are naturally not "initial", but something that, in our opinion, might be entered as an order.
Since it is impossible to synchronize target prices and stop-loss levels for all the ETFs and ETNs with the main markets that we provide these levels for (gold, silver and mining stocks - the GDX ETF), the stop-loss levels and target prices for other ETNs and ETF (among other: UGLD, DGLD, USLV, DSLV, NUGT, DUST, JNUG, JDST) are provided as supplementary, and not as "final". This means that if a stop-loss or a target level is reached for any of the "additional instruments" (DGLD for instance), but not for the "main instrument" (gold in this case), we will view positions in both gold and DGLD as still open and the stop-loss for DGLD would have to be moved lower. On the other hand, if gold moves to a stop-loss level but DGLD doesn't, then we will view both positions (in gold and DGLD) as closed. In other words, since it's not possible to be 100% certain that each related instrument moves to a given level when the underlying instrument does, we can't provide levels that would be binding. The levels that we do provide are our best estimate of the levels that will correspond to the levels in the underlying assets, but it will be the underlying assets that one will need to focus on regarding the signs pointing to closing a given position or keeping it open. We might adjust the levels in the "additional instruments" without adjusting the levels in the "main instruments", which will simply mean that we have improved our estimation of these levels, not that we changed our outlook on the markets. We are already working on a tool that would update these levels on a daily basis for the most popular ETFs, ETNs and individual mining stocks.
Our preferred ways to invest in and to trade gold along with the reasoning can be found in the how to buy gold section. Additionally, our preferred ETFs and ETNs can be found in our Gold & Silver ETF Ranking.
As a reminder, Gold & Silver Trading Alerts are posted before or on each trading day (we usually post them before the opening bell, but we don't promise doing that each day). If there's anything urgent, we will send you an additional small alert before posting the main one.
=====
Latest Free Trading Alerts:
Oil bulls are a battle-hardened species. Not only have they rebuffed the bears' attack to close higher yesterday, they've been building upon their gains earlier today too. Right now, they're in the vicinity of an important resistance level. Will they manage to break above it? We're not too far from opening a new trading position...
Oil Is Heading Higher. High Time to Open a New Position?
=====
Thank you.
Sincerely,
Przemyslaw Radomski, CFA
Editor-in-chief, Gold & Silver Fund Manager

