

Briefly: in our opinion, full (250% of the regular size of the position) speculative short position in gold, silver, and mining stocks are justified from the risk/reward point of view at the moment of publishing this Alert.
There hasn't been much of a tradable move happening in the precious metals, and it's perfectly understandable with all the focus on the upcoming Powell speech. Yet that doesn't happen in a vacuum - and highlighting that, we've expanded the helpful overview of the technical factors at play with one important addition. It's silver - and apart from that, we'll also talk the recent USD Index sign.
Gold has barely moved in the last few days. At the moment of writing these words, the yellow metal is a bit below where it was trading 24 hours and 48 hours ago.
The sessions have been similarly "exciting" in case of silver and mining stocks, so we have little to say about them. As we outlined yesterday, the lack of movement is more important in case of the USD Index as it has already confirmed the breakout above the May high.
It's the USD Index Again
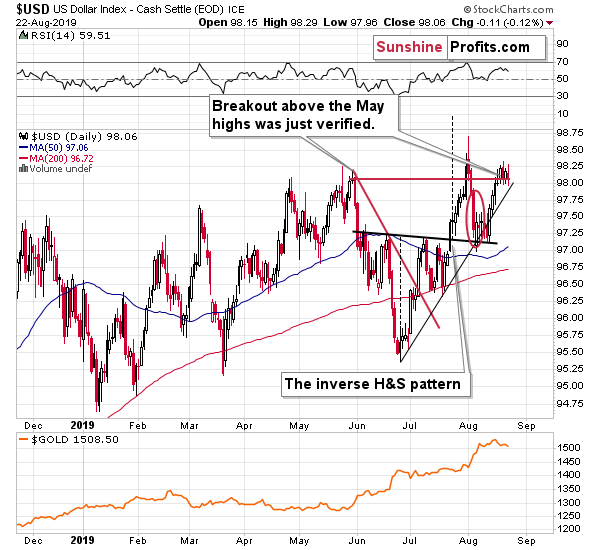
The U.S. currency moved a bit lower yesterday, but there was no invalidation of the breakout. The bullish case has therefore strengthened. Especially since that the rising support line which stopped the decline in early August, is now practically at hand. This means that the USD Index has little reason to move lower and many reasons to move higher (most of them being long-term based ones).
Jerome Powell will be speaking at the Jackson Hole conference today, which may be the reason due to which markets are reluctant to move. Investors are holding their breath, waiting to hear what Powell has to say. Especially that Trump has openly called for a 100 basis point rate cut and perhaps some quantitative easing over a fairly short period of time. Given such a dramatic call from the President of the United States of America, the markets should be reacting profoundly and the USD Index should be plunging. But it isn't. Conversely, it confirmed its breakout, which shows just how strong the USD is right now.
Please note that the market might be expecting too much from Powell at this point and his decisions as well as comments as Jackson hole, might result in USD's strength, just like they did in case of the 25 bp rate cut. Some investors expected a 50 bp cut, so what happened appeared hawkish compared to expectations. And he expectations might be too dovish once again, so even dovish comments might result in USD's rally. The technical picture has been pointing to higher USD values for a long time.
Silver's 2008 - Now Price Analogy
In yesterday's Gold & Silver Trading Alert, we featured links to our previous analyses that included key things that one should keep in mind. The number of factors that point to lower precious metals prices in the following months is astounding, and it's difficult to keep them all in mind simultaneously while the short-term volatility increases. It has been even difficult for us to list them all. In fact, it turns out that we didn't mention one of the very important factors that remains in place in the silver market. Let's catch up today.
The analogy that we didn't mention yesterday and that we should have mentioned is the price link between the 2008 and the 2016 - now period.
There is no meaningful link in case of time, or shape of the price moves, but if we consider the starting and ending points of the price moves that we saw in both cases, the link becomes obvious and very important.
But first - why do we bother with detecting similarities in a given market? Do they have to repeat themselves? The times are very different, after all.
That's one of the boomerang questions that we get every few months or more frequently. The very foundation of the technical analysis is that the markets repeat their behavior. The times change. The presidents and monetary authorities change, the interest rate change and so on, but what doesn't change is that people are motivated by fear and greed (and we don't mean it in a negative way - striving to secure one's personal and family financial safety - making their dreams come true, is a very noble goal). And people will react to fear and greed in relatively similar ways. Of course, there is no single type of reaction, there are multiple ways in which people react, but they are together form the reaction that we see play out over and over again. Smaller parts of the price moves are often called "patterns" or "formations" while bigger ones are trends. Seeing that one of them just formed, allows one to check the follow-up action, which was also usually alike. This means that it's likely that the same (or similar) kind of movement will take place once again.
Of course, some formations tend to work on one given market and some on another one. The longer one analyzes a given market, the more proficient they become at discovering specific price moves that are applicable to it. For instance, in general, people view strong daily performance on big volume as bullish. But it is usually the other way around in case of silver, especially, if gold is weak on that day.
Different parts of trends are characterized by different price formations e.g. it is more common for something to appear at the beginning of an uptrend (e.g. gold stocks outperforming gold) than at its end. If one is able to detect what kind of price move from the past is being repeated (to a considerable extent), then it is much easier to forecast what's likely ahead. One will know what kind of signals should they be looking for, and what kind of signals are not likely to be seen (thus, if they are seen, they serve as a huge red flag).
For instance, the 90s - now perfectly fits the multiple medium-term bearish signals that we saw recently. Gold's strength in the previous months might appear very bullish, but this is no longer the case once one realizes that the same thing took place at a similar time right before the final top.
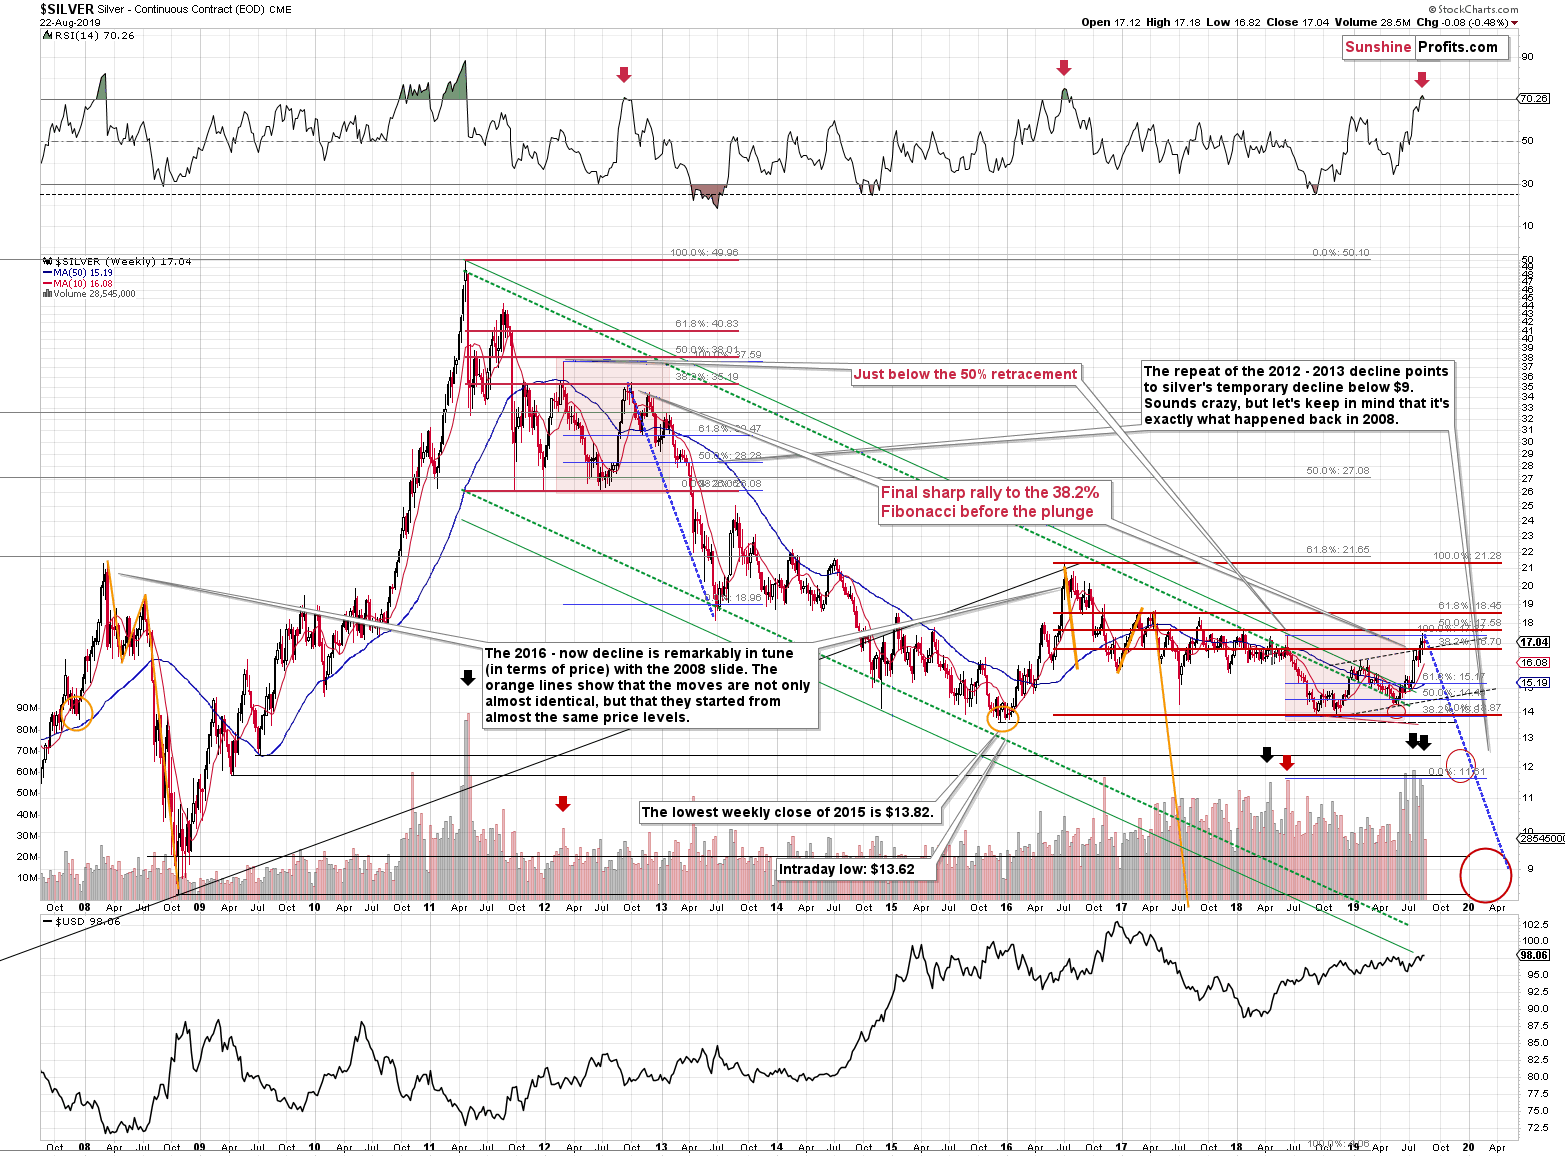
Having said that, let's take a look at what silver did in 2008 and what it's been doing since the 2016 top - the price similarities are uncanny.
The rallies that led to the 2008 and 2016 tops started at about $14 and we marked them both with orange ellipses. Then both rallies ended at about $21. Then they both declined to about $16. Then they both rallied by about $3. The 2008 top was a bit higher as it started from a bit higher level. And it was from these tops (the mid-2008 top and the early 2017 top) that silver started its final decline.
In 2008, silver kept on declining until it moved below $9. Right now, silver's medium-term downtrend is still underway. If it's not clear that silver remains in a downtrend, please note that the bottoms that are analogous to bottoms that gold recently reached, are the ones from late 2011 - at about $27. Silver topped close to $17.
The white metal hasn't completed the decline below $9 yet, and at the same time it didn't move above $19 - $21, which would invalidate the analogy. This means that the decline below $10, perhaps even below $9 is still underway.
Naturally, the implications for the following months are bearish.
Before summarizing, we would like to quote the points that we made previously along with the corresponding links, to ensure that they are not missed or forgotten:
Critical factors:
- The USD Index broke above the very long-term resistance line and verified the breakout above it. Its huge upswing is already underway.
- The USD's long-term upswing is an extremely important and bearish factor for gold. There were only two similar cases in the past few decades, when USD Index was starting profound, long-term bull markets, and they were both accompanied by huge declines in gold and the rest of the precious metals market
- Out of these two similar cases, only one is very similar - the case when gold topped in February 1996. The similarity extends beyond gold's about a yearly delay in reaction to the USD's rally. Also the shape of gold price moves prior to the 1996 high and what we saw in the last couple of years is very similar, which confirm the analysis of the gold-USD link and the above-mentioned implications of USD Index's long-term breakout.
- The similarity between now and 1996 extends to silver and mining stocks - in other words, it goes beyond USD, gold-USD link, and gold itself. The white metal and its miners appear to be in a similar position as well, and the implications are particularly bearish for the miners. After their 1996 top, they erased more than 2/3rds of their prices.
- Many investors got excited by the gold-is-soaring theme in the last few months, but looking beyond the short-term moves, reveals that most of the precious metals sector didn't show substantial strength that would be really visible from the long-term perspective. Gold doesn't appear to be starting a new bull market here, but rather to be an exception from the rule.
Very important, but not as critical factors:
- Long-term technical signs for silver, i.a. the analogy in terms of price to what we saw in 2008, shows that silver could slide even below $10.
- Silver's very long-term cycles point to a major reversal taking place right now and since the most recent move was up, the implications are bearish (this is also silver's technical sign, but it's so important that it deserves its own point)
- Long-term technical signs for gold stocks point to this not being a new gold bull market beginning. Among others, it's their long-term underperformance relative to gold that hint this is rather a corrective upswing within a bear market that is not over yet.
- Record-breaking weekly volume in gold is a strong sign pointing to lower gold prices
Important factors:
- Extreme volume reading in the SIL ETF (proxy for silver stocks) is an effective indication that lower values of silver miners are to be expected
- Silver's short-term outperformance of gold, and gold stocks' short-term underperformance of gold both confirm that the precious metals sector is topping here
- Gold topped almost right at its cyclical turning point, which makes the trend reversal more likely
- Copper broke below its head-and-shoulders pattern and confirmed the breakdown. The last time we saw something similar was in April 2013, when the entire precious metals sector was on the verge of plunging lower.
Moreover, please note that while there may be a recession threat, it doesn't mean that gold has to rally immediately. Both: recession and gold's multi-year rally could be many months away - comparing what happened to bond yields in the 90s confirms that.
Summary
Summing up, taking the big investment picture into account, out of the following: gold, silver, gold stocks, silver stocks, the recent upswing was visible only in case of gold. Most of the precious metals portfolio: silver, gold miners, and silver miners suggest that what we saw in the last several months is nothing more than a corrective upswing within a bigger downtrend. There are multiple signs pointing to much lower precious metals and mining stocks prices in the following weeks and months and we have listed them in today's Gold & Silver Trading Alert. To make a long story short, one should be prepared for much lower, not higher precious metals prices in the following months.
As always, we'll keep you - our subscribers - informed.
To summarize:
Trading capital (supplementary part of the portfolio; our opinion): Full speculative short position (250% of the full position) in gold, silver, and mining stocks is justified from the risk/reward perspective with the following stop-loss orders and exit profit-take price levels:
- Gold: profit-take exit price: $1,241; stop-loss: $1,552; initial target price for the DGLD ETN: $51.87; stop-loss for the DGLD ETN $25.37
- Silver: profit-take exit price: $13.81; stop-loss: $17.73; initial target price for the DSLV ETN: $39.08; stop-loss for the DSLV ETN $18.27
- Mining stocks (price levels for the GDX ETF): profit-take exit price: $17.61; stop-loss: $33.37; initial target price for the DUST ETF: $32.28; stop-loss for the DUST ETF $5.78
In case one wants to bet on junior mining stocks' prices (we do not suggest doing so - we think senior mining stocks are more predictable in the case of short-term trades - if one wants to do it anyway, we provide the details), here are the stop-loss details and target prices:
- GDXJ ETF: profit-take exit price: $23.71; stop-loss: $48.42
- JDST ETF: profit-take exit price: $73.32 stop-loss: $9.67
Long-term capital (core part of the portfolio; our opinion): No positions (in other words: cash)
Insurance capital (core part of the portfolio; our opinion): Full position
Whether you already subscribed or not, we encourage you to find out how to make the most of our alerts and read our replies to the most common alert-and-gold-trading-related-questions.
Please note that the in the trading section we describe the situation for the day that the alert is posted. In other words, it we are writing about a speculative position, it means that it is up-to-date on the day it was posted. We are also featuring the initial target prices, so that you can decide whether keeping a position on a given day is something that is in tune with your approach (some moves are too small for medium-term traders and some might appear too big for day-traders).
Plus, you might want to read why our stop-loss orders are usually relatively far from the current price.
Please note that a full position doesn't mean using all of the capital for a given trade. You will find details on our thoughts on gold portfolio structuring in the Key Insights section on our website.
As a reminder - "initial target price" means exactly that - an "initial" one, it's not a price level at which we suggest closing positions. If this becomes the case (like it did in the previous trade) we will refer to these levels as levels of exit orders (exactly as we've done previously). Stop-loss levels, however, are naturally not "initial", but something that, in our opinion, might be entered as an order.
Since it is impossible to synchronize target prices and stop-loss levels for all the ETFs and ETNs with the main markets that we provide these levels for (gold, silver and mining stocks - the GDX ETF), the stop-loss levels and target prices for other ETNs and ETF (among other: UGLD, DGLD, USLV, DSLV, NUGT, DUST, JNUG, JDST) are provided as supplementary, and not as "final". This means that if a stop-loss or a target level is reached for any of the "additional instruments" (DGLD for instance), but not for the "main instrument" (gold in this case), we will view positions in both gold and DGLD as still open and the stop-loss for DGLD would have to be moved lower. On the other hand, if gold moves to a stop-loss level but DGLD doesn't, then we will view both positions (in gold and DGLD) as closed. In other words, since it's not possible to be 100% certain that each related instrument moves to a given level when the underlying instrument does, we can't provide levels that would be binding. The levels that we do provide are our best estimate of the levels that will correspond to the levels in the underlying assets, but it will be the underlying assets that one will need to focus on regarding the signs pointing to closing a given position or keeping it open. We might adjust the levels in the "additional instruments" without adjusting the levels in the "main instruments", which will simply mean that we have improved our estimation of these levels, not that we changed our outlook on the markets. We are already working on a tool that would update these levels on a daily basis for the most popular ETFs, ETNs and individual mining stocks.
Our preferred ways to invest in and to trade gold along with the reasoning can be found in the how to buy gold section. Additionally, our preferred ETFs and ETNs can be found in our Gold & Silver ETF Ranking.
As a reminder, Gold & Silver Trading Alerts are posted before or on each trading day (we usually post them before the opening bell, but we don't promise doing that each day). If there's anything urgent, we will send you an additional small alert before posting the main one.
=====
Latest Free Trading Alerts:
The yield curve has inverted. It suggests that we are about one year before the recession. How should the yellow metal behave in such a period? We invite you to read our today's article and find out how gold is likely to behave in the pre-recession world.
=====
Thank you.
Sincerely,
Przemyslaw Radomski, CFA
Editor-in-chief, Gold & Silver Fund Manager

