

Briefly: in our opinion, full (250% of the regular size of the position) speculative short position in gold, silver, and mining stocks are justified from the risk/reward point of view at the moment of publishing this Alert.
Similarly to Thursday, Friday's session didn't bring much of precious metals' moves. There's little new to say on the day-to-day action in the USD Index as well. But there is a specific pattern of price moves to comment on. The zigzag. In today's Alert, we'll look at it both from the short-term and long-term gold perspective.
As implied, today's Alert is once again going to be relatively short. As barely anything happened on Friday either in the precious metals market or in the currency market, it means that everything that we wrote on Thursday remains up-to-date. The same goes for the long-term factors visible on the long-term silver chart, gold to silver ratio chart, gold stocks to gold ratio chart, and the long-term HUI Index chart. Please click on the above links for details.
But there are two charts that we would like to discuss today. They both feature a specific chart pattern - zigzags. The first chart is based on the very short-term gold price movement.
Examination of a Short-Term Zigzag
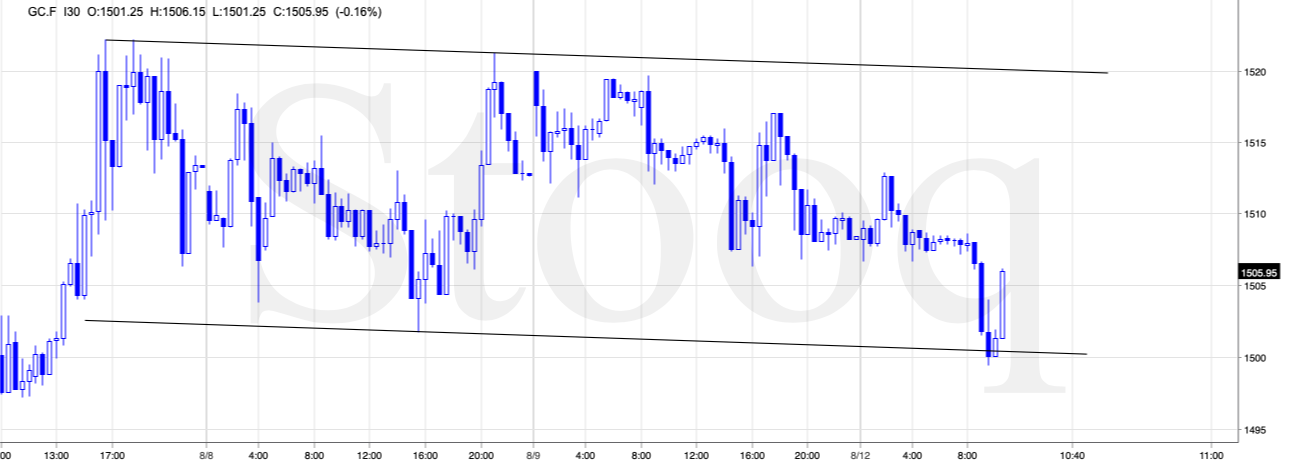
After rallying above $1,520 and triggering our short positions (moving to $1,519), gold futures (that's what the above chart features) declined and moved back almost to the $1,500 level. Then they rallied almost reaching the previous intraday highs and then they declined once again. In today's pre-market trading gold moved insignificantly below $1,500 and then rallied back above it. This means that gold futures are verifying the breakout above the $1,500 level, while spot gold (for instance based on kitco's prices) has already invalidated this move.
The parallel lines that create a trend channel are one of the ways to show if the sizes of moves are similar or not. If the lines are parallel, then a move that starts at one of them, then takes approximately similar amount of time and ends at the other line, is just as or almost just as big as a different move that can be described in the above way. That's what a zigzag is. That's a form of consolidation and something that is likely to be followed by the continuation of the preceding move.
There's also a different way to approach zigzags, but we'll get back to it while discussing the second chart. For now, let's stay with the implications of the above picture. It is bullish for the very short term. Not only because of the zigzag, but because of the verification of the breakout above $1,500 in case of gold futures. Spot gold remains below $1,500 at the moment of writing these words, so the situation is not as clearly bullish for the very short-term as it appears to be. One of the reasons is that the above zigzag is not the only one that's currently in play.
Please take a look at the chart below, focusing on the green dashed lines in 2016 and 2017.
Anatomy of a Long-Term Zigzag
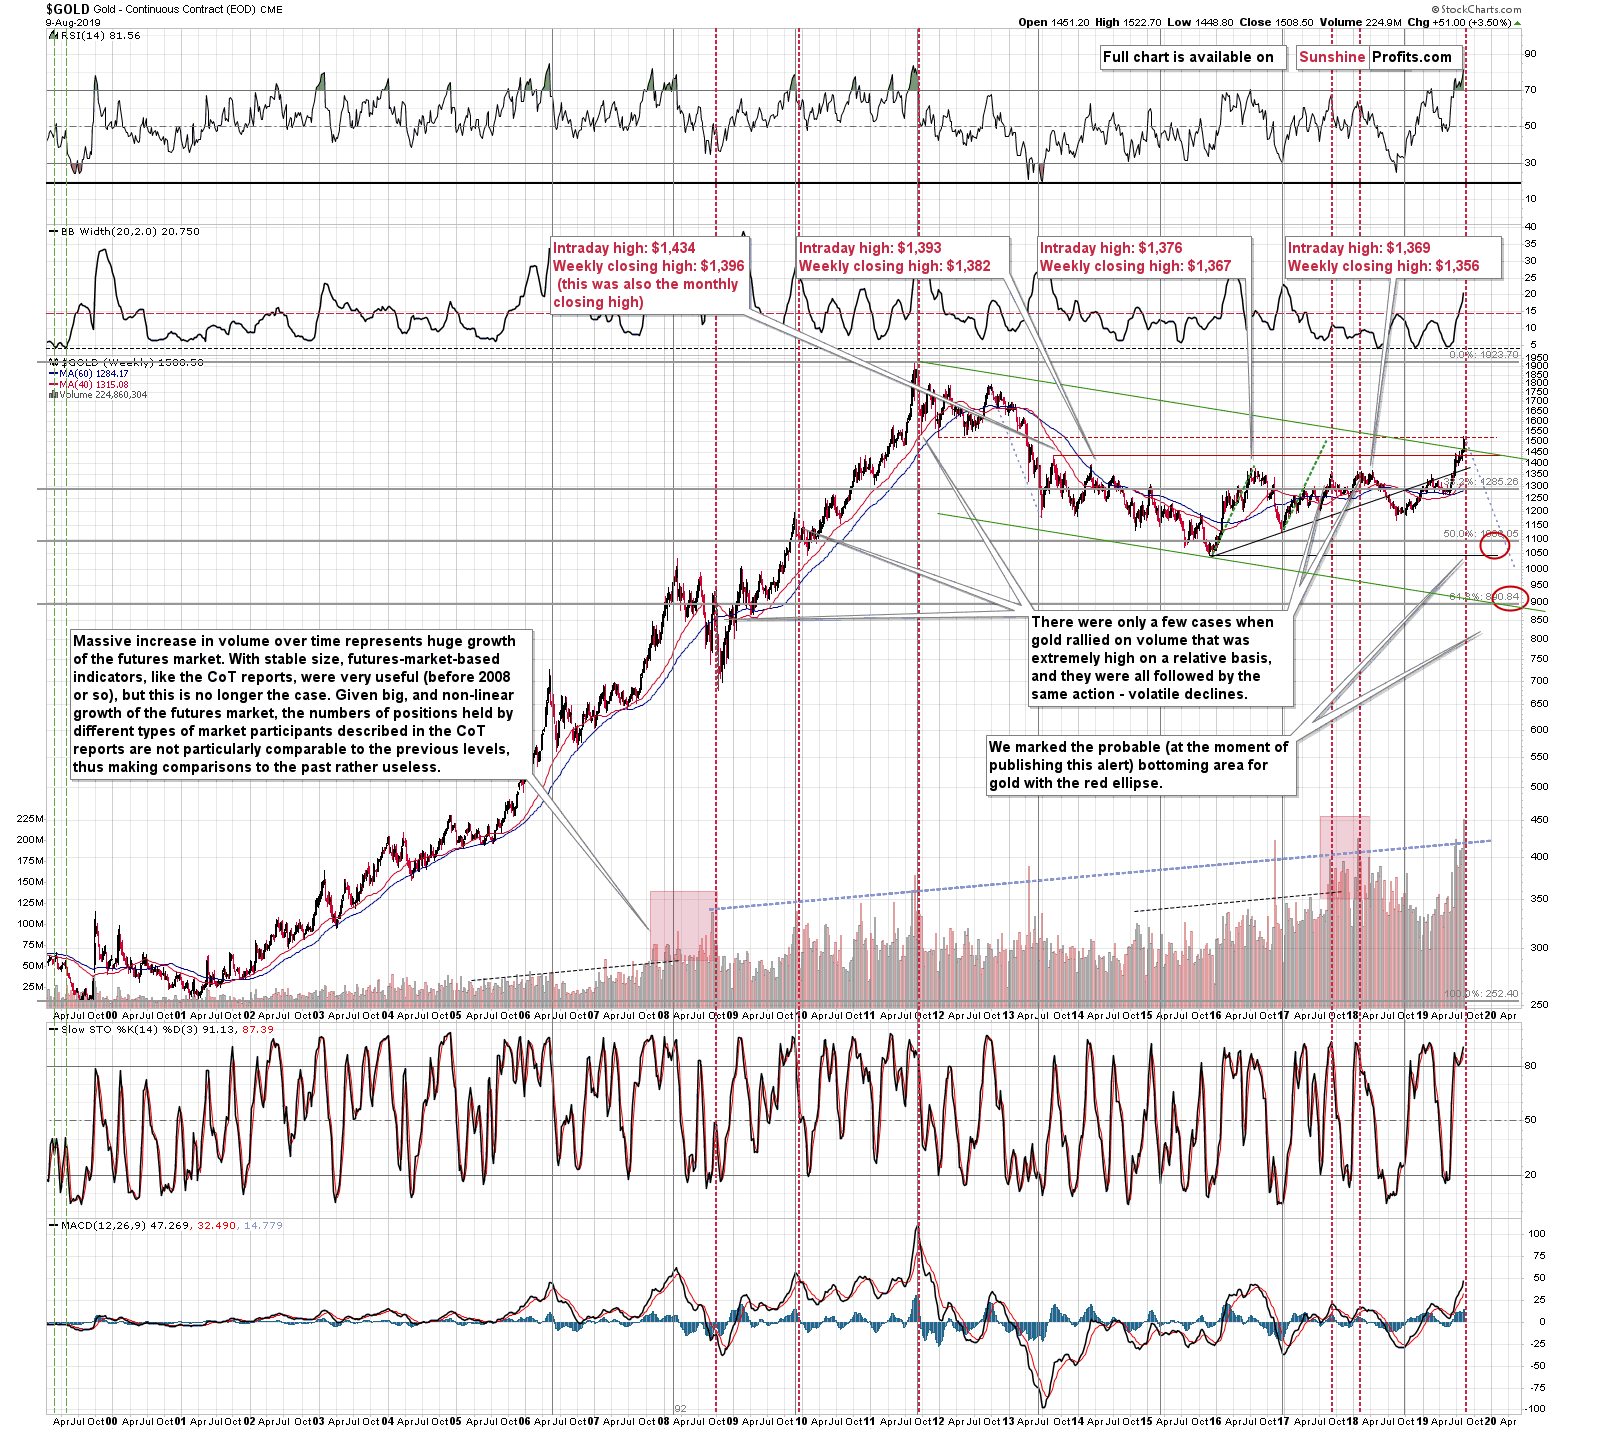
Another way to draw zigzag patterns is to check the size of one price move and copy it to the starting point of a different move. The moves that are similar in terms of size, can be viewed as a zigzag.
The move that we saw in 2016 was big and it was followed by a decline that was almost just as big. The late-2016 bottom was the start of another rally. In a way, this rally ended in 2017, but taking a broader point of view shows that one might view the most recent upswing in gold as the (likely final) part of the move that started back then.
The 2016 rally and the late-2016 - August 2019 upswings are almost identical in terms of size. This means that they create a very long-term zigzag and this has important consequences since zigzags are a form of consolidation and are likely to be followed by the price moves that are similar to the ones that preceded them. And what preceded the late-2015 - now zigzag? The approximately $900 decline in gold. While we don't expect gold to decline by $900, a massive decline in gold's price does appear to be in the cards.
There's one more thing that we would like to discuss - the weekly volume that we just saw. It was the highest weekly volume ever recorded in gold. This shows how red-hot the gold market has just become. That may seem bullish, but it's very far from it.
The above shows great excitement about the gold price moves and it is exactly when the excitement reaches the zenith that that major price tops are formed. That's the theory. And what about practice? The red vertical lines show cases when we saw massive spikes in gold's volume. In almost all cases gold formed major tops and declined in the following weeks and months.
The volume increases over time and that's what the rising blue line shows. We created it based on the 2008 volume high and the 2011 volume high. This line was broken to the upside only in early 2018 and right now. The previous case marked a major top in gold and we can expect the same thing right now.
Of course, with conflicting zigzag implications it's easy to get lost. Which signs should one trust and which should one view as temporary? In general, the more long-term signal is, the more important it is and the more profound its implications are. However, the very short-term indications may drive the price in the very short- term (in the matter of hours, for instance). This means that while the shape of today's session is not clear, we should expect to see much lower gold, silver, and mining stocks prices in the following weeks.
Summary
Summing up, we wrote about opening the short positions in gold, silver, and mining stocks based on gold reaching $1,519 without any other conditions, but based on silver's and miners' movement, we see that this was most likely a good decision. From the long-term point of view, it appears that the recent move higher in gold was fake and that the next big move will be to the downside, just as other parts of the precious metals market suggest. The big picture of silver and mining stocks, key precious metals ratios that we covered last week, and the USD Index all point to much lower precious metals prices in the following months. Based on how silver and mining stocks moved last Wednesday, we also have the very short-term confirmation of the bearish scenario.
As always, we'll keep you - our subscribers - informed.
To summarize:
Trading capital (supplementary part of the portfolio; our opinion): Full speculative short position (250% of the full position) in gold, silver, and mining stocks is justified from the risk/reward perspective with the following stop-loss orders and exit profit-take price levels:
- Gold: profit-take exit price: $1,241; stop-loss: $1,552; initial target price for the DGLD ETN: $51.87; stop-loss for the DGLD ETN $25.37
- Silver: profit-take exit price: $13.81; stop-loss: $17.53; initial target price for the DSLV ETN: $39.08; stop-loss for the DSLV ETN $20.67
- Mining stocks (price levels for the GDX ETF): profit-take exit price: $17.61; stop-loss: $33.37; initial target price for the DUST ETF: $32.28; stop-loss for the DUST ETF $5.78
In case one wants to bet on junior mining stocks' prices (we do not suggest doing so - we think senior mining stocks are more predictable in the case of short-term trades - if one wants to do it anyway, we provide the details), here are the stop-loss details and target prices:
- GDXJ ETF: profit-take exit price: $23.71; stop-loss: $48.42
- JDST ETF: profit-take exit price: $73.32 stop-loss: $9.67
Long-term capital (core part of the portfolio; our opinion): No positions (in other words: cash)
Insurance capital (core part of the portfolio; our opinion): Full position
Whether you already subscribed or not, we encourage you to find out how to make the most of our alerts and read our replies to the most common alert-and-gold-trading-related-questions.
Please note that the in the trading section we describe the situation for the day that the alert is posted. In other words, it we are writing about a speculative position, it means that it is up-to-date on the day it was posted. We are also featuring the initial target prices, so that you can decide whether keeping a position on a given day is something that is in tune with your approach (some moves are too small for medium-term traders and some might appear too big for day-traders).
Plus, you might want to read why our stop-loss orders are usually relatively far from the current price.
Please note that a full position doesn't mean using all of the capital for a given trade. You will find details on our thoughts on gold portfolio structuring in the Key Insights section on our website.
As a reminder - "initial target price" means exactly that - an "initial" one, it's not a price level at which we suggest closing positions. If this becomes the case (like it did in the previous trade) we will refer to these levels as levels of exit orders (exactly as we've done previously). Stop-loss levels, however, are naturally not "initial", but something that, in our opinion, might be entered as an order.
Since it is impossible to synchronize target prices and stop-loss levels for all the ETFs and ETNs with the main markets that we provide these levels for (gold, silver and mining stocks - the GDX ETF), the stop-loss levels and target prices for other ETNs and ETF (among other: UGLD, DGLD, USLV, DSLV, NUGT, DUST, JNUG, JDST) are provided as supplementary, and not as "final". This means that if a stop-loss or a target level is reached for any of the "additional instruments" (DGLD for instance), but not for the "main instrument" (gold in this case), we will view positions in both gold and DGLD as still open and the stop-loss for DGLD would have to be moved lower. On the other hand, if gold moves to a stop-loss level but DGLD doesn't, then we will view both positions (in gold and DGLD) as closed. In other words, since it's not possible to be 100% certain that each related instrument moves to a given level when the underlying instrument does, we can't provide levels that would be binding. The levels that we do provide are our best estimate of the levels that will correspond to the levels in the underlying assets, but it will be the underlying assets that one will need to focus on regarding the signs pointing to closing a given position or keeping it open. We might adjust the levels in the "additional instruments" without adjusting the levels in the "main instruments", which will simply mean that we have improved our estimation of these levels, not that we changed our outlook on the markets. We are already working on a tool that would update these levels on a daily basis for the most popular ETFs, ETNs and individual mining stocks.
Our preferred ways to invest in and to trade gold along with the reasoning can be found in the how to buy gold section. Additionally, our preferred ETFs and ETNs can be found in our Gold & Silver ETF Ranking.
As a reminder, Gold & Silver Trading Alerts are posted before or on each trading day (we usually post them before the opening bell, but we don't promise doing that each day). If there's anything urgent, we will send you an additional small alert before posting the main one.
=====
Latest Free Trading Alerts:
Friday's trading session was bearish, as stock retraced their Thursday's advance. However, the S&P 500 index remained above the 2,900 mark. So will the short-term uptrend reverse? Or is this just a downward correction before another leg up?
Are Stocks Turning Lower Again?
=====
Thank you.
Sincerely,
Przemyslaw Radomski, CFA
Editor-in-chief, Gold & Silver Fund Manager

