

Briefly: in our opinion, full (250% of the regular size of the position) speculative short position in gold, silver, and mining stocks are justified from the risk/reward point of view at the moment of publishing this Alert.
Miners' moved higher, but the extent of this move is nowhere similar to what we just saw in case of silver. Some will emphasize the breakout above the early August highs, while some will say that the recent rally is still nothing to call home about because it's much smaller than the one that we saw in 2016. Who's right?
It's tempting to say that the former as a breakout is a breakout. However, the long-term factors are more important than short-term ones. And the long-term chart shows that...
Gold Stocks - Long-term Overview
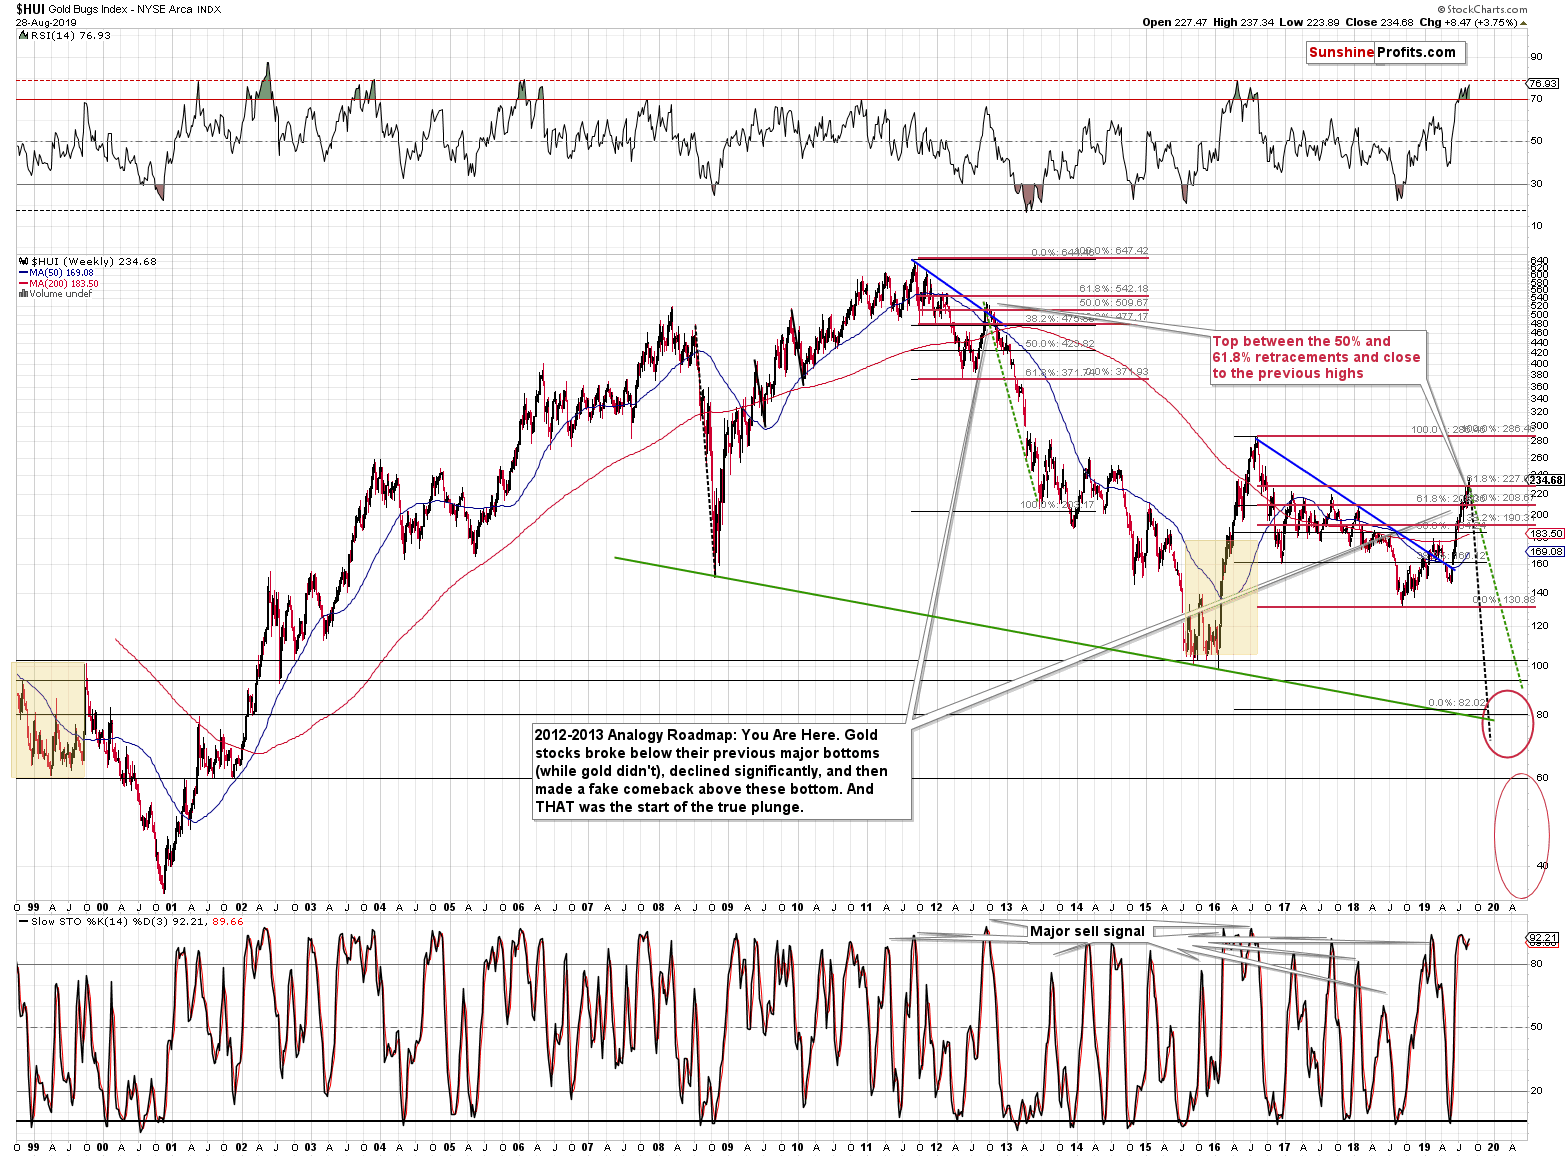
That the breakout above the previous highs and the 61.8% Fibonacci retracement has not been confirmed. Last week's closing price was 226.21 and the 61.8% Fibonacci retracement is a bit above 227. This means that we haven't even seen a single weekly close above the 61.8% retracement, which serves as a major resistance level. Back in 2012, it was this retracement that remained unbroken just before the huge decline in the mining stocks (and the rest of the PM sector) started. The current small breakout above it doesn't imply anything just yet. The mining stocks' upswing is still relatively small compared to size of the rally in gold.
Moreover, please note that the RSI Indicator is showing extremely overbought readings, just as it did during the previous major tops. The last time the RSI was this high, was in 2016, after which the HUI declined by more than 120 index points in about 4 months.
Gold's Reversal and Seasonality
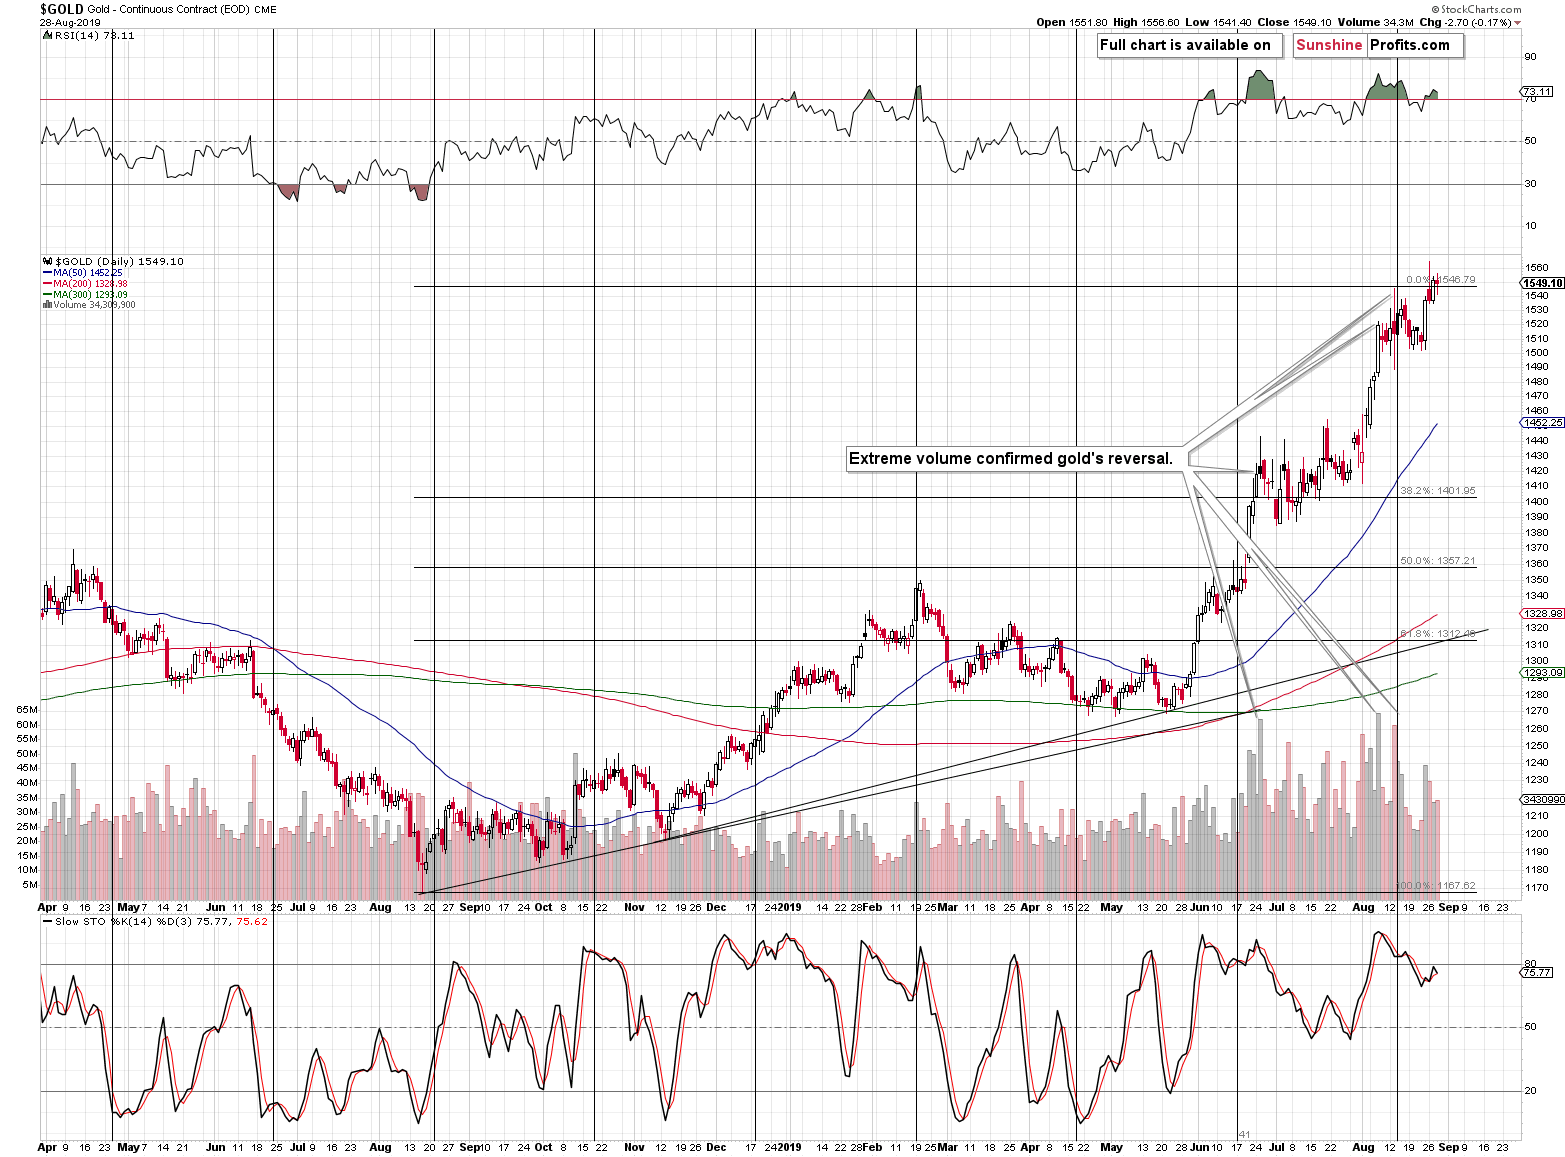
Meanwhile, the price of gold moving back and forth after Monday's powerful reversal suggests that the top might already be in. There are only two sessions left in August, and then following - Tuesday's - session will be the first one after the U.S. Labor Day.
This means that the powerful seasonality is about to kick in and the currently heavily overbought prices of gold, silver, and mining stocks are likely to decline. Gold's performance this month is very similar to what might expect based on the True Seasonal patterns that we discussed on Tuesday - gold consolidated in mid-August and it seems to have topped on Monday.
In fact, this part of Tuesday's analysis still remains so important and timely to quote it:
The key thing is that something special is often happening on the gold market around the U.S. Labor Day. In almost all cases, gold is either topping or already after a nearby top. In other words, it's perfectly set for a major decline in the following weeks, and sometimes, months.
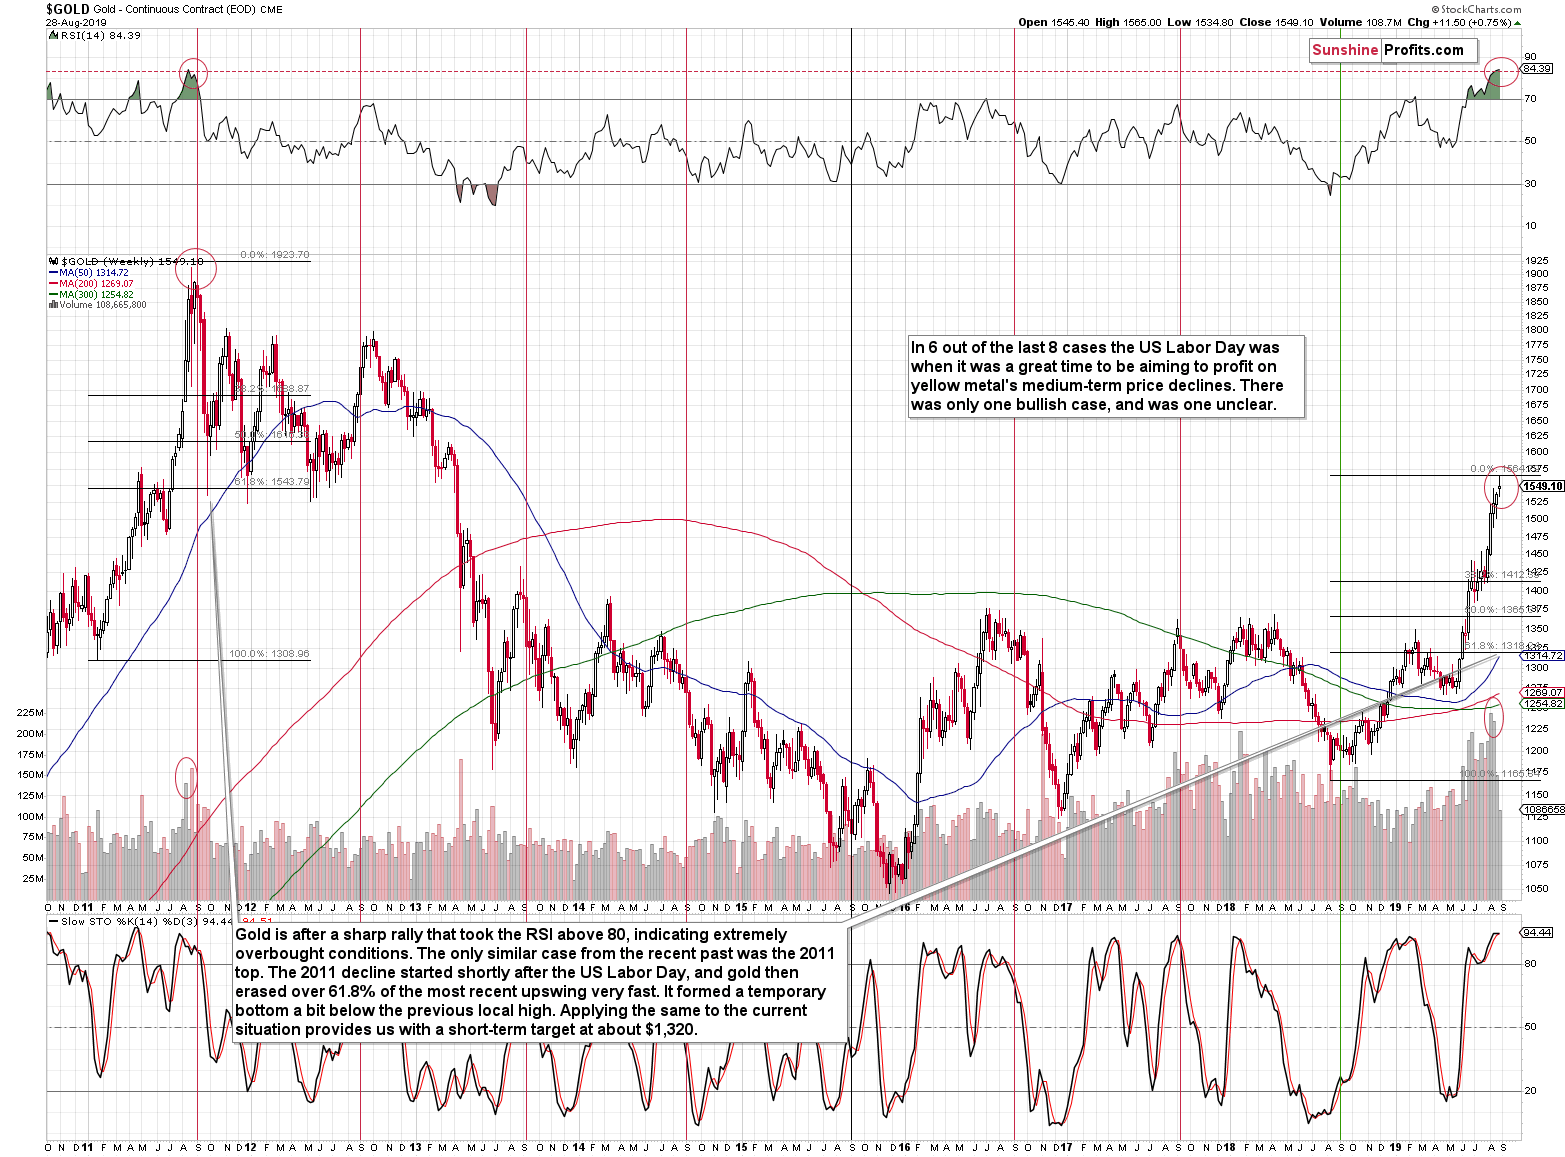
6 out of the last 8 U.S. Labor Days were a great time to profit on yellow metal's medium-term price declines. There was only one bullish case (in 2018), and was one unclear (in 2015, when gold moved higher in the short run, but then declined anyway). Consequently, it appears that it's high time for gold to end its recent rally.
This analogy in terms of time as a building bridge to yet another analogy becomes obvious once you take a look at the RSI indicator in the upper part of the chart. It's currently above the 80 level. There was only one other case in the previous years when we saw something similar. It was at the 2011 top.
The 2011 top is usually just mentioned as the 2011 top, or THE top, as it was the most prominent high of the past decades, so there's no way to mistake it for a different high. Consequently, it's easy to forget when did exactly this top take place. The initial high took place on August 23, 2011, and the final (THE) top took place on September 6, 2011 (the first session after the U.S. Labor Day).
Interestingly, the August 13, 2019 session was very volatile overall, which might be similar (to a smaller extent, but still) to the initial August 2011 top.
To summarize, gold is after a sharp rally that took the RSI above 80, indicating extremely overbought conditions, and the only similar case from the recent past is the 2011 top. The 2011 decline started shortly after the U.S. Labor Day, and gold then erased over 61.8% of its most recent upswing - and very fast. It formed a temporary bottom a bit below the previous local high. Gold didn't move to its 50-day moving average at that time.
The 61.8% Fibonacci retracement of the most recent rally is at $1,318. The most recent local high is at about $1,350. The 50-day moving average is at about $1,315 right now. Consequently, applying the 2011 details to the current situation provides us with a short-term target at about $1,320.
This is where gold is likely to move next before bouncing. It's likely to then decline once again, but since no market moves up or down in a straight line, we're adjusting our exit target for the current short position to accommodate the above - we're moving them to $1,332, in order to maximize the chance of realizing the trade.
Before summarizing, please note that if we discount all the price moves surrounding the early September without looking exactly at this particular date, we get a picture in which gold might be topping right now or a one in which it has already topped.
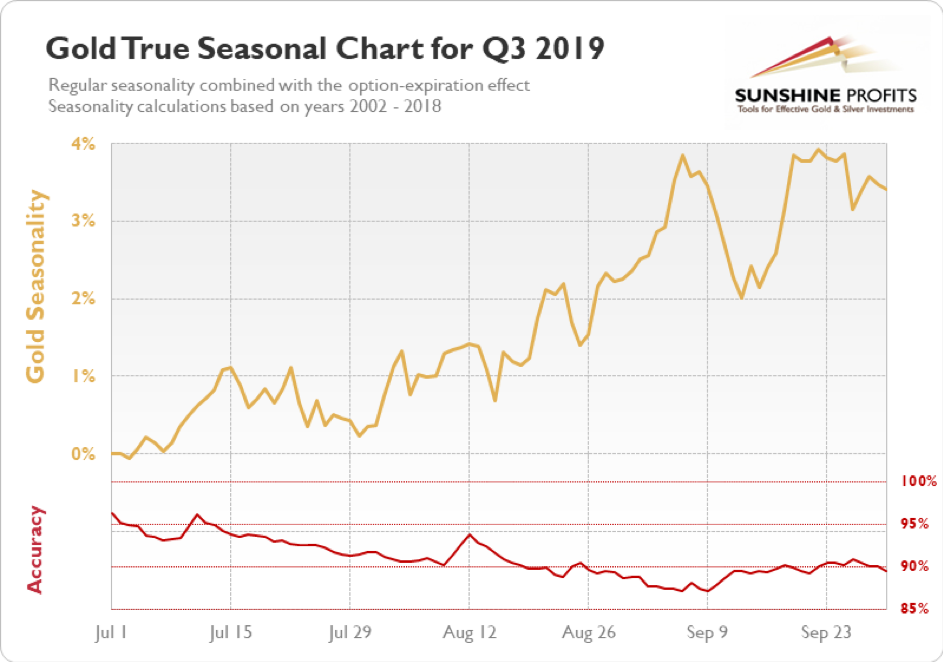
Our gold seasonality charts show that the rally in the yellow metal might already be over. The accuracy of the prediction (i.e. the difference between the previous cases) is relatively big right now, so it's unclear whether the top is already in or not, but please note how the accuracy rises after the first part of September, along with lower predicted gold prices. This means that whenever the top forms (whether it formed yesterday, will it form on Tuesday right after the U.S. Labor Day, or anytime in between), gold is already likely to be much lower in mid-September.
Gold is extremely likely to roll over shortly and its recent hesitation to move higher after Monday's reversal confirms it.
What about silver? Our yesterday's analysis covered silver's pre-market moves and it remains generally up-to-date:
Silver and the Mid-90s Analogy
We previously commented on the above charts in the following way:
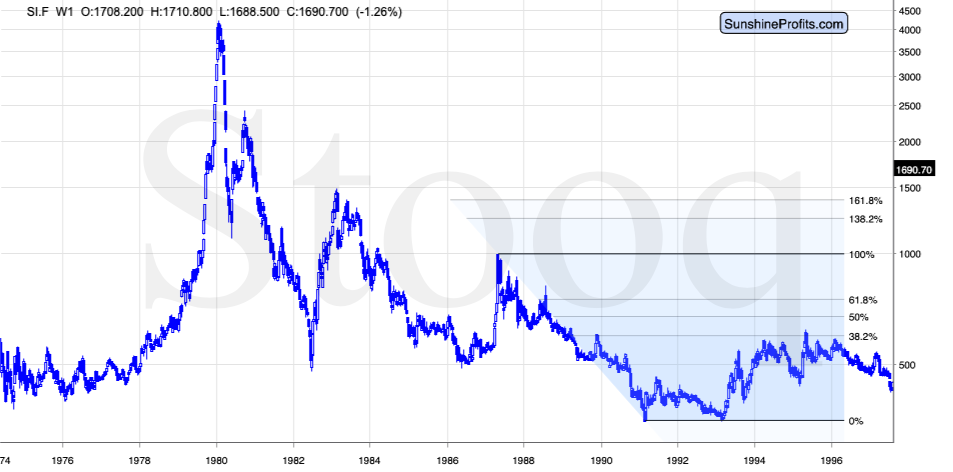
The moves are not identical, but they are very similar. The most notable difference is that in the early 1990s, silver broke below the previous lows, and in the 2018 it didn't. This might be the reason why silver moved relatively higher in mid-90s than it did right now.
The lower chart ends in 1996, the top is the February 1996 top - just when gold topped. Can we see similarities to the current situation? Definitely. Silver moved above the recent short-term highs, but it didn't move above or even to the more distant highs (1987 and 2016). In fact, in both cases, silver moved a bit above the 38.2% Fibonacci retracement based on the decline from the most recent prominent high (1987 and 2016), but not above the 50% retracement.
The early 1996 top in silver was the final chance to exit one's long positions and perhaps enter short positions.
Therefore, the analogy that we discovered in case of gold and the USD Index is perfectly confirmed, by what we saw in silver.
(...)
The thing that changed is that right now silver moved above the 50% Fibonacci retracement based on the 2016 - 2018 decline. Does it invalidate the link? It doesn't. There's also an additional way to look at what price level approximately stopped the rally during mid-90s. Namely, silver continued to move higher until it reached the most recent local top that preceded the final previous decline. That was the 1989 top. Back then, there was only one single top that was so characteristic. Right now, we have several such tops: The 2018 high, the mid-2017 high, and the 2017 high, and the late 2016 high. They are all relatively close to the classic Fibonacci retracement levels, which makes them comparable to the 1989 top.
What does it all mean? It means that silver's move to approximately the 61.8% Fibonacci retracement level and to the 2017 highs doesn't invalidate the mid-90s - now link. Consequently, the list of major factors that point to lower precious metals prices in the following months remains up-to-date. This means that the outlook didn't change either.
What it does mean, is that it tells us where silver could stop its rally and... This level was just reached today. Silver futures prices moved to $18.50 and at the moment of writing these words, silver futures are trading at $18.45. The intraday 2017 high was $18.65 and the high in terms of the daily closing prices was $18.54. This means that not only does the mid-90s - now link remain intact, but that the upside potential for silver seems to be very limited in the short run.
Silver moved to $18.62 yesterday and it closed the day at $18.46. This continues to fit the above-mentioned resistance levels. Today's pre-market high was $18.74, but silver then retraced back to $18.55. The fact that there was no close above $18.54 is the most important thing.
And what's even more important is that even if there is a close slightly above the $18.54 2017 high, the silver price would need to withstand the powerful seasonality in the next several days, which is extremely doubtful.
Before summarizing, let's take a look at the short-term silver - gold dynamics.
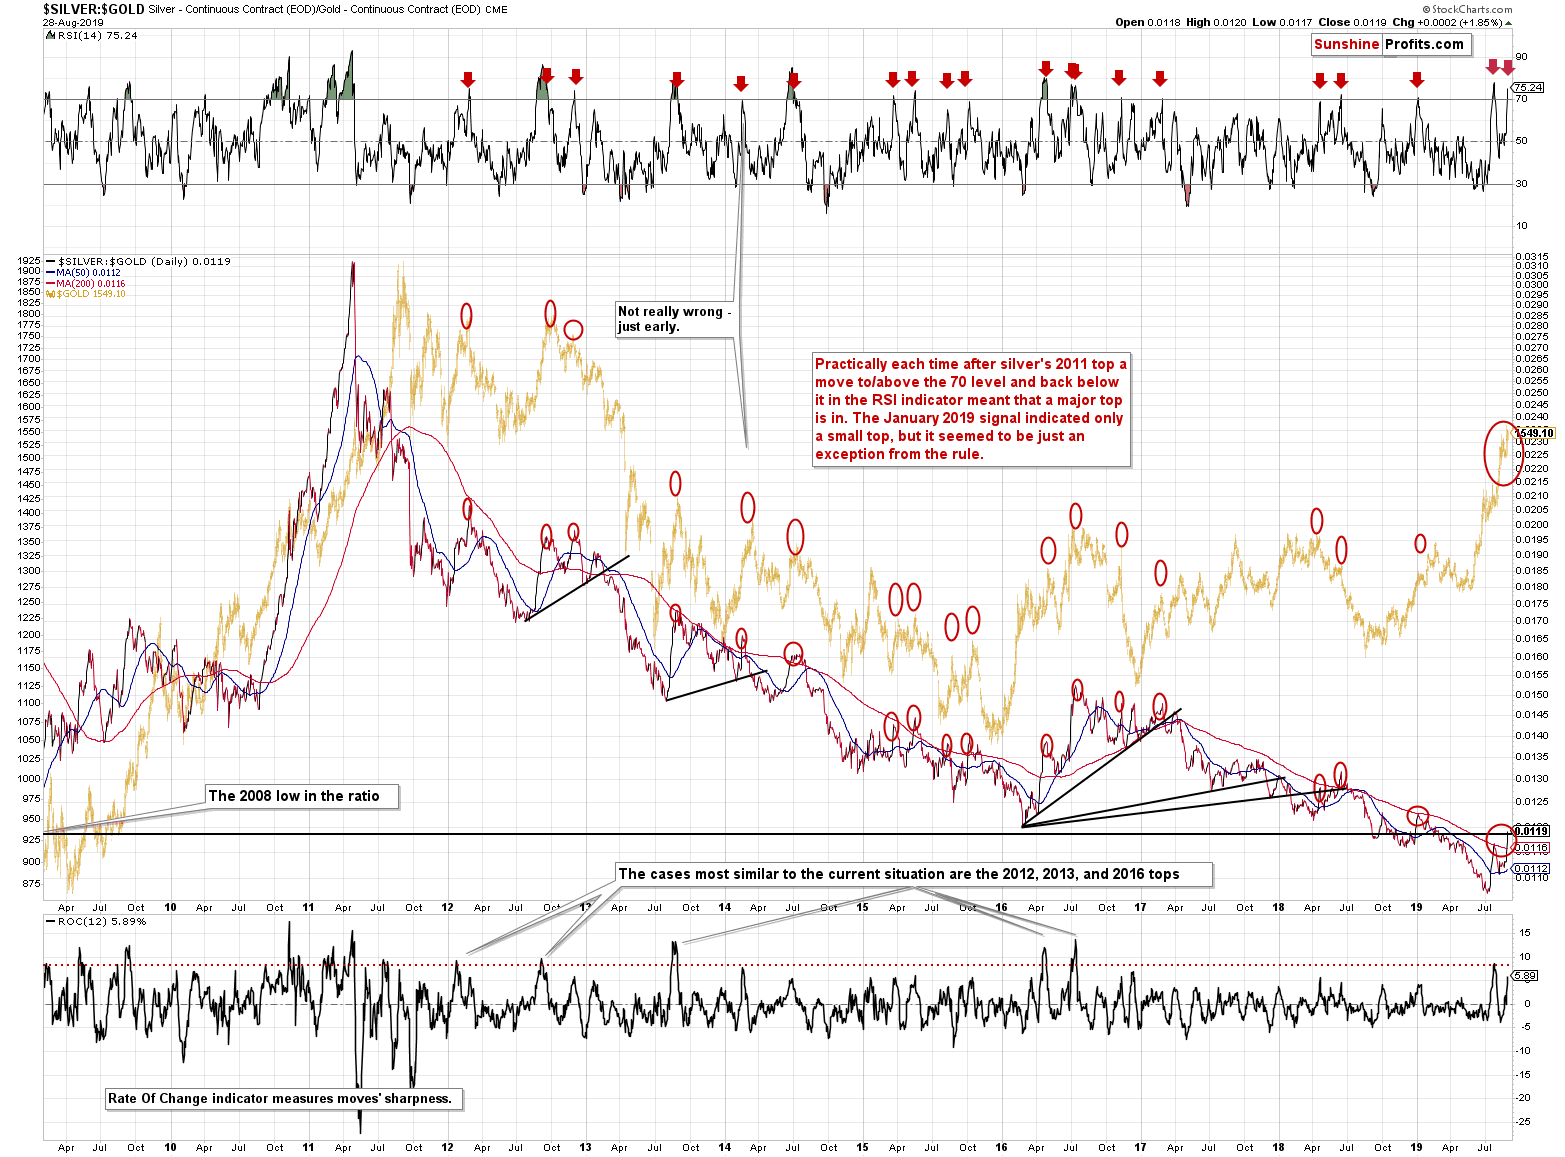
As you can see in the upper part of the silver to gold ratio chart, the RSI indicator rallied above 70. In almost each case when it then declined back below 70, it confirmed a major top in gold and the rest of the precious metals sector. Only a little weakness will most likely be enough to trigger this waterfall selling. And there are quite a few factors that point to this kind of selling in the near future:
Key Factors to Keep in Mind
Critical factors:
- The USD Index broke above the very long-term resistance line and verified the breakout above it. Its huge upswing is already underway.
- The USD's long-term upswing is an extremely important and bearish factor for gold. There were only two similar cases in the past few decades, when USD Index was starting profound, long-term bull markets, and they were both accompanied by huge declines in gold and the rest of the precious metals market
- Out of these two similar cases, only one is very similar - the case when gold topped in February 1996. The similarity extends beyond gold's about a yearly delay in reaction to the USD's rally. Also the shape of gold price moves prior to the 1996 high and what we saw in the last couple of years is very similar, which confirm the analysis of the gold-USD link and the above-mentioned implications of USD Index's long-term breakout.
- The similarity between now and 1996 extends to silver and mining stocks - in other words, it goes beyond USD, gold-USD link, and gold itself. The white metal and its miners appear to be in a similar position as well, and the implications are particularly bearish for the miners. After their 1996 top, they erased more than 2/3rds of their prices.
- Many investors got excited by the gold-is-soaring theme in the last few months, but looking beyond the short-term moves, reveals that most of the precious metals sector didn't show substantial strength that would be really visible from the long-term perspective. Gold doesn't appear to be starting a new bull market here, but rather to be an exception from the rule.
- Gold's True Seasonality around the US Labor Day points to a big decline shortly. Moreover, it was the very first session after the 2011 US Labor Day that marked THE top for gold
Very important, but not as critical factors:
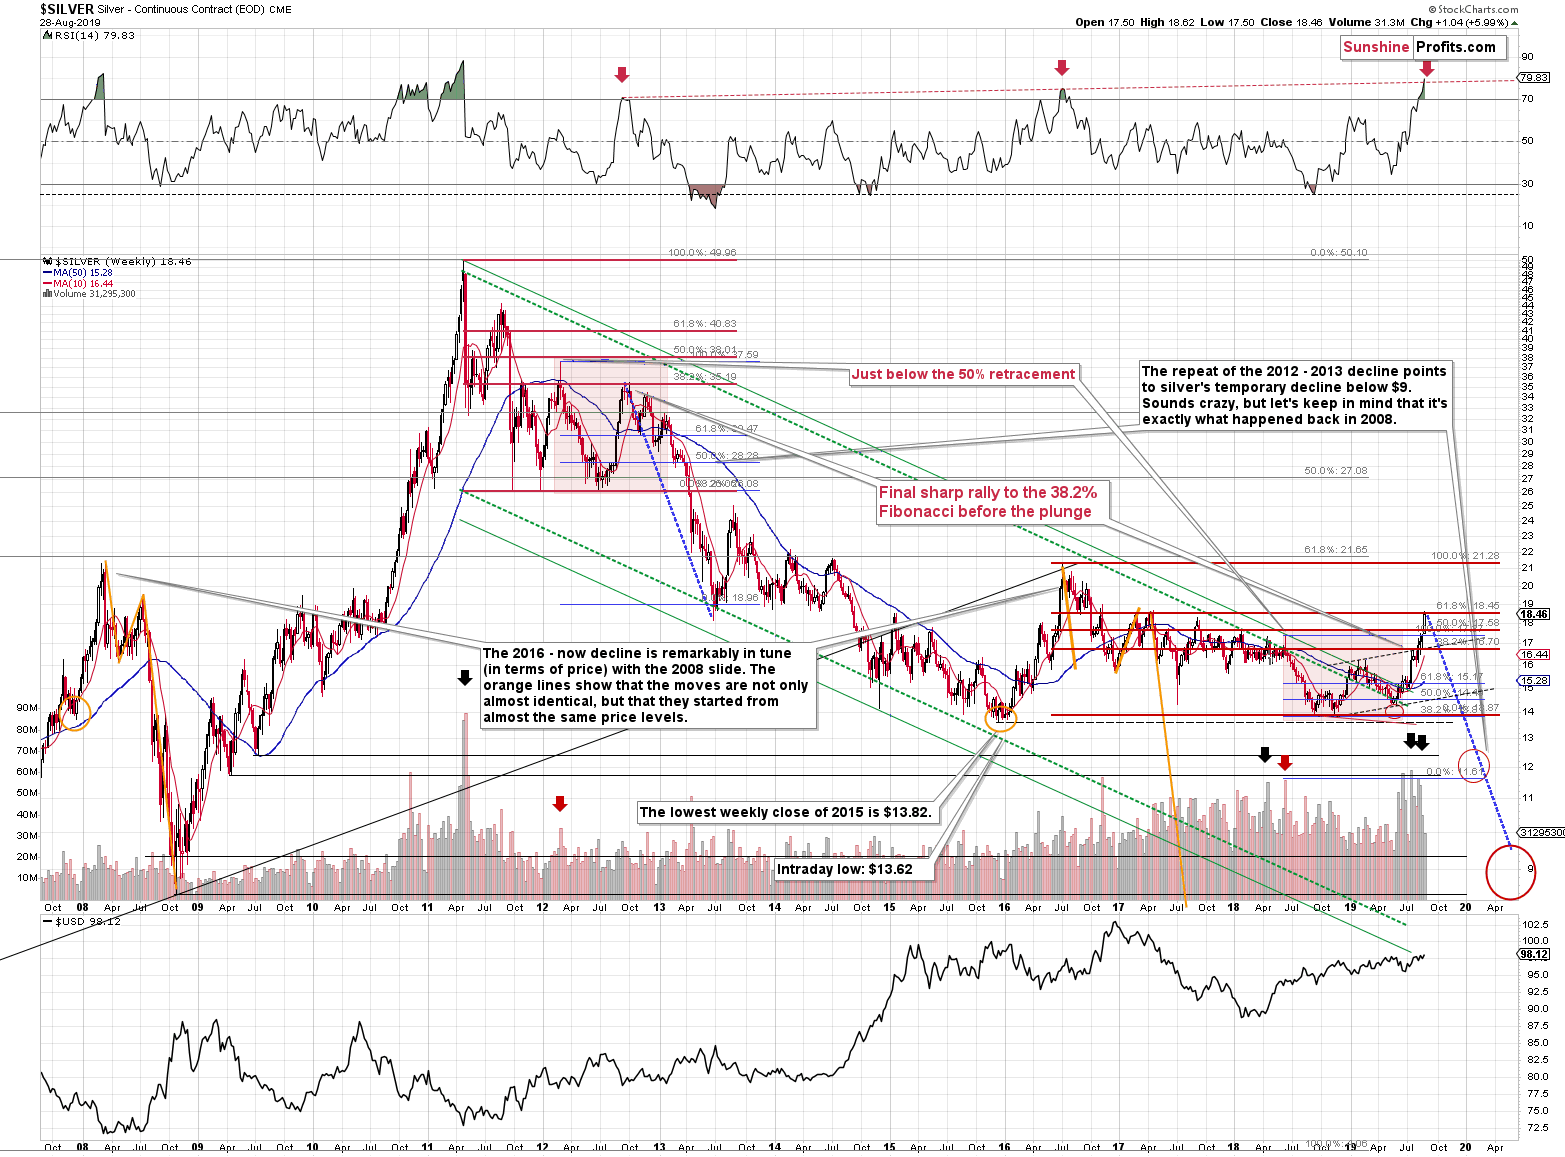
- Long-term technical signs for silver, i.a. the analogy in terms of price to what we saw in 2008, shows that silver could slide even below $10.
- Silver's very long-term cycles point to a major reversal taking place right now and since the most recent move was up, the implications are bearish (this is also silver's technical sign, but it's so important that it deserves its own point)
- Long-term technical signs for gold stocks point to this not being a new gold bull market beginning. Among others, it's their long-term underperformance relative to gold that hint this is rather a corrective upswing within a bear market that is not over yet.
- Record-breaking weekly volume in gold is a strong sign pointing to lower gold prices
Important factors:
- Extreme volume reading in the SIL ETF (proxy for silver stocks) is an effective indication that lower values of silver miners are to be expected
- Silver's short-term outperformance of gold, and gold stocks' short-term underperformance of gold both confirm that the precious metals sector is topping here
- Gold topped almost right at its cyclical turning point, which makes the trend reversal more likely
- Copper broke below its head-and-shoulders pattern and confirmed the breakdown. The last time we saw something similar was in April 2013, when the entire precious metals sector was on the verge of plunging lower.
Moreover, please note that while there may be a recession threat, it doesn't mean that gold has to rally immediately. Both: recession and gold's multi-year rally could be many months away - comparing what happened to bond yields in the 90s confirms that.
All in all, the odds are that we'll see a turnaround shortly and that the precious metals market will decline in tune with multiple factors that have been pointing to it.
Summary
Summing up, silver's excessive rally changed less than it appears at first sight. The white metal broke above the lower of the classic Fibonacci retracement levels, but the key 61.8% retracement remains intact in terms of the daily closing prices (1 cent breakout doesn't really count), and the 2017 high remains unbroken. This means that the similarity to what happened in mid-90s remains intact as far as silver is concerned. All the other medium-term factors that we outlined in the previous Alerts continue to point to much lower gold and silver prices in the following months. Let's keep in mind that due to gold's tendency to decline in the period following the U.S. Labor Day, it seems that we will not have to wait for much lower gold prices for long. In fact, a move to about $1,330 in gold appears quite likely in the next few weeks.
As always, we'll keep you - our subscribers - informed.
To summarize:
Trading capital (supplementary part of the portfolio; our opinion): Full speculative short position (250% of the full position) in gold, silver, and mining stocks is justified from the risk/reward perspective with the following stop-loss orders and exit profit-take price levels:
- Gold: profit-take exit price: $1,332; stop-loss: $1,603; initial target price for the DGLD ETN: $39.87; stop-loss for the DGLD ETN: $23.37
- Silver: profit-take exit price: $14.62; stop-loss: $19.13; initial target price for the DSLV ETN: $32.96; stop-loss for the DSLV ETN $16.37
- Mining stocks (price levels for the GDX ETF): profit-take exit price: $17.61; stop-loss: $33.37; initial target price for the DUST ETF: $32.28; stop-loss for the DUST ETF $5.78
In case one wants to bet on junior mining stocks' prices (we do not suggest doing so - we think senior mining stocks are more predictable in the case of short-term trades - if one wants to do it anyway, we provide the details), here are the stop-loss details and target prices:
- GDXJ ETF: profit-take exit price: $23.71; stop-loss: $48.42
- JDST ETF: profit-take exit price: $73.32 stop-loss: $9.67
Long-term capital (core part of the portfolio; our opinion): No positions (in other words: cash)
Insurance capital (core part of the portfolio; our opinion): Full position
Whether you already subscribed or not, we encourage you to find out how to make the most of our alerts and read our replies to the most common alert-and-gold-trading-related-questions.
Please note that the in the trading section we describe the situation for the day that the alert is posted. In other words, it we are writing about a speculative position, it means that it is up-to-date on the day it was posted. We are also featuring the initial target prices, so that you can decide whether keeping a position on a given day is something that is in tune with your approach (some moves are too small for medium-term traders and some might appear too big for day-traders).
Plus, you might want to read why our stop-loss orders are usually relatively far from the current price.
Please note that a full position doesn't mean using all of the capital for a given trade. You will find details on our thoughts on gold portfolio structuring in the Key Insights section on our website.
As a reminder - "initial target price" means exactly that - an "initial" one, it's not a price level at which we suggest closing positions. If this becomes the case (like it did in the previous trade) we will refer to these levels as levels of exit orders (exactly as we've done previously). Stop-loss levels, however, are naturally not "initial", but something that, in our opinion, might be entered as an order.
Since it is impossible to synchronize target prices and stop-loss levels for all the ETFs and ETNs with the main markets that we provide these levels for (gold, silver and mining stocks - the GDX ETF), the stop-loss levels and target prices for other ETNs and ETF (among other: UGLD, DGLD, USLV, DSLV, NUGT, DUST, JNUG, JDST) are provided as supplementary, and not as "final". This means that if a stop-loss or a target level is reached for any of the "additional instruments" (DGLD for instance), but not for the "main instrument" (gold in this case), we will view positions in both gold and DGLD as still open and the stop-loss for DGLD would have to be moved lower. On the other hand, if gold moves to a stop-loss level but DGLD doesn't, then we will view both positions (in gold and DGLD) as closed. In other words, since it's not possible to be 100% certain that each related instrument moves to a given level when the underlying instrument does, we can't provide levels that would be binding. The levels that we do provide are our best estimate of the levels that will correspond to the levels in the underlying assets, but it will be the underlying assets that one will need to focus on regarding the signs pointing to closing a given position or keeping it open. We might adjust the levels in the "additional instruments" without adjusting the levels in the "main instruments", which will simply mean that we have improved our estimation of these levels, not that we changed our outlook on the markets. We are already working on a tool that would update these levels on a daily basis for the most popular ETFs, ETNs and individual mining stocks.
Our preferred ways to invest in and to trade gold along with the reasoning can be found in the how to buy gold section. Additionally, our preferred ETFs and ETNs can be found in our Gold & Silver ETF Ranking.
As a reminder, Gold & Silver Trading Alerts are posted before or on each trading day (we usually post them before the opening bell, but we don't promise doing that each day). If there's anything urgent, we will send you an additional small alert before posting the main one.
=====
Latest Free Trading Alerts:
The new Alchemist went out at the end of July. And making the choice from its articles is always hard. What gems can we learn from the latest publication of the LBMA? We invite you to read our today's article and find out!
Gold: the Ultimate Recession Hedge 20 Years after Brown Bottom?
Wednesday's trading session didn't change much. Stocks extended their short-term consolidation following Monday's rebound off a support level. The S&P 500 index continues to trade within a four-week-long consolidation after the early August decline. Was Monday's advance an upward reversal or just upward correction before another leg down?
S&P 500 Nearing Previous Highs, What's Next?
=====
Thank you.
Sincerely,
Przemyslaw Radomski, CFA
Editor-in-chief, Gold & Silver Fund Manager

