

Briefly: in our opinion, full (250% of the regular size of the position) speculative short position in gold, silver, and mining stocks are justified from the risk/reward point of view at the moment of publishing this Alert.
The precious metals sector moved higher yesterday, but it's already down in today's pre-market trading, so yesterday's PM moves seem to have little meaning overall. There is much more going on behind the curtains than in front of them. Silver's very long-term cyclical point is here, copper just broke below critical support level, and the USD Index is making a very important test right now. In fact, yesterday's move higher in the PMs was likely caused by traders' assumption that the breakout above the May high would be invalidated. It wasn't, so the prices reversed. What's next?
Let's start with the short-term charts.
Right Now in the PMs and USD Index
Gold, silver, and mining stocks moved higher yesterday, but since gold is already down by about $9 today (and it's a bit lower than it had been trading 24 hours earlier), it seems that this move didn't mean much. As mentioned above, the likely reason behind it was the assumption that the move higher in the USD Index would be invalidated.
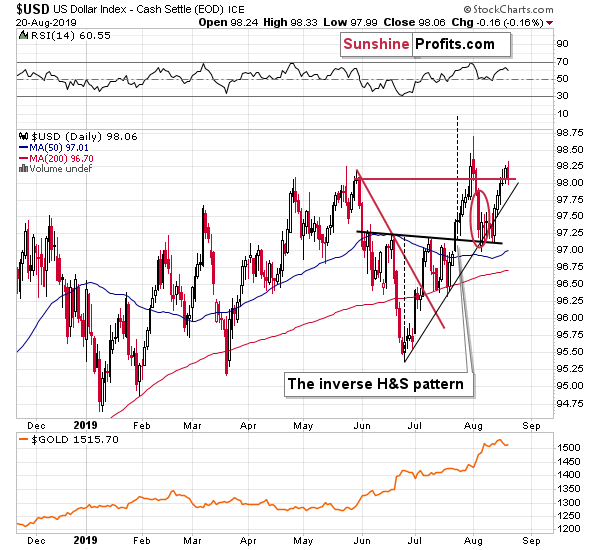
The breakout in the USD Index is important as it would mean that the multi-month consolidation is over and that the USD could resume its strong long-term uptrend. The late-July breakout was immediately followed by Trump's additional tariff threat. This managed to trigger only a quick correction that was then followed by yet another upswing.
We can't stress this news-chart link enough. The U.S. dollar is being hit from multiple directions: Fed's shockingly dovish turn earlier this year, then the rate cut, trade war with China, tensions between the U.S. and Mexico, not to mention accusations regarding Iran. Yet, after each hit, it rallies back up, just as a phoenix rises from the ashes. This resilience is what makes the situation in the USD Index extremely bullish and it perfectly fits the long-term technical picture for the U.S. currency. Eventually there will be no more dovish surprises as the Fed needs to keep some powder dry for when the next crisis hits - and the USD will then soar with vengeance. Since the USD Index is negatively correlated with gold and silver in the long run, the big move higher in the USD is likely to translate into a big move lower in the precious metals.
It might be the case that this move has already begun. The current breakout above the May high was corrected yesterday, but it wasn't invalidated. In early August, the USD Index declined profoundly on the third day after the breakout, thus invalidating it. Consequently, what happens today will be important for the next several days - few weeks. So far, the USDX is holding up well - it moved a bit higher in today's market trading, so the odds are that the breakout will be confirmed this time. This means opening the way to much higher USD values (100+), and much lower gold, silver, and mining stock values.
Having said that, let's take a look at the other major behind-the-curtains developments.
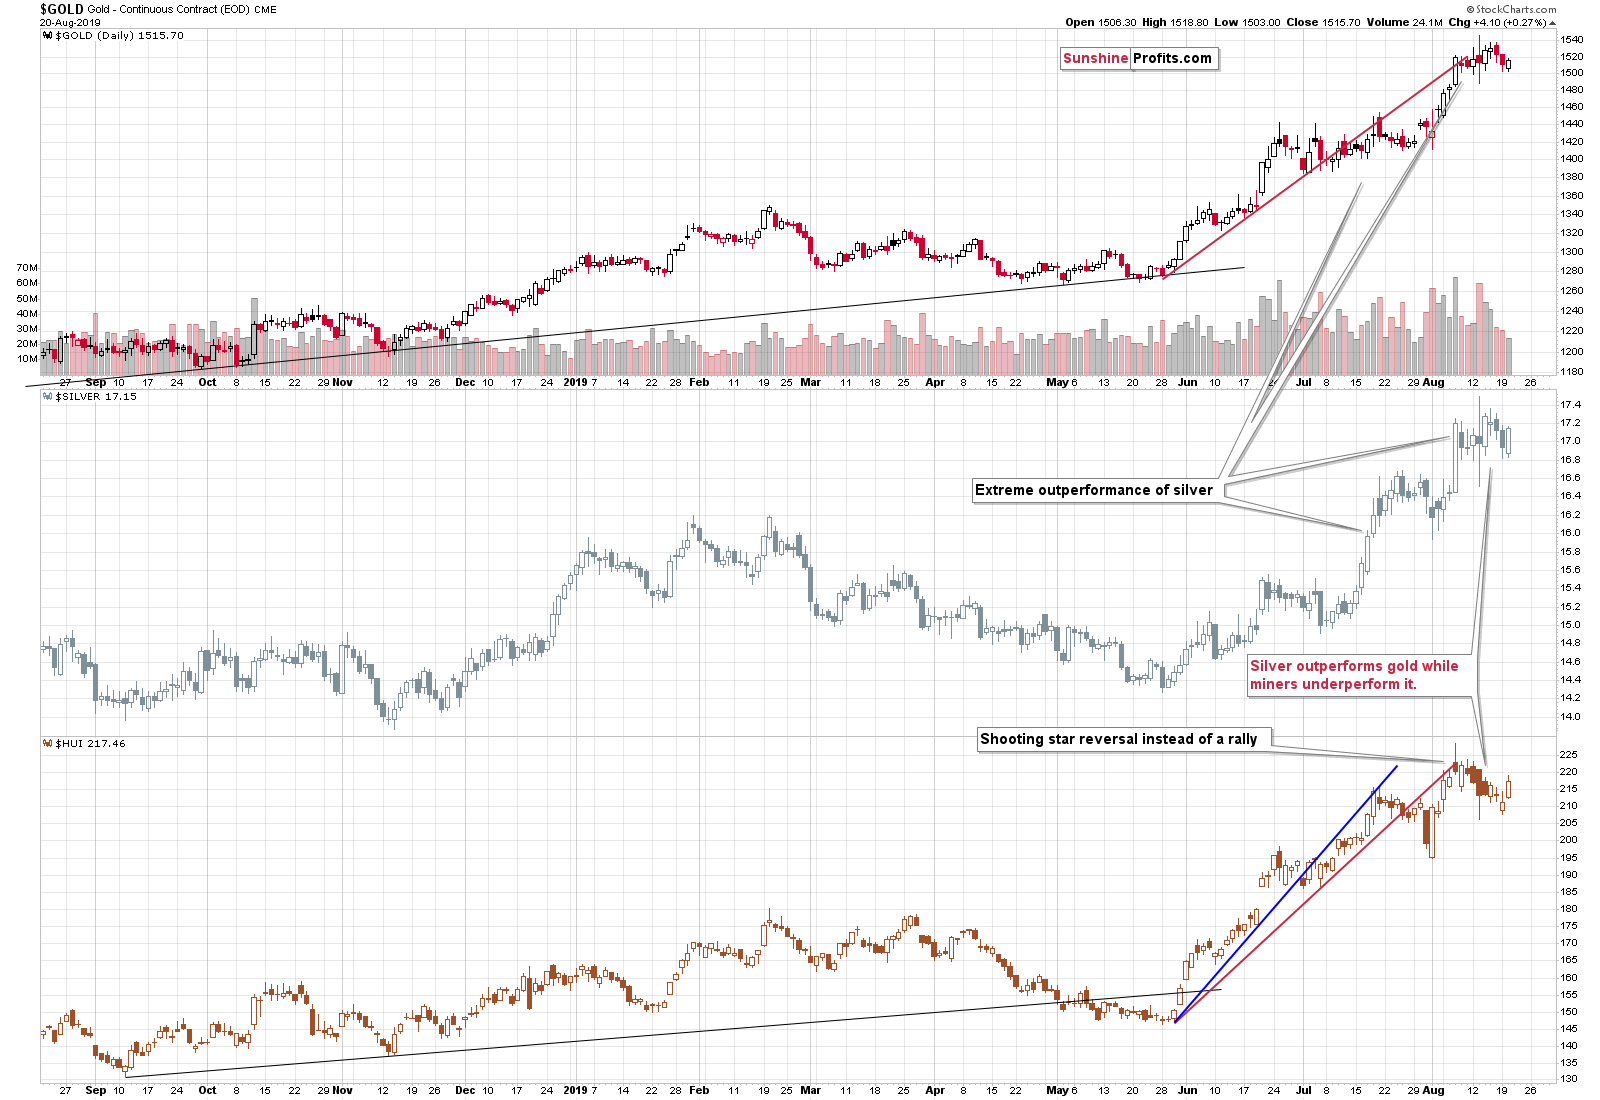
Silver's Long Term Cycles and Silver Stocks
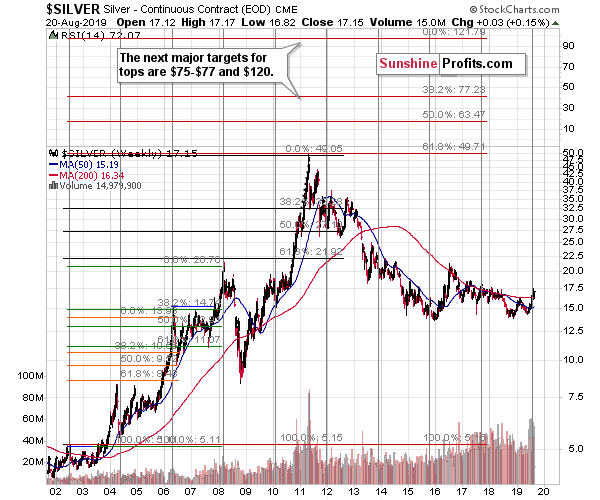
Every two years or so, silver tends to form a price extreme. Sometimes it's a major top, and sometimes it's a major bottom, but this indication is almost always correct. Please take a look at the chart above for details. The next turning point is right here, and silver is after a huge-volume rally. This is a classic combination that would indicate a major top. The most similar situation that we saw in the recent past with regard to both cyclicality and volume, was the 2008 top. Silver was after a sharp rally, and we saw a spike in silver's volume. The implications are strongly bearish for the following months.
Let's keep in mind how weak the silver stocks are.
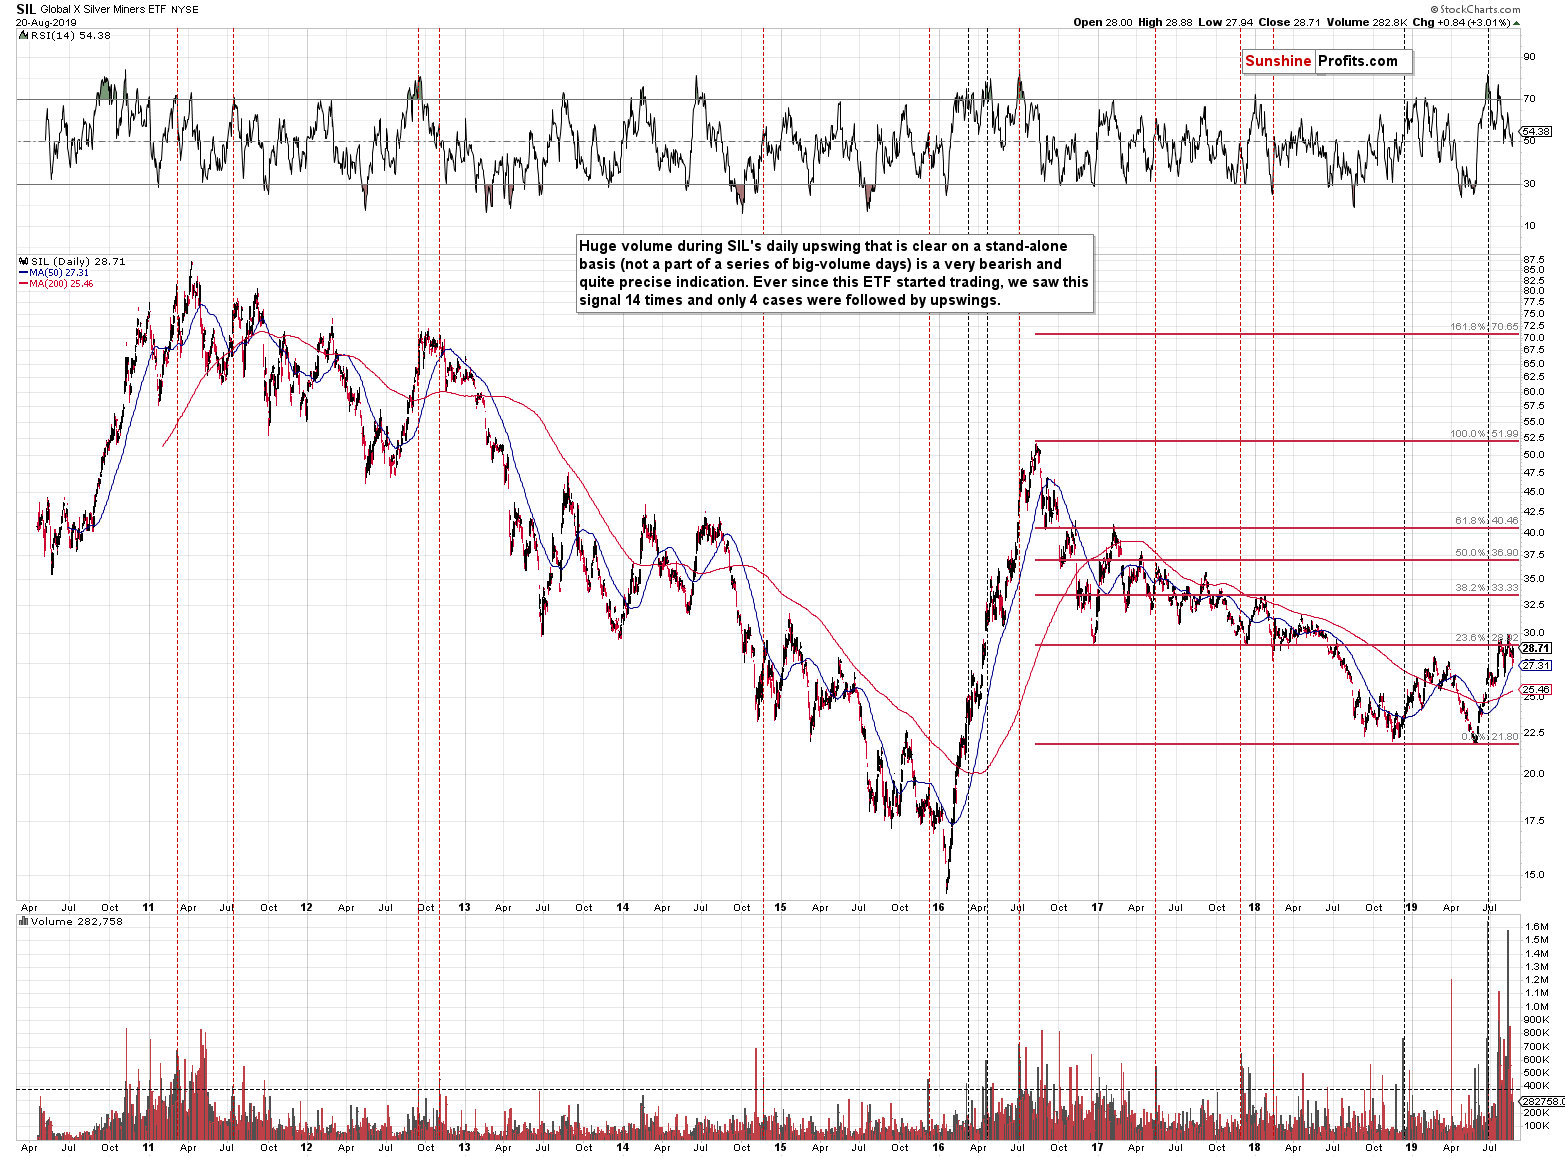
Despite yesterday's 3% upswing, the silver miners didn't manage to even touch the late-2016 low. They are clearly underperforming silver, just as gold miners are underperforming gold, and miners' underperformance of the underlying metals is one of the more reliable bearish trading tips for gold and silver.
The huge volume spike that we saw recently adds to the bearish picture as in 10 out of previous 14 cases, this meant lower silver stock values ahead.
Before summarizing, let's take a look at copper.
The Metal with PhD. in Economics
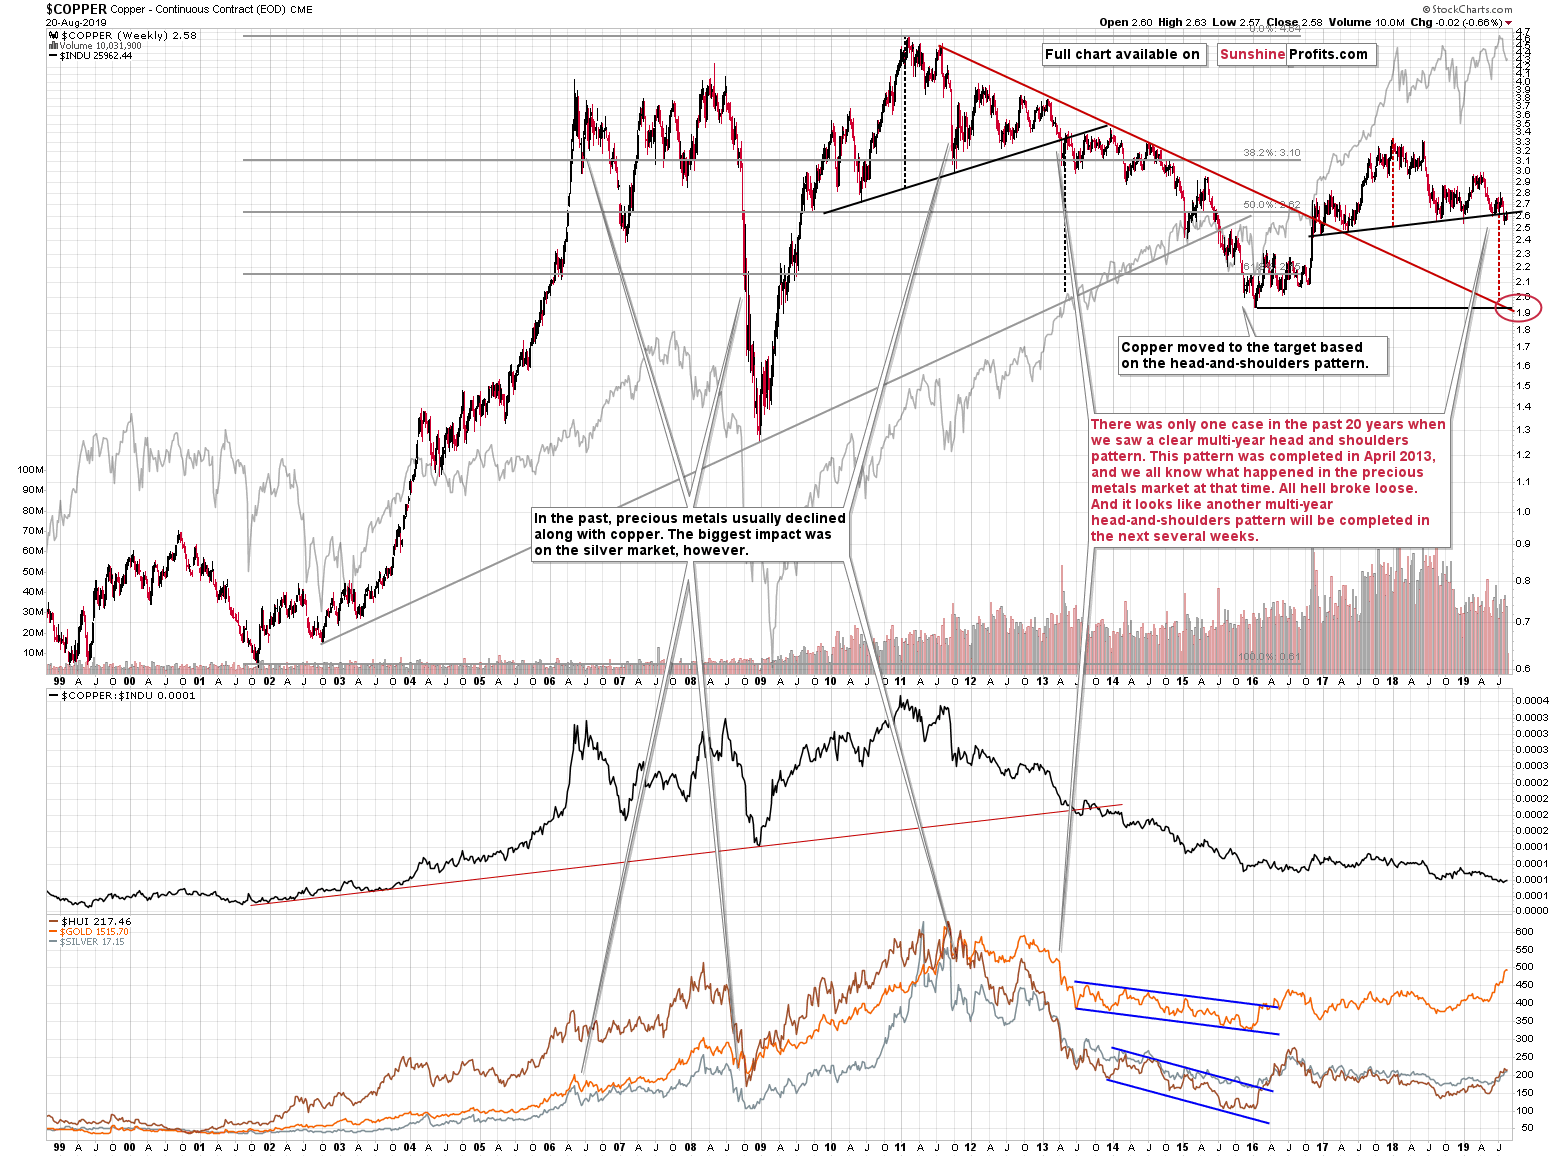
The big news about copper is that it recently broke below its massive (started in early 2017) head-and-shoulders top pattern. Quickly after the breakdown, copper rallied, but didn't manage to move back above the neck level of the pattern. This means that the pattern is now almost completed. "Almost", because we would like to see at least another small move lower from the current levels as a proof that the post-breakdown top is already in. This is just to be sure, though (to the extent of anything being surefire regarding any market, that is). Theoretically, the breakdown is already confirmed, and the implications are already bearish.
The likely target for the copper price is based on the size of the head and we marked it with red vertical lines. This means that copper is likely to slide to about $1.9.
Ok, but why should we - precious metals investors and traders - care about that?
Because there was only one time in the recent history when a similarly big head-and-shoulders pattern was completed, and it happened in April, 2013. And you know very well what happened that month in the precious metals market.
Carnage.
The history tends to repeat itself to a certain degree, so, the current situation in the copper market just started to support the very bearish outlook for the precious metals market. Once we see another small move lower in copper, the implications will be even stronger.
Summary
Summing up, taking the big investment picture into account, out of the following: gold, silver, gold stocks, silver stocks, the recent upswing was visible only in case of gold. Most of the precious metals portfolio: silver, gold miners, and silver miners suggest that what we saw in the last several months is nothing more than a corrective upswing within a bigger downtrend. The analysis of gold to silver and gold stocks to gold ratios confirms the very bearish outlook for the medium term. The situation in the USD Index is very bullish for the following months and suggests that gold's recent action was likely a fake upswing, similar to the 1995-1996 one. Silver and mining stocks confirm the importance of the 1996-2019 analogy. Mining stocks' recent weakness and silver's strong performance in the very short term both suggest that one should be prepared for much lower, not higher precious metals prices.
As always, we'll keep you - our subscribers - informed.
To summarize:
Trading capital (supplementary part of the portfolio; our opinion): Full speculative short position (250% of the full position) in gold, silver, and mining stocks is justified from the risk/reward perspective with the following stop-loss orders and exit profit-take price levels:
- Gold: profit-take exit price: $1,241; stop-loss: $1,552; initial target price for the DGLD ETN: $51.87; stop-loss for the DGLD ETN $25.37
- Silver: profit-take exit price: $13.81; stop-loss: $17.73; initial target price for the DSLV ETN: $39.08; stop-loss for the DSLV ETN $18.27
- Mining stocks (price levels for the GDX ETF): profit-take exit price: $17.61; stop-loss: $33.37; initial target price for the DUST ETF: $32.28; stop-loss for the DUST ETF $5.78
In case one wants to bet on junior mining stocks' prices (we do not suggest doing so - we think senior mining stocks are more predictable in the case of short-term trades - if one wants to do it anyway, we provide the details), here are the stop-loss details and target prices:
- GDXJ ETF: profit-take exit price: $23.71; stop-loss: $48.42
- JDST ETF: profit-take exit price: $73.32 stop-loss: $9.67
Long-term capital (core part of the portfolio; our opinion): No positions (in other words: cash)
Insurance capital (core part of the portfolio; our opinion): Full position
Whether you already subscribed or not, we encourage you to find out how to make the most of our alerts and read our replies to the most common alert-and-gold-trading-related-questions.
Please note that the in the trading section we describe the situation for the day that the alert is posted. In other words, it we are writing about a speculative position, it means that it is up-to-date on the day it was posted. We are also featuring the initial target prices, so that you can decide whether keeping a position on a given day is something that is in tune with your approach (some moves are too small for medium-term traders and some might appear too big for day-traders).
Plus, you might want to read why our stop-loss orders are usually relatively far from the current price.
Please note that a full position doesn't mean using all of the capital for a given trade. You will find details on our thoughts on gold portfolio structuring in the Key Insights section on our website.
As a reminder - "initial target price" means exactly that - an "initial" one, it's not a price level at which we suggest closing positions. If this becomes the case (like it did in the previous trade) we will refer to these levels as levels of exit orders (exactly as we've done previously). Stop-loss levels, however, are naturally not "initial", but something that, in our opinion, might be entered as an order.
Since it is impossible to synchronize target prices and stop-loss levels for all the ETFs and ETNs with the main markets that we provide these levels for (gold, silver and mining stocks - the GDX ETF), the stop-loss levels and target prices for other ETNs and ETF (among other: UGLD, DGLD, USLV, DSLV, NUGT, DUST, JNUG, JDST) are provided as supplementary, and not as "final". This means that if a stop-loss or a target level is reached for any of the "additional instruments" (DGLD for instance), but not for the "main instrument" (gold in this case), we will view positions in both gold and DGLD as still open and the stop-loss for DGLD would have to be moved lower. On the other hand, if gold moves to a stop-loss level but DGLD doesn't, then we will view both positions (in gold and DGLD) as closed. In other words, since it's not possible to be 100% certain that each related instrument moves to a given level when the underlying instrument does, we can't provide levels that would be binding. The levels that we do provide are our best estimate of the levels that will correspond to the levels in the underlying assets, but it will be the underlying assets that one will need to focus on regarding the signs pointing to closing a given position or keeping it open. We might adjust the levels in the "additional instruments" without adjusting the levels in the "main instruments", which will simply mean that we have improved our estimation of these levels, not that we changed our outlook on the markets. We are already working on a tool that would update these levels on a daily basis for the most popular ETFs, ETNs and individual mining stocks.
Our preferred ways to invest in and to trade gold along with the reasoning can be found in the how to buy gold section. Additionally, our preferred ETFs and ETNs can be found in our Gold & Silver ETF Ranking.
As a reminder, Gold & Silver Trading Alerts are posted before or on each trading day (we usually post them before the opening bell, but we don't promise doing that each day). If there's anything urgent, we will send you an additional small alert before posting the main one.
Thank you.
Sincerely,
Przemyslaw Radomski, CFA
Editor-in-chief, Gold & Silver Fund Manager

