

Briefly: in our opinion, full (250% of the regular size of the position) speculative short position in gold, silver, and mining stocks is justified from the risk/reward point of view at the moment of publishing this Alert.
Yesterday's top news was the initial Brexit deal, which caused some turmoil, in particular on the currency market. The emphasis should go on "initial" as there's really no real deal yet - whether there is one will be determined tomorrow, during Saturday's vote in the UK. Yet, the precious metals' reactions so far are insightful nonetheless, and they are in tune with what we have been writing about lately. Let's go into the details.
As said, the announced Brexit deal was behind yesterday's volatility. But it isn't over yet as Boris Johnson has to get it through the Parliament first. And the odds are that the vote will not go in his favor. As Bloomberg reports:
If he is to win Saturday's vote, Johnson needs to secure the support of Northern Ireland's Democratic Unionist Party, which has categorically opposed the agreement he reached with the European Union on Wednesday. He is also seeking to woo reluctant members of his own side, and persuade opposition Labour politicians to back him, if he is to prevail.
Securing the support of the party that categorically opposed this agreement doesn't seem likely at all. The market moved yesterday and the USD Index fell, but there was no real basis for that. The stagnation regarding Brexit seems to be so severe and so little happened in the previous months that yesterday's no-news news seems like a game changer. But just because a turkey is noticeably different and bigger than a chicken, it doesn't make it an ostrich. The difference between the previous stagnation and yesterday's news is noticeable, but it's not the game-changer it's portrayed to be. The USD Index reacted to the ostrich-like scare, but it seems that the market will soon realize that what we have here is the chicken that just got a few extra feathers.
Let's see what the U.S. currency did exactly.
The USD Index Gyrations
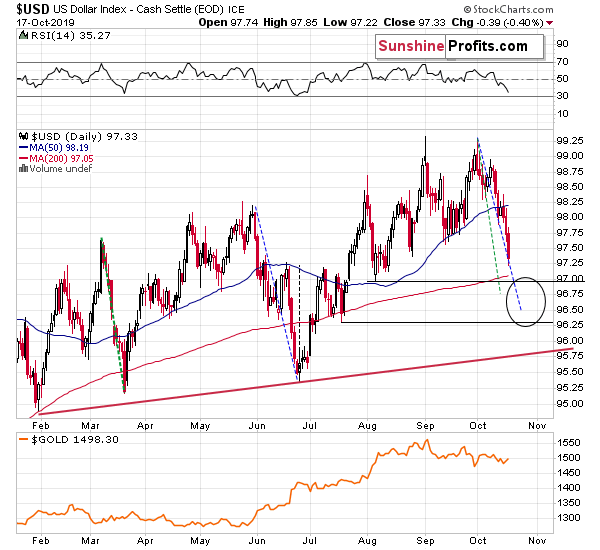
The USDX just moved below the September and late-August lows, closing below them. This breakdown opens the way to further declines, so the question becomes how far can the USDX slide. It seems that not much. The index has been trading in a specific manner in the previous months and nothing suggests that this short-term correction is going to be anything bigger than the previous ones.
We copied the previous declines (marked with green and blue) to the current situation and it clear that if the USD Index was to match these moves than it could decline some more, but the size of this move is not likely to be huge.
The nearest support levels are provided by the previous lows and the 200-day moving average. The upper target is at about 97 and the lower target is at about 96.3. There's also the rising red support line a bit below 96, but it's highly unlikely that the USD Index would drop as low.
There's also another line that's not visible on the previous chart and it's the blue line based on i.a. the mid-2018 low. It's a bit above 96, so it strengthens the support provided by the mid-July 2019 low.
So, in the more bullish scenario, USDX could rally once bottoming close to 97, and in the less bullish scenario it could rally once bottoming close to 96.3. In case of the former, the decline would be smaller than the March 2019 decline, and in case of the latter, the decline would be a bit bigger than the May - June 2019 decline. Both scenarios seem possible, but the bottom at 97 is more probable in our view.
The scenario in which the USDX breaks below 96 and continues to fall for weeks is very unlikely in our view, given the resilience that the U.S. currency has been consistently showing in the previous months in light of bearish news like Trump calling for a lower dollar or significantly lower interest rates.
Now, why are we describing the USD Index instead of starting the analysis with gold, silver, or mining stocks? Because the U.S. currency is likely the factor preventing the slide from continuing. In the previous months, when the USD declined, gold rallied. Now, it's just verifying the breakdown below $1,500. The short-term trend has definitely changed. However, as long as the USDX keeps declining, the gold market and the rest of the PM sector may have a difficult time launching a powerful slide.
This has no actionable implications for our short positions, because the possible rally is likely to be very limited (or perhaps it's already over), but it serves as a good reply to the "how long do we have to wait now" question.
Perhaps we will have to wait just until Monday. The failure to confirm the Brexit deal during the Saturday vote could immediately reverse USD's decline. Or we might need to wait for a few extra days before the support levels are reached which would then trigger the reversal. All in all, the decline in the precious metal sector could accelerate as early as on Monday, but even if it doesn't, we most likely won't have to wait for long, anyway.
Yesterday in PMs
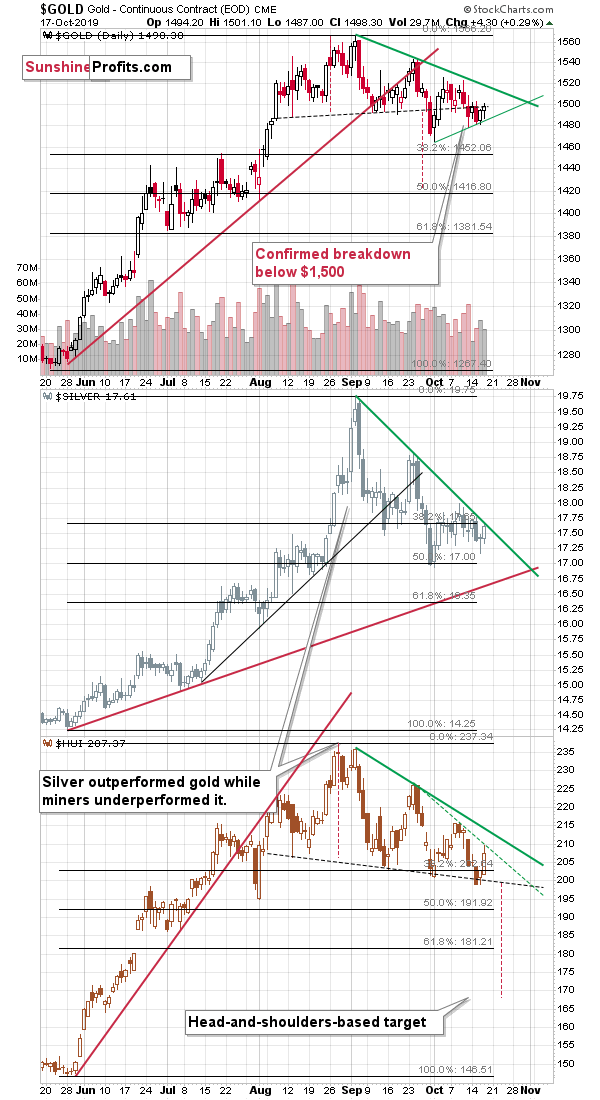
As we mentioned earlier, despite a move higher, gold didn't close the day back above the $1,500 mark. Silver moved a bit up, but closed at its declining resistance line, not above it - there was no breakout. Gold stocks rose in the most visible manner, but they closed at their declining short-term resistance line and then gave some of the daily gains away.
In other words, there was no major price action and given the size of the decline in the USD Index, there should have been one. This is bearish.
Gold and silver are already back down in today's pre-market trading. Gold is about $2 below Wednesday's close, so it already erased more than yesterday's entire rally. Silver is mere 5 cents above Wednesday's close. And that's without a reversal in the USD Index. The precious metals simply don't want to rally here, and while they might respond occasionally, they will soon give back the temporary gains and prepare for a much longer and bigger move lower. That's exactly what we saw yesterday and what we see so far today.
Moreover, please note that the above chart features three short-term triangle-vertex-based reversals in early November. The support and resistance lines for gold, silver and mining stocks all cross at practically the same time. Consequently, if the PMs break lower shortly, it will likely mean that the next short-term bottom takes place in about two weeks.
Before summarizing, let's take a look at copper.
The Metal with PhD. in Economics
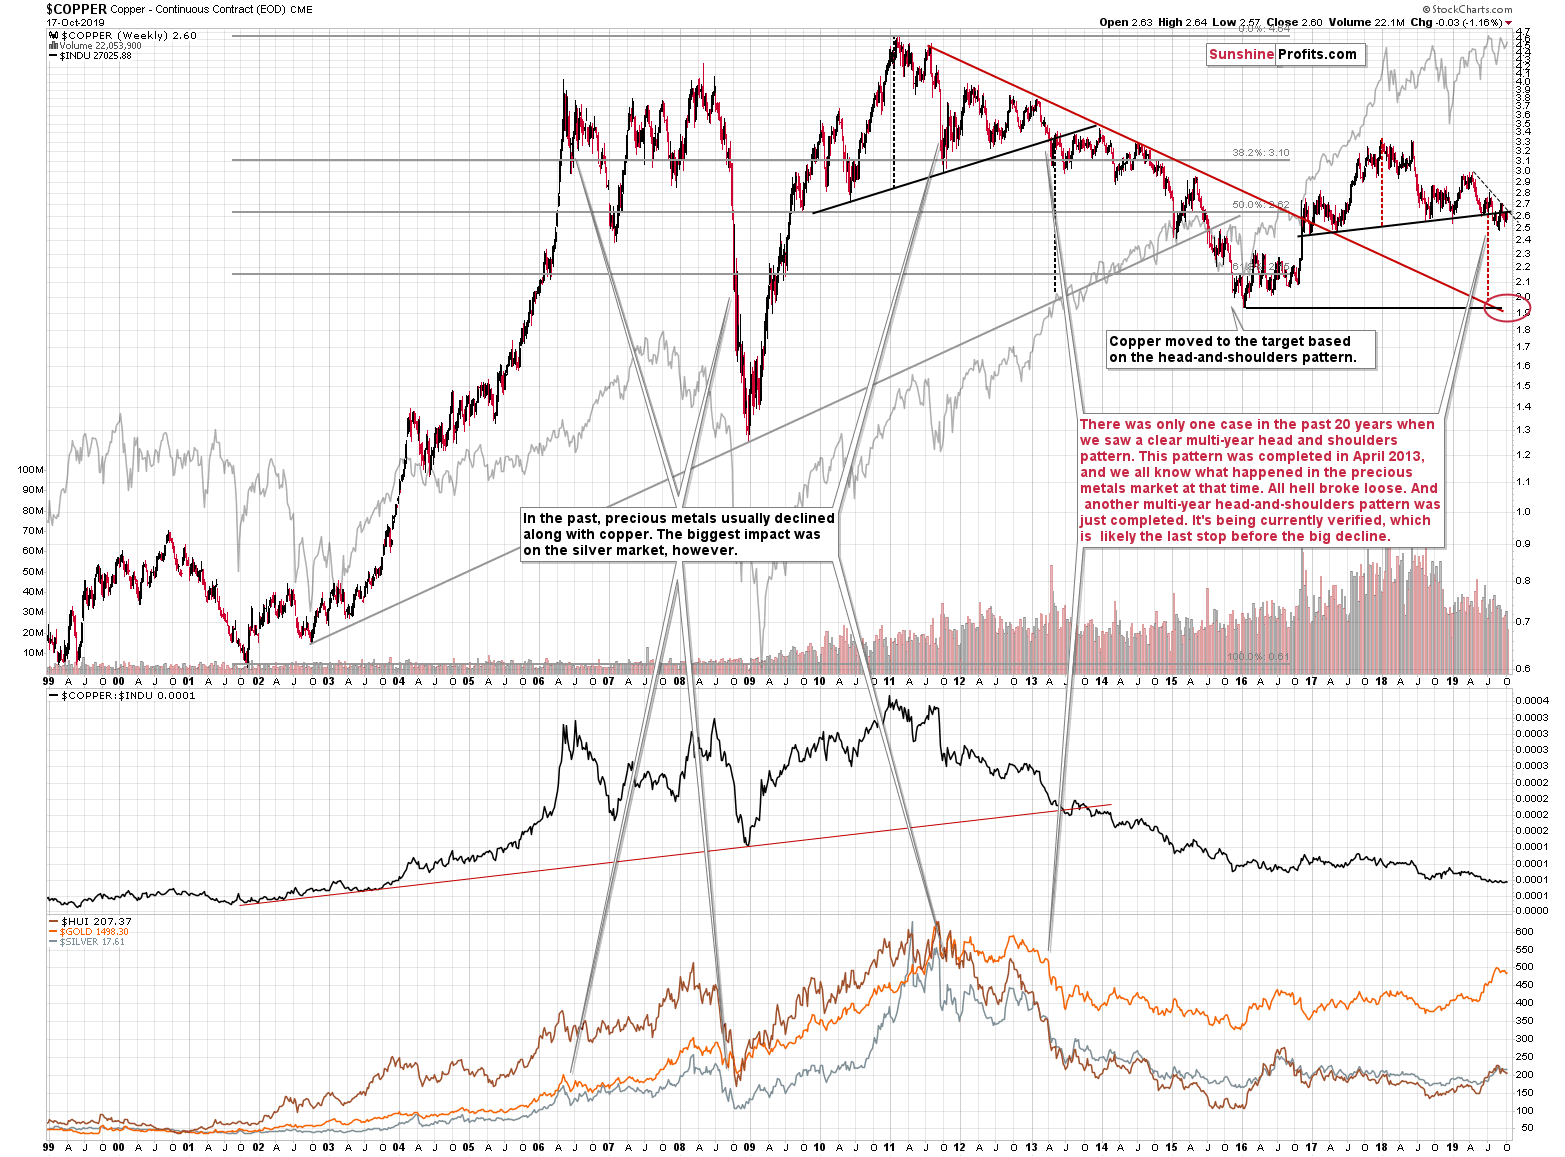
In the Key Factors section, we mention the copper market as one with a very bearish technical outlook, and since it's been some time since we feature its chart, we want to catch up. The copper price is after breaking below the neck level of the head-and-shoulders pattern, which means that the powerful bearish forces remain intact. The consolidation below the neck level (with one temporary move above it that was quickly followed by a decline) means that the market is preparing to move. Based on the H&S formation, it's likely that the move will be lower and that it will be big. Based on the short-term declining dashed resistance line, it seems that the time for this consolidation is practically over. Copper is unlikely to wait much longer before plunging.
Ok, but why should we - precious metals investors and traders - care about that?
Because there was only one time in the recent history when a similarly big head-and-shoulders pattern was completed, and it happened in April, 2013. And you know very well what happened that month in the precious metals market.
Carnage.
The history tends to repeat itself to a certain degree, so, the current situation in the copper market supports the very bearish outlook for the precious metals market.
Naturally, the other key bearish factors for the medium term remain intact.
Key Factors to Keep in Mind
Critical factors:
- The USD Index broke above the very long-term resistance line and verified the breakout above it. Its huge upswing is already underway.
- The USD's long-term upswing is an extremely important and bearish factor for gold. There were only two similar cases in the past few decades, when USD Index was starting profound, long-term bull markets, and they were both accompanied by huge declines in gold and the rest of the precious metals market
- Out of these two similar cases, only one is very similar - the case when gold topped in February 1996. The similarity extends beyond gold's about a yearly delay in reaction to the USD's rally. Also the shape of gold price moves prior to the 1996 high and what we saw in the last couple of years is very similar, which confirm the analysis of the gold-USD link and the above-mentioned implications of USD Index's long-term breakout.
- The similarity between now and 1996 extends to silver and mining stocks - in other words, it goes beyond USD, gold-USD link, and gold itself. The white metal and its miners appear to be in a similar position as well, and the implications are particularly bearish for the miners. After their 1996 top, they erased more than 2/3rds of their prices.
- Many investors got excited by the gold-is-soaring theme in the last few months, but looking beyond the short-term moves, reveals that most of the precious metals sector didn't show substantial strength that would be really visible from the long-term perspective. Gold doesn't appear to be starting a new bull market here, but rather to be an exception from the rule.
- Gold stocks appear to be repeating their performance from 20 years ago, which means that a bottom in the entire precious metals sector is quite likely to form at much lower prices, in about a year
Very important, but not as critical factors:
- Long-term technical signs for silver, i.a. the analogy in terms of price to what we saw in 2008, shows that silver could slide even below $10.
- Silver's very long-term cycles point to a major reversal taking place right now and since the most recent move was up, the implications are bearish (this is also silver's technical sign, but it's so important that it deserves its own point)
- Long-term technical signs for gold stocks point to this not being a new gold bull market beginning. Among others, it's their long-term underperformance relative to gold that hint this is rather a corrective upswing within a bear market that is not over yet.
- Record-breaking weekly volume in gold is a strong sign pointing to lower gold prices
Important factors:
- Extreme volume reading in the SIL ETF (proxy for silver stocks) is an effective indication that lower values of silver miners are to be expected
- Silver's short-term outperformance of gold, and gold stocks' short-term underperformance of gold both confirm that the precious metals sector is topping here
- Gold topped almost right at its cyclical turning point, which makes the trend reversal more likely
- Copper broke below its head-and-shoulders pattern and confirmed the breakdown. The last time we saw something similar was in April 2013, when the entire precious metals sector was on the verge of plunging lower.
Moreover, please note that while there may be a recession threat, it doesn't mean that gold has to rally immediately. Both: recession and gold's multi-year rally could be many months away - comparing what happened to bond yields in the 90s confirms that.
Summary
Summing up, it seems that the corrective upswing in gold is over and that the yellow metal's big decline is already underway (and that it had started in August as we had written previously), and that it will resume shortly. The similarity to how gold stocks rallied and then declined about 20 years ago provides us with a specific time target for the decline in the entire precious metals sector - it's likely to take place for about 1 year from now. That's not particularly close, but the road lower that gold, silver, and miners are likely to take is not short either. The profits from the short position in gold, silver and mining stocks are likely to be legendary, but the difficult part is not to miss the decline. Fortunately, the pace of decline that we saw 20 years ago provides suggestions regarding when it might be worth to bet on the corrective upswing with one's trading capital and when it's better to wait it out. Based on the analogy to the above-mentioned decline, the next medium-term bottom might take place in about 2 months, in mid-December. There are additional indications pointing to a short-term reversal (likely a bottom) in early November.
As always, we'll keep you - our subscribers - informed.
To summarize:
Trading capital (supplementary part of the portfolio; our opinion): Full speculative short position (250% of the full position) in gold, silver, and mining stocks are justified from the risk/reward perspective with the following stop-loss orders and binding exit profit-take price levels:
- Gold: profit-take exit price: $1,391; stop-loss: $1,573; initial target price for the DGLD ETN: $36.37; stop-loss for the DGLD ETN: $25.44
- Silver: profit-take exit price: $15.11; stop-loss: $19.06; initial target price for the DSLV ETN: $24.88; stop-loss for the DSLV ETN: $14.07
- Mining stocks (price levels for the GDX ETF): profit-take exit price: $23.21; stop-loss: $30.11; initial target price for the DUST ETF: $11.69; stop-loss for the DUST ETF $6.08
In case one wants to bet on junior mining stocks' prices, here are the stop-loss details and target prices:
- GDXJ ETF: profit-take exit price: $31.62; stop-loss: $41.22
- JDST ETF: profit-take exit price: $24.88 stop-loss: $12.46
Long-term capital (core part of the portfolio; our opinion): No positions (in other words: cash)
Insurance capital (core part of the portfolio; our opinion): Full position
Whether you already subscribed or not, we encourage you to find out how to make the most of our alerts and read our replies to the most common alert-and-gold-trading-related-questions.
Please note that the in the trading section we describe the situation for the day that the alert is posted. In other words, it we are writing about a speculative position, it means that it is up-to-date on the day it was posted. We are also featuring the initial target prices, so that you can decide whether keeping a position on a given day is something that is in tune with your approach (some moves are too small for medium-term traders and some might appear too big for day-traders).
Plus, you might want to read why our stop-loss orders are usually relatively far from the current price.
Please note that a full position doesn't mean using all of the capital for a given trade. You will find details on our thoughts on gold portfolio structuring in the Key Insights section on our website.
As a reminder - "initial target price" means exactly that - an "initial" one, it's not a price level at which we suggest closing positions. If this becomes the case (like it did in the previous trade) we will refer to these levels as levels of exit orders (exactly as we've done previously). Stop-loss levels, however, are naturally not "initial", but something that, in our opinion, might be entered as an order.
Since it is impossible to synchronize target prices and stop-loss levels for all the ETFs and ETNs with the main markets that we provide these levels for (gold, silver and mining stocks - the GDX ETF), the stop-loss levels and target prices for other ETNs and ETF (among other: UGLD, DGLD, USLV, DSLV, NUGT, DUST, JNUG, JDST) are provided as supplementary, and not as "final". This means that if a stop-loss or a target level is reached for any of the "additional instruments" (DGLD for instance), but not for the "main instrument" (gold in this case), we will view positions in both gold and DGLD as still open and the stop-loss for DGLD would have to be moved lower. On the other hand, if gold moves to a stop-loss level but DGLD doesn't, then we will view both positions (in gold and DGLD) as closed. In other words, since it's not possible to be 100% certain that each related instrument moves to a given level when the underlying instrument does, we can't provide levels that would be binding. The levels that we do provide are our best estimate of the levels that will correspond to the levels in the underlying assets, but it will be the underlying assets that one will need to focus on regarding the signs pointing to closing a given position or keeping it open. We might adjust the levels in the "additional instruments" without adjusting the levels in the "main instruments", which will simply mean that we have improved our estimation of these levels, not that we changed our outlook on the markets. We are already working on a tool that would update these levels on a daily basis for the most popular ETFs, ETNs and individual mining stocks.
Our preferred ways to invest in and to trade gold along with the reasoning can be found in the how to buy gold section. Additionally, our preferred ETFs and ETNs can be found in our Gold & Silver ETF Ranking.
As a reminder, Gold & Silver Trading Alerts are posted before or on each trading day (we usually post them before the opening bell, but we don't promise doing that each day). If there's anything urgent, we will send you an additional small alert before posting the main one.
=====
Latest Free Trading Alerts:
Another round of global monetary easing has just begun! More than 30 central banks around the world have cut interest rates this year so far. The Fed and the ECB are certainly among them. Should gold investors look forward to these policies playing out? Let's find out how gold tends to behave during such an extraordinary period!
Gold Performance during Global Monetary Easing
=====
Thank you.
Sincerely,
Przemyslaw Radomski, CFA
Editor-in-chief, Gold & Silver Fund Manager

