

Briefly: in our opinion, full (250% of the regular size of the position) speculative short position in gold, silver, and mining stocks are justified from the risk/reward point of view at the moment of publishing this Alert.
Michael Jordan is no longer the key NBA player, Britney Spears and Backstreet Boys are no longer winning in the top charts, and the new movie hits are not about gigantic cruising ships crashing into icebergs (Leonardo DiCaprio continues to enjoy his fame, though), but there is something about the 90s that one needs to be aware of. At least if they are interested in making money in the precious metals market.
As we explained last week, the similarity between a specific part of the 90s and the current situation in the USD Index and gold is uncanny from both the macro and micro perspectives. Even though we have such a great similarity in two markets, it doesn't mean that diligent investors should stop their research at this time. Conversely, it's imperative to check the larger investment environment. In case of the precious metals market, the key question is what did silver and mining stocks do and how does it compare to what we saw recently. But what did silver, and gold stocks do? Did they confirm gold's indications? Is their current performance similar to what we saw back then?
Before we start with silver, we would like to emphasize that today's analysis is the continuation of what we wrote in the last few Gold & Silver Trading Alerts, so if you have just subscribed, it would be best to start with what we wrote on Thursday about gold and the USD Index, then check Friday's analysis, where we comment on the same analysis while zooming into individual weekly price moves. And it would definitely not hurt to go through Wednesday's analysis, where we discuss what parts of the precious metals market have really moved higher recently. Long story short, it was only gold.
Having said that, let's take a look at what silver did in the 90s.
Silver Not So Long Ago
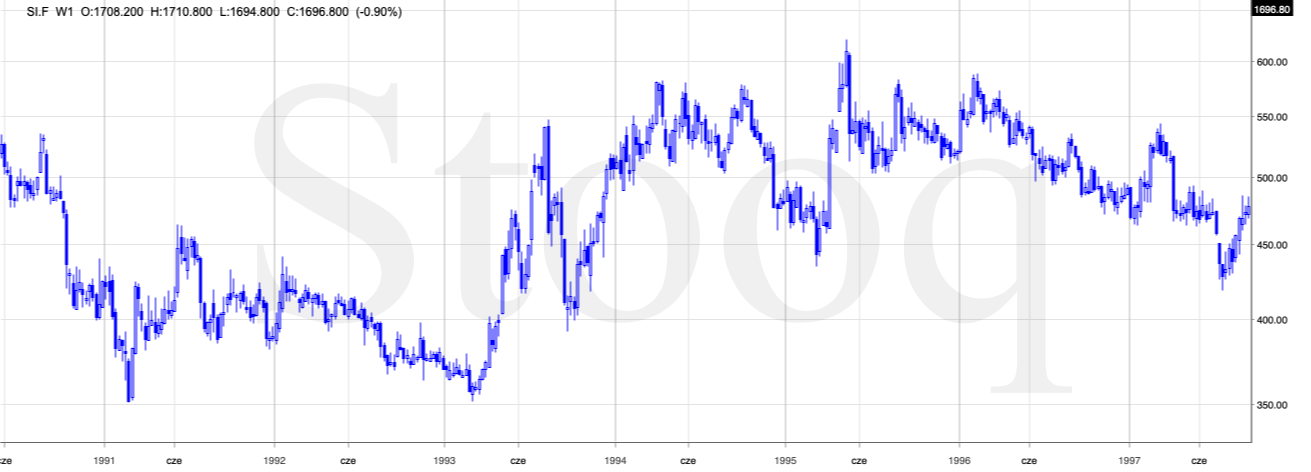
As a quick reminder, gold topped in February 1996 by rallying a bit above the previous highs in a volatile manner. What did silver do? It rallied sharply and it didn't soar above the previous highs. Sounds familiar?
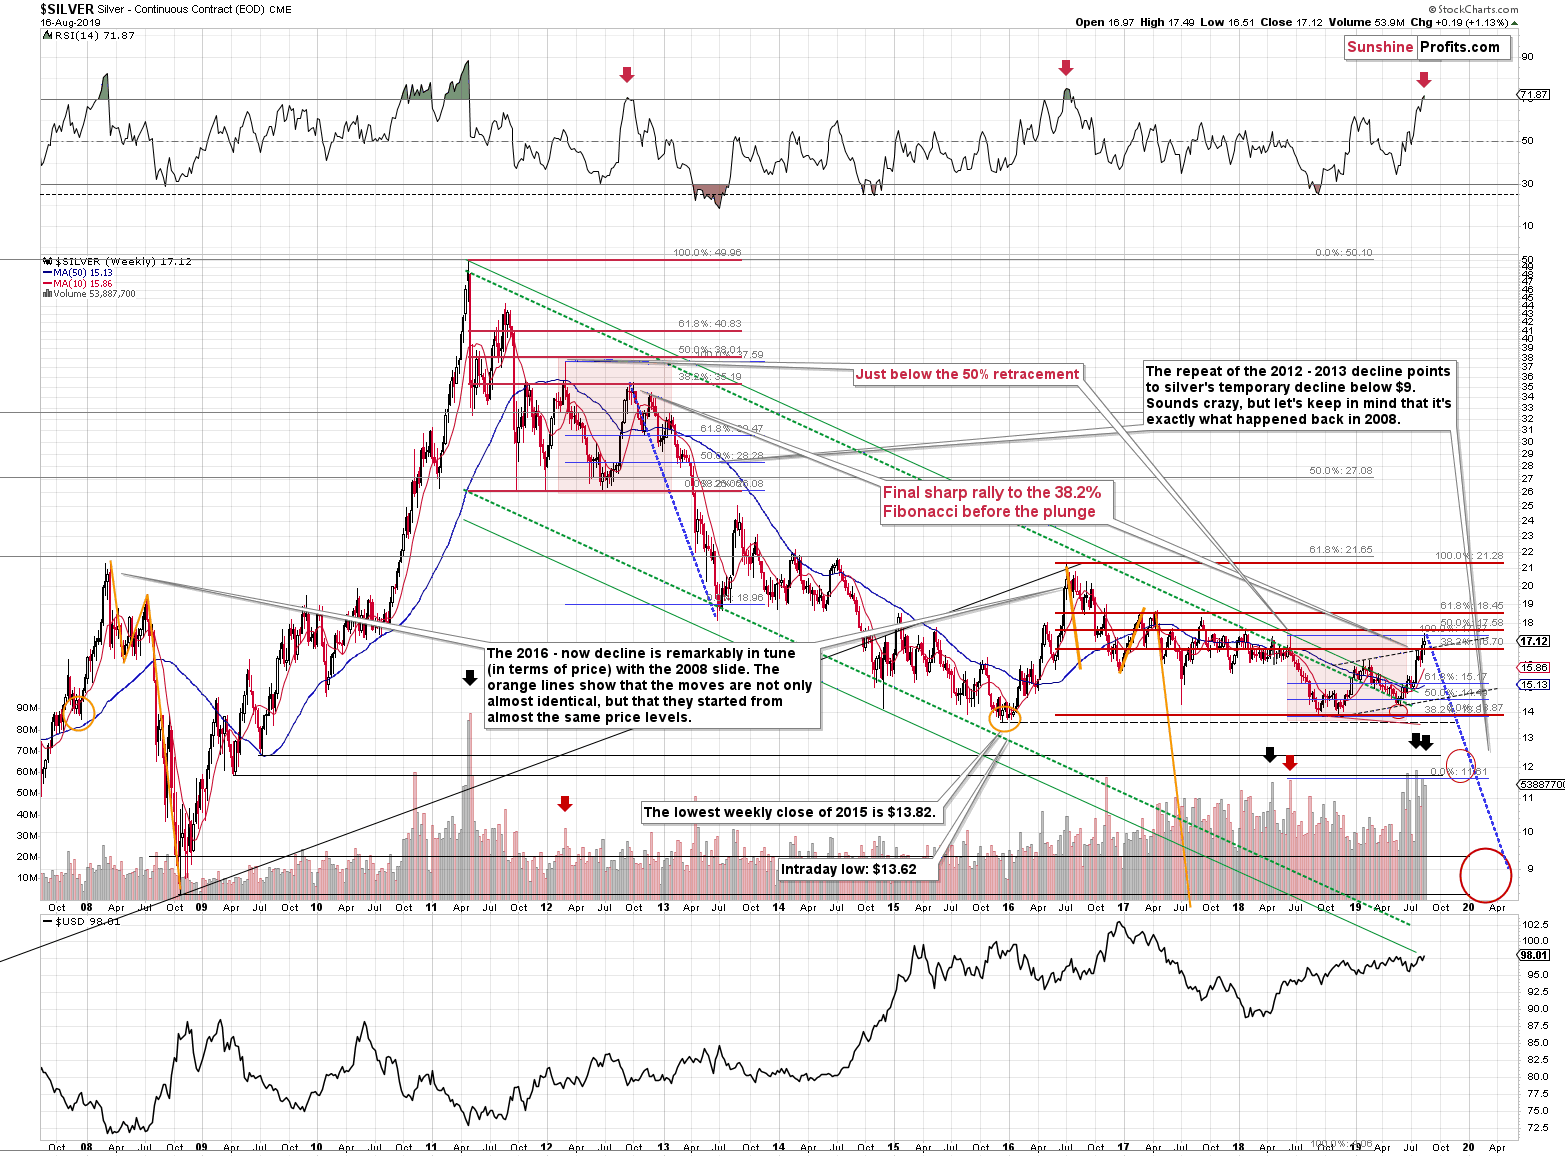
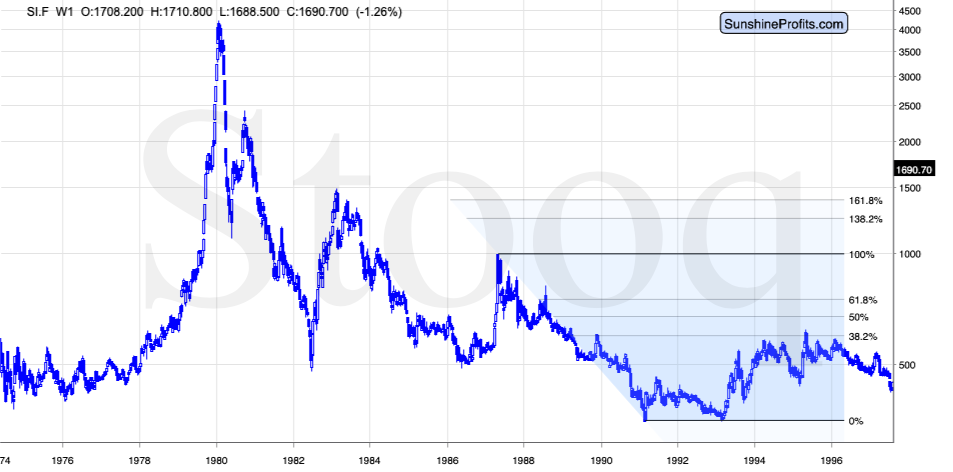
It should, because that's exactly what silver did recently. Silver has its own reasons to decline from the current levels, but what we don't see on the above chart is how similar it is to what happened in the 1980s and 1990s.
The moves are not identical, but they are very similar. The most notable difference is that in the early 1990s, silver broke below the previous lows, and in the 2018 it didn't. This might be the reason why silver moved relatively higher in mid-90s than it did right now.
The lower chart ends in 1996, the top is the February 1996 top - just when gold topped. Can we see similarities to the current situation? Definitely. Silver moved above the recent short-term highs, but it didn't move above or even to the more distant highs (1987 and 2016). In fact, in both cases, silver moved a bit above the 38.2% Fibonacci retracement based on the decline from the most recent prominent high (1987 and 2016), but not above the 50% retracement.
The early 1996 top in silver was the final chance to exit one's long positions and perhaps enter short positions.
Therefore, the analogy that we discovered in case of gold and the USD Index is perfectly confirmed, by what we saw in silver.
What about gold stocks? It's not easy to compare the two periods, because the most popular proxies for the mining stocks that we have right now (HUI Index and the GDX ETF were not available at that time). The HUI Index was launched on March 15, 1996, so a bit after the top in gold.
Fortunately, there are other proxies that we could use. The XAU Index for instance, has been around since January 1979 (interestingly, both were launched close to the major tops, and let's keep in mind that SLV ETF's launch marked a major top in silver as well).
The Miners in the 1990s and Now
The Index topped close to the previous major high (1987), but not at or above it.
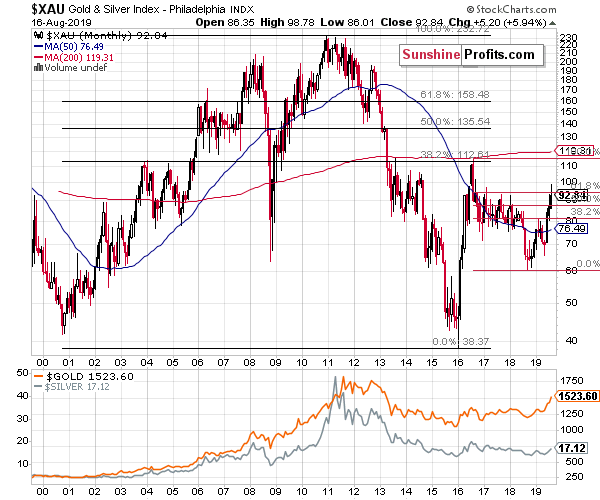
Right now, the XAU Index topped relatively lower, but in a somewhat similar manner. The recent top formed a bit below 100, which is above the 61.8% Fibonacci retracement level. The high has therefore formed below the previous (2016) high but not at or above it.
And what happened next in the XAU Index in the 90s? The XAU Index topped a bit above 150 and then it declined to about 65, taking a bit more than 2 years to do so. It finally bottomed below 42 in 2000. It moved below the previous extreme low. Applying the same to the current situation suggests a move to about 30. Yes, it can happen, and it already did.
While we won't be able to check what the HUI Index did before 1996 as it wasn't trading yet, we can see how big the decline was in case of this particular index. The Index was launched at 200, a bit after the top, so the price at the top would have likely been a bit higher. The final bottom formed with the HUI at 35.31.
The most recent high was about 228, which might have been very close to the HUI's price at gold's February 1996 top, had it been trading at that time. Consequently, if the decline was to repeat itself, the target of 40 or so is not out of the question. Before dismissing it as impossible, please note that this kind of decline had already happened.
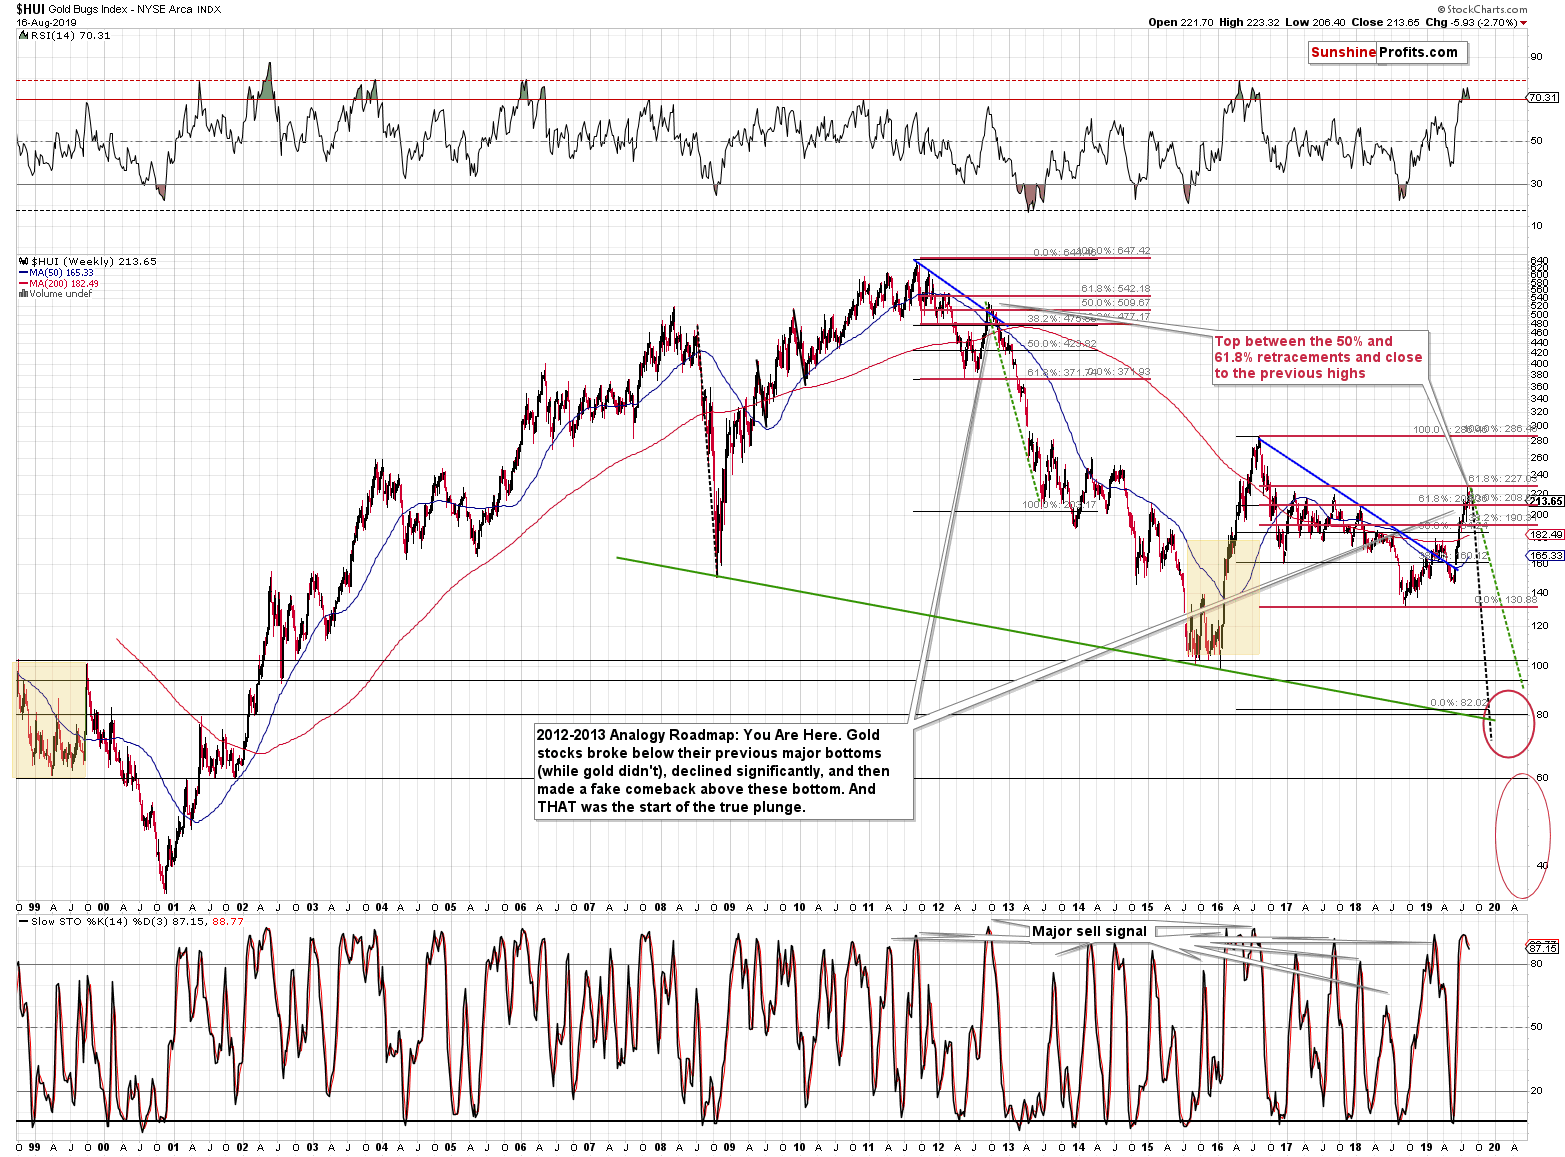
Given the above analogy, you see why the lower bottom target at the above HUI Index chart is not as outlandish as it may appear at first sight. We not saying that it has to be reached. It doesn't. Gold miners can bottom at higher levels, for instance at 60 or 80. But, the 40s are definitely among the viable options.
As far as the very short-term outlook is concerned, we can't tell you much new with regard to Friday's price moves, as there were barely any.
Short-Term PMs Check
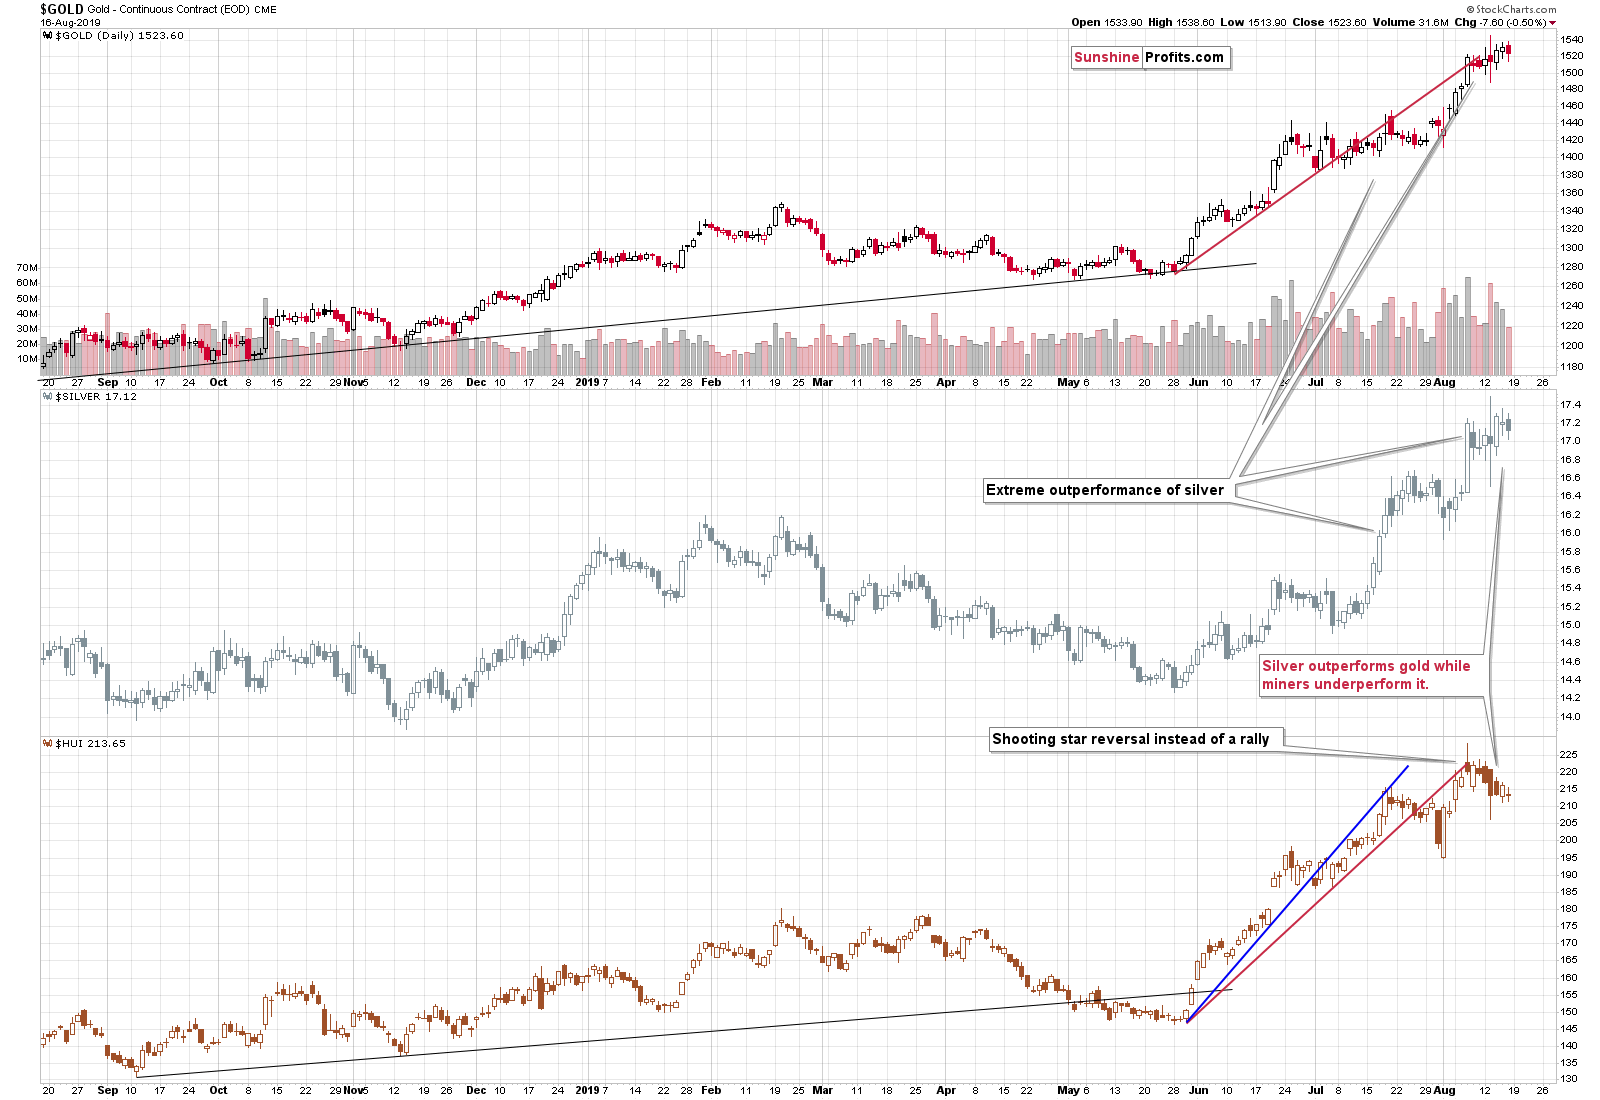
Gold, silver, and mining stocks moved lower, just like they were likely to based on multiple (mostly medium-term oriented) bearish signs. The decline continues also today. Gold is down about $12 and silver is down about $0.16. When gold visibly invalidates the breakout above the $1,500 level, the decline is likely to pick up. $20, $30, $40, or bigger daily declines in gold are likely to become the new normal. Yes, it's hard to imagine this happening given the recent short-term gains, but the history is very likely to repeat itself given all the similarities to what we saw in the 90s and multiple other signs.
Summary
Summing up, taking the big investment picture into account, out of the following: gold, silver, gold stocks, silver stocks, the recent upswing was only visible in case of gold. Most of the precious metals portfolio: silver, gold miners, and silver miners suggest that what we saw in the last several months is nothing more than a corrective upswing within a bigger downtrend. The analysis of gold to silver and gold stocks to gold ratios confirms the very bearish outlook for the medium term. The situation in the USD Index is very bullish for the following months and suggests that gold's recent action was likely a fake upswing, similar to the 1995-1996 one. Silver and mining stocks confirm the importance of the 1996-2019 analogy. Mining stocks' recent weakness and silver's strong performance in the very short term both suggest that one should be prepared for much lower, not higher precious metals prices.
As always, we'll keep you - our subscribers - informed.
To summarize:
Trading capital (supplementary part of the portfolio; our opinion): Full speculative short position (250% of the full position) in gold, silver, and mining stocks is justified from the risk/reward perspective with the following stop-loss orders and exit profit-take price levels:
- Gold: profit-take exit price: $1,241; stop-loss: $1,552; initial target price for the DGLD ETN: $51.87; stop-loss for the DGLD ETN $25.37
- Silver: profit-take exit price: $13.81; stop-loss: $17.73; initial target price for the DSLV ETN: $39.08; stop-loss for the DSLV ETN $18.27
- Mining stocks (price levels for the GDX ETF): profit-take exit price: $17.61; stop-loss: $33.37; initial target price for the DUST ETF: $32.28; stop-loss for the DUST ETF $5.78
In case one wants to bet on junior mining stocks' prices (we do not suggest doing so - we think senior mining stocks are more predictable in the case of short-term trades - if one wants to do it anyway, we provide the details), here are the stop-loss details and target prices:
- GDXJ ETF: profit-take exit price: $23.71; stop-loss: $48.42
- JDST ETF: profit-take exit price: $73.32 stop-loss: $9.67
Long-term capital (core part of the portfolio; our opinion): No positions (in other words: cash)
Insurance capital (core part of the portfolio; our opinion): Full position
Whether you already subscribed or not, we encourage you to find out how to make the most of our alerts and read our replies to the most common alert-and-gold-trading-related-questions.
Please note that the in the trading section we describe the situation for the day that the alert is posted. In other words, it we are writing about a speculative position, it means that it is up-to-date on the day it was posted. We are also featuring the initial target prices, so that you can decide whether keeping a position on a given day is something that is in tune with your approach (some moves are too small for medium-term traders and some might appear too big for day-traders).
Plus, you might want to read why our stop-loss orders are usually relatively far from the current price.
Please note that a full position doesn't mean using all of the capital for a given trade. You will find details on our thoughts on gold portfolio structuring in the Key Insights section on our website.
As a reminder - "initial target price" means exactly that - an "initial" one, it's not a price level at which we suggest closing positions. If this becomes the case (like it did in the previous trade) we will refer to these levels as levels of exit orders (exactly as we've done previously). Stop-loss levels, however, are naturally not "initial", but something that, in our opinion, might be entered as an order.
Since it is impossible to synchronize target prices and stop-loss levels for all the ETFs and ETNs with the main markets that we provide these levels for (gold, silver and mining stocks - the GDX ETF), the stop-loss levels and target prices for other ETNs and ETF (among other: UGLD, DGLD, USLV, DSLV, NUGT, DUST, JNUG, JDST) are provided as supplementary, and not as "final". This means that if a stop-loss or a target level is reached for any of the "additional instruments" (DGLD for instance), but not for the "main instrument" (gold in this case), we will view positions in both gold and DGLD as still open and the stop-loss for DGLD would have to be moved lower. On the other hand, if gold moves to a stop-loss level but DGLD doesn't, then we will view both positions (in gold and DGLD) as closed. In other words, since it's not possible to be 100% certain that each related instrument moves to a given level when the underlying instrument does, we can't provide levels that would be binding. The levels that we do provide are our best estimate of the levels that will correspond to the levels in the underlying assets, but it will be the underlying assets that one will need to focus on regarding the signs pointing to closing a given position or keeping it open. We might adjust the levels in the "additional instruments" without adjusting the levels in the "main instruments", which will simply mean that we have improved our estimation of these levels, not that we changed our outlook on the markets. We are already working on a tool that would update these levels on a daily basis for the most popular ETFs, ETNs and individual mining stocks.
Our preferred ways to invest in and to trade gold along with the reasoning can be found in the how to buy gold section. Additionally, our preferred ETFs and ETNs can be found in our Gold & Silver ETF Ranking.
As a reminder, Gold & Silver Trading Alerts are posted before or on each trading day (we usually post them before the opening bell, but we don't promise doing that each day). If there's anything urgent, we will send you an additional small alert before posting the main one.
=====
Latest Free Trading Alerts:
Stocks retraced some of their recent decline on Friday, as investors' sentiment improved following bouncing off the short-term support level, economic data releases. The S&P 500 index continues to trade within a consolidation. Is this a bottoming pattern or just a flat correction before another leg down?
Stocks Ready to Jump Again, but Is Downtrend Over?
=====
Thank you.
Sincerely,
Przemyslaw Radomski, CFA
Editor-in-chief, Gold & Silver Fund Manager

