

Briefly: in our opinion, full (250% of the regular size of the position) speculative short position in gold, silver, and mining stocks is justified from the risk/reward point of view at the moment of publishing this Alert. We are moving the profit-take levels for silver and mining stocks lower.
Gold miners were in the rallying mode in October but all it took were only three days for the GDX ETF (the flagship ETF for the senior mining stocks) to move to a new monthly low and close at the lowest level since mid-July. But you know what? This is really, really boring compared to what we just discovered in gold miners' long-term chart. In the previous weeks we discussed quite a few analogies, with the flagship one being the link between the current situation and what we saw in mid-90s. The long-term strength in the USD Index is likely to translate into much lower gold prices. The key takeaway of these analogies is that the decline to the final lows in the precious metals market has likely begun in August. The thing that we just discovered in the gold stock chart fits all this so well that we're surprised that we haven't seen it sooner. To our defense, we still saw it sooner than anyone else.
So... What would you say if we told you that the gold stock history is repeating with an almost exact 20-year delay? It might raise a few eyebrows and nothing more... Until you saw the chart that shows you how precise it is and how well it fits to what happened now and what happened in 2012 as well. On to the chart, then!
The Miners' Analogy
(as a reminder, clicking on the chart will expand it)
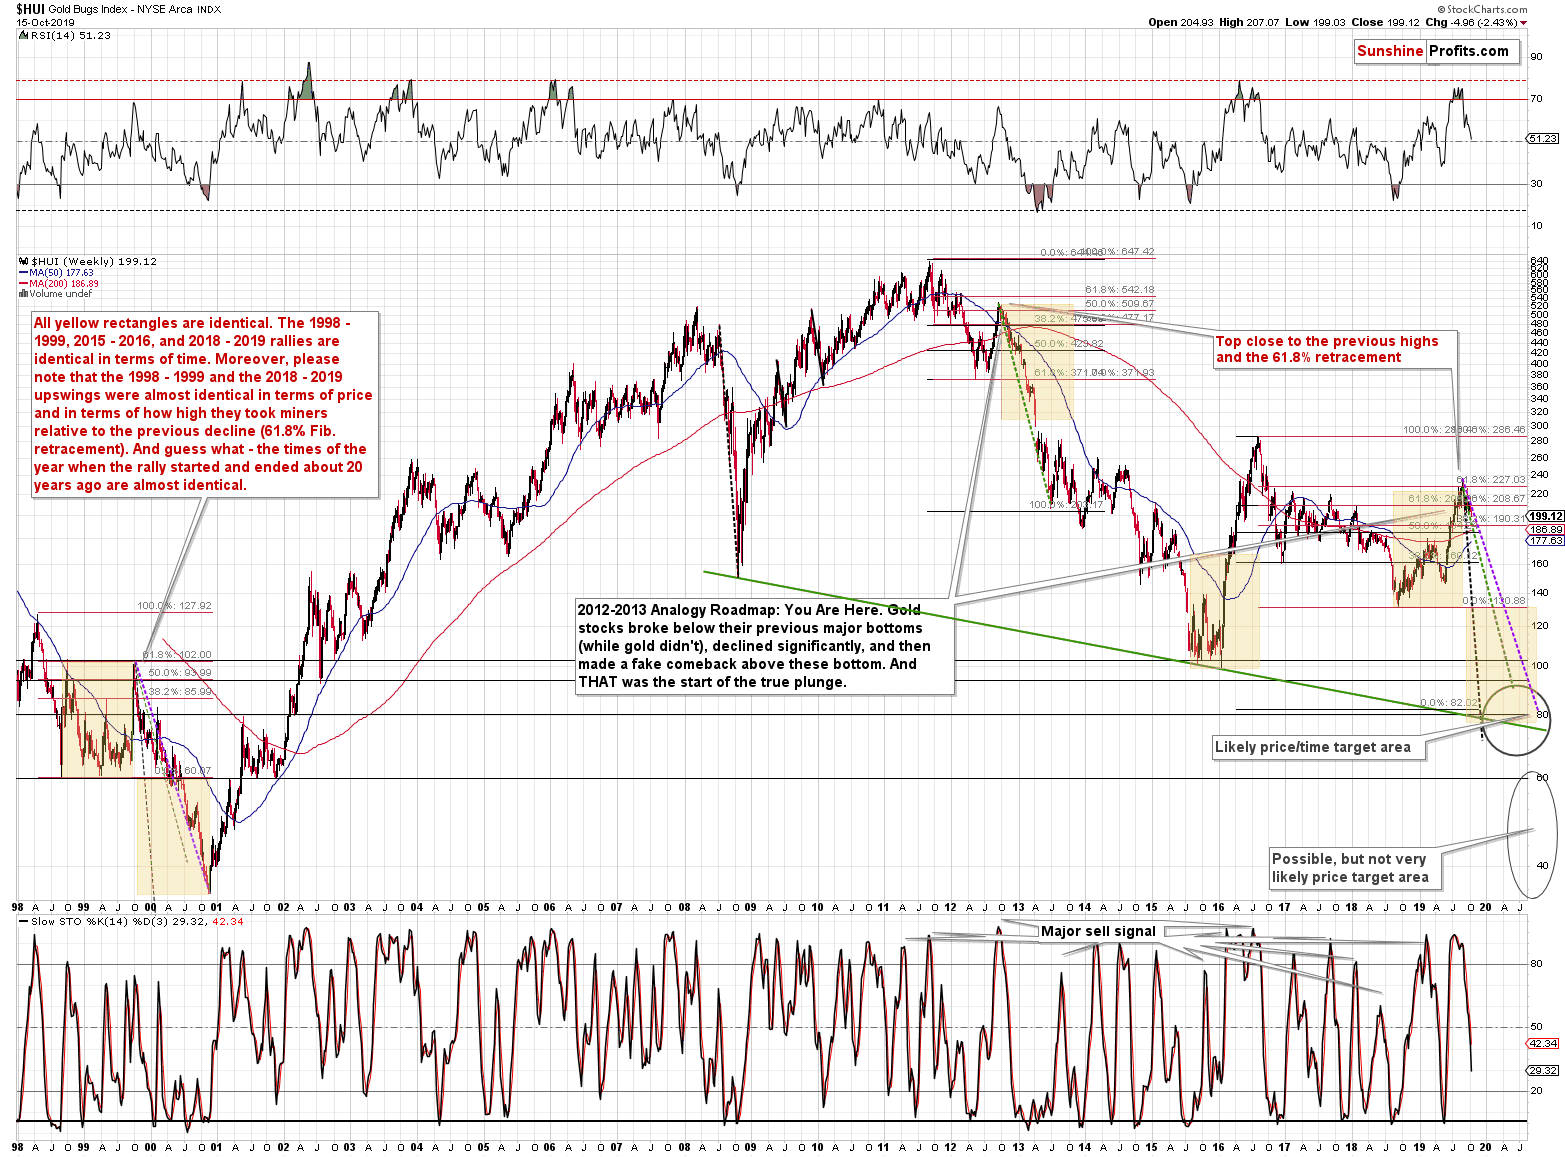
Let's start with something relatively more familiar - the Fibonacci retracements. Back in 2012, the HUI Index retraced almost 61.8% of the preceding rally before the decline continued. That was one of the reasons that we thought that the 2019 rally won't get much above this retracement, if at all. Indeed, the breakout above this retracement was very short-lived. However, this is not the only time when this retracement stopped a sizable, yet counter-trend rally before a big decline.
The 1999 top formed almost exactly at the 61.8% Fibonacci retracement. That's one similarity between what happened recently and in 2012.
The second similarity is what's so exciting about this discovery. The length of the rally. All yellow rectangles on the above chart are identical. The 1998 - 1999, 2015 - 2016, and 2018 - 2019 rallies are identical in terms of time. Most importantly, the 1998 - 1999 and the 2018 - 2019 upswings were almost identical in terms of both: time and price. And that's in addition to both rallies ending at the same Fibonacci retracement.
Let's re-state it again. Both rallies took practically the same amount of time, and the rallies were almost alike in terms of size - percentagewise.
But wait, there's more!
The times of the year when the rally started and ended about 20 years ago are almost identical as well. The 1998 rally started right after the middle of the year and the same thing happened in 2018. The rally ended in the second part of 1999 and the same was the case right now. The month is not the same, but it's so close that the gold stock seasonality might have influenced the prices in the similar way, which means that the follow-up action could be very similar.
The Follow-Up Action
Based on the way in which the previous bear market in gold stocks ended, it seems that we have about a year of lower prices ahead of us and the HUI Index will decline at or a bit below the 80 level. That's in perfect tune with the upper one of the price target areas that we've been featuring on the above chart for some time now. The key of the additional trading techniques pointing to the 80 level or its proximity as the downside target are the early 1999, and 2011 tops as well as the early 2002 bottom, and the long-term declining support line based on the 2008 and 2016 lows.
The implications extend beyond just the final target - the analogy can tell us something important about the likely corrective upswings that we'll see along the way. Some of them will be relatively small, but there will also be those that are visible even from the long-term point of view, such as the one that we saw in early 2000.
How to detect them? Let's get back to the basics. When does a price rally, even though it remains in a downtrend? When it gets too low, too soon - at least in many cases. The key follow-up question is "too low compared to what?". And that's where the analogy to the 1999 - 2000 decline comes into play.
The purple line is the line that connects the start and the end of the 1999 - 2000 decline. The green line marks the start and the end of the 2012 - 2013 decline and the black one is based on the 2008 decline. There are two rules that we can detect based on these analogies.
First, the time after which we saw corrections during longer declines is similar to the times when the quicker decline ended. The end of the black line (early 2000) is also when we - approximately - saw the first big corrective upswing during the decline. Applying the same technique to the recent top provides us with mid-December (that's in about 2 months) as the likely bottoming target date. Naturally, it's likely to be just a short-term bottom that would be followed by a corrective upswing and then even lower prices.
Second, the chance of a corrective upswing and the chance that such upswing would be significant increases dramatically when price moves visibly below the dashed line. There are 3 dashed lines to choose from - each based on a different decline - so the question is which one should be used. It seems that the middle one is appropriate as it was most useful in 2000. The 2012-2013 decline took place mostly above the dashed line that connected its starting and ending point and it didn't have profound corrective upswings until it ended. What we saw 20 years ago, however, was very different. The price declined sharply initially, but then corrected a few times and the more price moved below the declining green dashed line, the bigger the corrective upswing was.
So, if the HUI moves visibly below the declining green dashed line, it will suggest that the miners got too low too fast and are likely to bounce back up sooner rather than later.
Right now the HUI Index value is close to the declining green resistance line, which means that if we see a sharp and/or significant decline from here, it will likely be corrected. Let's keep in mind that the first part of the move lower in 1999 was very sharp, so it might be the case that gold miners drop fast soon as well.
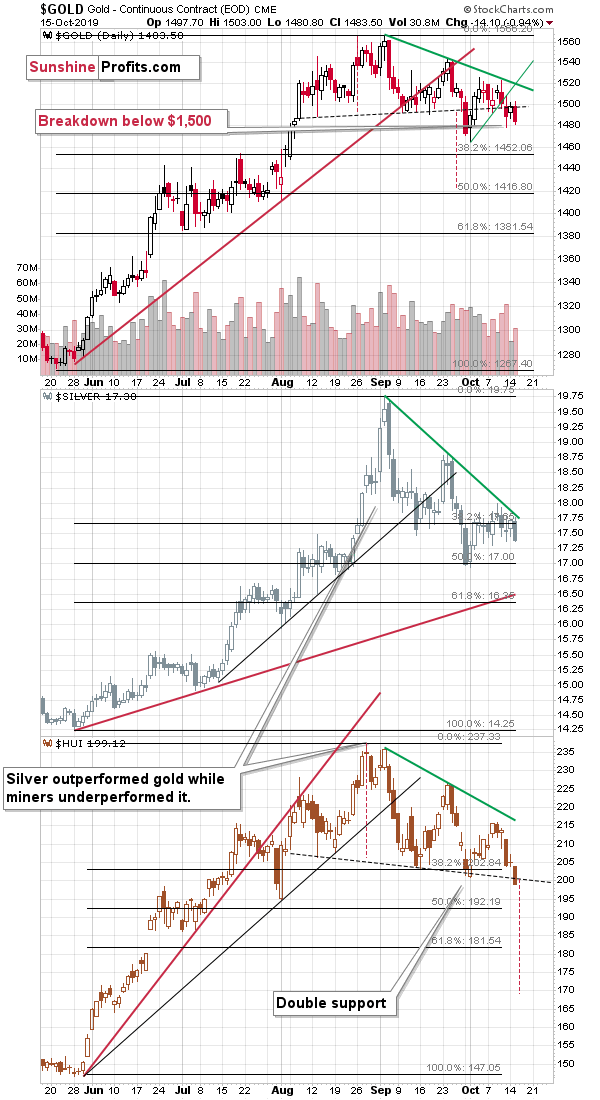
Based on what we saw yesterday, this is indeed very likely. Gold closed below $1,500 for the third consecutive day, which means that the breakdown below this level was - finally - verified. "Finally", because there was already one attempt to break below this level in late-September and it was then invalidated. Right now, it's confirmed, so the odds for decline's continuation are significantly higher.
Another confirmation comes from the mining stocks themselves. They closed at new monthly low, even though neither gold, nor silver did. They simply continue to underperform gold, which points to lower prices in the following weeks.
The declining dashed line on the HUI Index chart is the neck level of a head and shoulders formation that's less than perfectly symmetrical. There are 2 right shoulders, which is not that common, but it happens. The implications of the formation remain intact and so does the price target based on it. The neck was just broken and unless the breakdown is invalidated today or tomorrow, the HUI Index will likely slide to about 170 or lower.
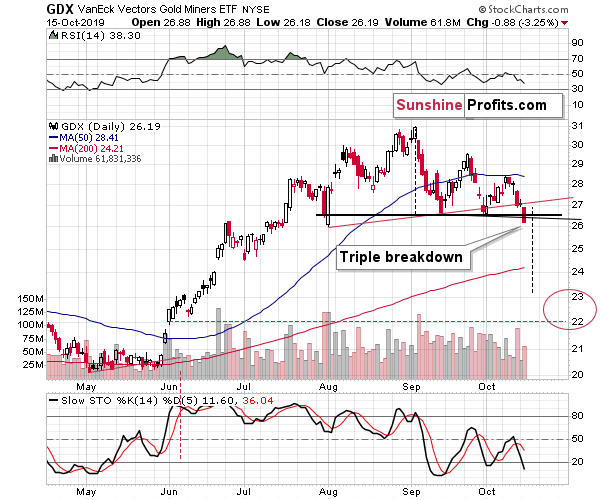
We see the same kind of performance in the GDX ETF. In fact, we see a bit more of it, as there is not just one support line that was broken here, but three. Two are rising and declining support lines based on the previous lows and the third one is the early August low itself.
Either way, we saw a breakdown and the implications are bearish. The target based on the head-and-shoulders formation is a bit above $23 (it's unclear which support line one should take as the neck, so this is the average of two predictions).
The target area starts at this level but it extends lower, to the upper border of the previous price gap, (about $22) which might also serve as a strong support for a while. This creates the $22 - $23.2 price target area for the following few weeks.
Based on the above, and based on how gold, silver, and mining stocks performed recently in general, we are adjusting the profit-take level for the current short position.
Naturally, the key bearish factors for the medium term remain intact.
Key Factors to Keep in Mind
Critical factors:
- The USD Index broke above the very long-term resistance line and verified the breakout above it. Its huge upswing is already underway.
- The USD's long-term upswing is an extremely important and bearish factor for gold. There were only two similar cases in the past few decades, when USD Index was starting profound, long-term bull markets, and they were both accompanied by huge declines in gold and the rest of the precious metals market
- Out of these two similar cases, only one is very similar - the case when gold topped in February 1996. The similarity extends beyond gold's about a yearly delay in reaction to the USD's rally. Also the shape of gold price moves prior to the 1996 high and what we saw in the last couple of years is very similar, which confirm the analysis of the gold-USD link and the above-mentioned implications of USD Index's long-term breakout.
- The similarity between now and 1996 extends to silver and mining stocks - in other words, it goes beyond USD, gold-USD link, and gold itself. The white metal and its miners appear to be in a similar position as well, and the implications are particularly bearish for the miners. After their 1996 top, they erased more than 2/3rds of their prices.
- Many investors got excited by the gold-is-soaring theme in the last few months, but looking beyond the short-term moves, reveals that most of the precious metals sector didn't show substantial strength that would be really visible from the long-term perspective. Gold doesn't appear to be starting a new bull market here, but rather to be an exception from the rule.
- Gold's True Seasonality around the US Labor Day points to a big decline shortly.
Very important, but not as critical factors:
- Long-term technical signs for silver, i.a. the analogy in terms of price to what we saw in 2008, shows that silver could slide even below $10.
- Silver's very long-term cycles point to a major reversal taking place right now and since the most recent move was up, the implications are bearish (this is also silver's technical sign, but it's so important that it deserves its own point)
- Long-term technical signs for gold stocks point to this not being a new gold bull market beginning. Among others, it's their long-term underperformance relative to gold that hint this is rather a corrective upswing within a bear market that is not over yet.
- Record-breaking weekly volume in gold is a strong sign pointing to lower gold prices
Important factors:
- Extreme volume reading in the SIL ETF (proxy for silver stocks) is an effective indication that lower values of silver miners are to be expected
- Silver's short-term outperformance of gold, and gold stocks' short-term underperformance of gold both confirm that the precious metals sector is topping here
- Gold topped almost right at its cyclical turning point, which makes the trend reversal more likely
- Copper broke below its head-and-shoulders pattern and confirmed the breakdown. The last time we saw something similar was in April 2013, when the entire precious metals sector was on the verge of plunging lower.
Moreover, please note that while there may be a recession threat, it doesn't mean that gold has to rally immediately. Both: recession and gold's multi-year rally could be many months away - comparing what happened to bond yields in the 90s confirms that.
Copper moved above the neck level of its head-and-shoulders pattern that's based on the intraday lows, but it didn't invalidate the analogous level based on the weekly closing prices, so we don't think it's justified to say that this bearish formation was invalidated at this time.
Summary
Summing up, it seems that the corrective upswing in gold is over and that the yellow metal's big decline is already underway (and that it had started in August as we had written previously). The weak performance and breakdown of mining stocks confirms the bearish outlook. The similarity to how gold stocks rallied and then declined about 20 years ago provides us with a specific time target for the decline in the entire precious metals sector - it's likely to take place for about 1 year from now. That's not particularly close, but the road lower that gold, silver, and miners are likely to take is not short either. The profits from the short position in gold, silver and mining stocks are likely to be legendary, but the difficult part is not to miss the decline. Fortunately, the pace of decline that we saw 20 years ago provides suggestions regarding when it might be worth to bet on the corrective upswing with one's trading capital and when it's better to wait it out. Based on the analogy to the above-mentioned decline, the next medium-term bottom might take place in about 2 months, in mid-December.
On a side note, while we're discussing mining stocks in general, we would like to remind you that we have two tools dedicated to providing up-to-date (recalculated after each trading day) gold stock- and silver stock rankings. We previously received feedback that these tools are a bit too complicated to use, so we thought it might be a good idea to start providing a newsletter dedicated to regularly discussing the top positions from the rankings. We have just published the pilot issue of such a newsletter and you can access it by clicking on this link. Please note that the ranking aims to select stocks with the greatest leverage to the underlying metal's prices. So, instead of shorting the GDX it might be a good idea to short the gold stocks and silver stocks that are most leveraged to gold and silver for the additional bang for the buck. Of course, this applies only if you want to increase your leverage. Many people do want it and they apply it through leveraged ETNs. The ETNs may be leveraged even more, but due to their inherent time decay, many traders and investors may prefer to use individual mining stocks after all. We would appreciate your thoughts on this pilot article - it will help us to determine whether we should develop it further or not.
As always, we'll keep you - our subscribers - informed.
To summarize:
Trading capital (supplementary part of the portfolio; our opinion): Full speculative short position (250% of the full position) in gold, silver, and mining stocks are justified from the risk/reward perspective with the following stop-loss orders and binding exit profit-take price levels:
- Gold: profit-take exit price: $1,391; stop-loss: $1,573; initial target price for the DGLD ETN: $36.37; stop-loss for the DGLD ETN: $25.44
- Silver: profit-take exit price: $15.11; stop-loss: $19.06; initial target price for the DSLV ETN: $24.88; stop-loss for the DSLV ETN: $14.07
- Mining stocks (price levels for the GDX ETF): profit-take exit price: $23.21; stop-loss: $30.11; initial target price for the DUST ETF: $11.69; stop-loss for the DUST ETF $6.08
In case one wants to bet on junior mining stocks' prices, here are the stop-loss details and target prices:
- GDXJ ETF: profit-take exit price: $31.62; stop-loss: $41.22
- JDST ETF: profit-take exit price: $24.88 stop-loss: $12.46
Long-term capital (core part of the portfolio; our opinion): No positions (in other words: cash)
Insurance capital (core part of the portfolio; our opinion): Full position
Whether you already subscribed or not, we encourage you to find out how to make the most of our alerts and read our replies to the most common alert-and-gold-trading-related-questions.
Please note that the in the trading section we describe the situation for the day that the alert is posted. In other words, it we are writing about a speculative position, it means that it is up-to-date on the day it was posted. We are also featuring the initial target prices, so that you can decide whether keeping a position on a given day is something that is in tune with your approach (some moves are too small for medium-term traders and some might appear too big for day-traders).
Plus, you might want to read why our stop-loss orders are usually relatively far from the current price.
Please note that a full position doesn't mean using all of the capital for a given trade. You will find details on our thoughts on gold portfolio structuring in the Key Insights section on our website.
As a reminder - "initial target price" means exactly that - an "initial" one, it's not a price level at which we suggest closing positions. If this becomes the case (like it did in the previous trade) we will refer to these levels as levels of exit orders (exactly as we've done previously). Stop-loss levels, however, are naturally not "initial", but something that, in our opinion, might be entered as an order.
Since it is impossible to synchronize target prices and stop-loss levels for all the ETFs and ETNs with the main markets that we provide these levels for (gold, silver and mining stocks - the GDX ETF), the stop-loss levels and target prices for other ETNs and ETF (among other: UGLD, DGLD, USLV, DSLV, NUGT, DUST, JNUG, JDST) are provided as supplementary, and not as "final". This means that if a stop-loss or a target level is reached for any of the "additional instruments" (DGLD for instance), but not for the "main instrument" (gold in this case), we will view positions in both gold and DGLD as still open and the stop-loss for DGLD would have to be moved lower. On the other hand, if gold moves to a stop-loss level but DGLD doesn't, then we will view both positions (in gold and DGLD) as closed. In other words, since it's not possible to be 100% certain that each related instrument moves to a given level when the underlying instrument does, we can't provide levels that would be binding. The levels that we do provide are our best estimate of the levels that will correspond to the levels in the underlying assets, but it will be the underlying assets that one will need to focus on regarding the signs pointing to closing a given position or keeping it open. We might adjust the levels in the "additional instruments" without adjusting the levels in the "main instruments", which will simply mean that we have improved our estimation of these levels, not that we changed our outlook on the markets. We are already working on a tool that would update these levels on a daily basis for the most popular ETFs, ETNs and individual mining stocks.
Our preferred ways to invest in and to trade gold along with the reasoning can be found in the how to buy gold section. Additionally, our preferred ETFs and ETNs can be found in our Gold & Silver ETF Ranking.
As a reminder, Gold & Silver Trading Alerts are posted before or on each trading day (we usually post them before the opening bell, but we don't promise doing that each day). If there's anything urgent, we will send you an additional small alert before posting the main one.
=====
Latest Free Trading Alerts:
Gold and silver are our main focus, no doubt about it. But they are only a part of the precious metals market. Actually, there is another side of the market which could be overlooked by investors starting to look into the precious metals market. So, we would like to take some time to explain how this part is important and why you may be interested in it at all.
Selecting Silver Miners for October 2019
Crude oil bounced from its yesterday's lows, and the oil bulls rebuffed another attempt to move lower earlier today. Does that mean that the upswing can continue now, or a cautious approach would win the day?
Where Next for Oil After Its Double Reversal?
=====
Thank you.
Sincerely,
Przemyslaw Radomski, CFA
Editor-in-chief, Gold & Silver Fund Manager

