

Briefly: in our opinion, full (250% of the regular size of the position) speculative short position in gold, silver, and mining stocks is justified from the risk/reward point of view at the moment of publishing this Alert.
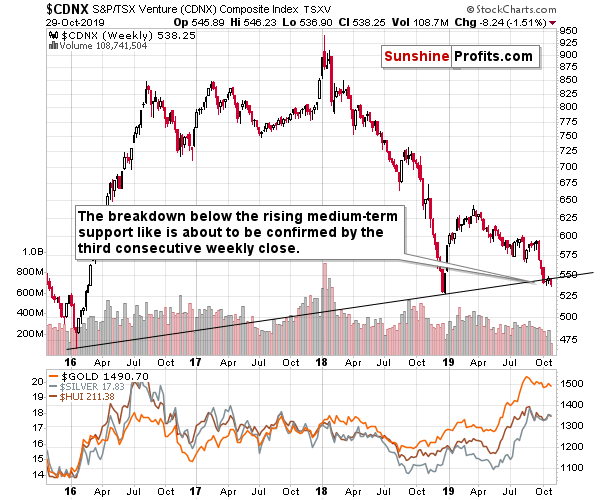
Do you know what mining companies did yesterday? They verified a major breakdown, confirming the extremely bearish outlook for the following months. What? The miners rallied? Oh, you mean the senior mining stocks (HUI, GDX...) - then yes, they moved a bit higher. But the junior miners (Toronto Stock Exchange Venture Index) just declined after confirming breakdown below the very important rising support line, which has profound implications for the next months. Truth be told, what's happening in the senior miners can be used to indicate the next short-term moves as well, but we'll start today's analysis with the big picture.
The Mining Index That Is Breaking Down
On October 25, we wrote the following about juniors' outlook:
What's going on in this proxy for junior miners?
It's declining - that's what's happening. In particular, it declined below the rising medium-term support line that's based on two profound and clear bottoms: the 2016 and 2018 lows. And it's not something that happened just yesterday. It happened about 3 weeks ago and unless the TSX Venture Index rallies today, this week's close will mark the third consecutive weekly close below this line. That's important, because this means that the breakdown - even though it's tiny - was just confirmed. And confirmed breakdowns are likely to be followed by further declines.
Now, the more significant the support that was broken, the bigger decline one can expect, and the line that was just broken is definitely significant.
This means that the confirmed breakdown in the TSX Venture sends a huge warning to the gold, silver, and mining stock bulls. It's not an immediate-term or even a short-term sign (we have plenty of them coming from other places), but it is a powerful sign pointing to sector-wide decline in the following months. We have been warned by yet another market. Those who refuse to listen will have to face the costly consequences.
The decline's continuation means that everything that we wrote above is more than up-to-date. It was just confirmed by juniors' price action. If the breakdown was not a big deal, the junior miners could have rallied, just like the senior miners did. But that's not what happened. The previously broken support has now turned into resistance, and it makes the possible short-term upside very limited. The downside, however, is huge.
The nearest strong support is the 2018 low, but we doubt that it will hold, given that the recent breakdown took place so close to it. The price had already taken a breather and it's ready to slide further. This means that the next likely target is the early-2016 bottom. That's far from the current price, so the move is likely to significant. And, since the medium-term moves are more or less aligned between the major parts of the precious metals sector and the Toronto Stock Exchange Venture Index, it seems that gold, silver, and senior mining stocks have much further to drop in the following months too.
Speaking of senior mining stocks, let's see how they performed compared to the price of gold and compared to other stocks.
Examination of Senior Miners
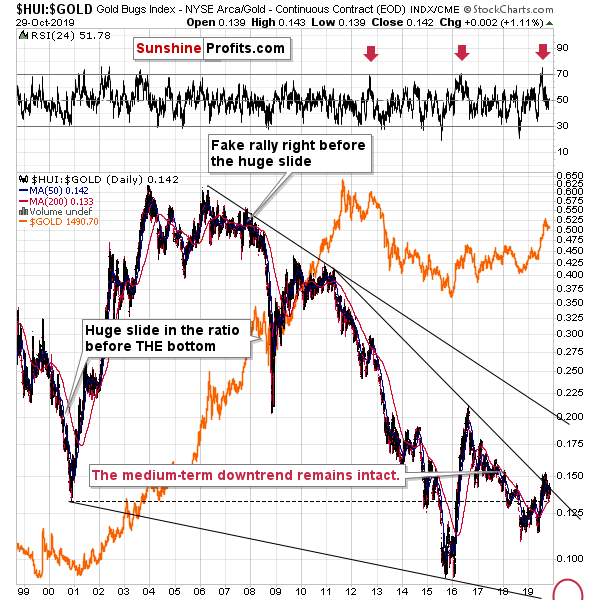
The HUI to gold ratio is a good way to measure gold stocks' relative performance to gold. And this ratio is once again in the decline mode after a rather sharp counter-trend move. Why was the recent upswing a counter-trend move and not the start of a beginning of a new trend? Because the attempt to break above the declining resistance line failed miserably. The current small move lower in the ratio is the very early part of the price move right after the breakout was invalidated.
Invalidations are strong bearish signs in general. The line that was broken was based on two major (2011 and 2016) tops, therefore it's important - and so is the invalidation of the breakdown above it. Focusing on what one saw in the previous several days is tempting, especially for beginning gold traders, but keeping the context in mind is absolutely critical if one wants to make serious gains in this - or, in fact, any other - market.
Moreover, let's remember that the 2019 top in the ratio made the RSI indicator move above 70 and there were only two similar cases in the past 15 years. That was the late-2012 top and the 2016 top. Both were followed by substantial declines in the ratio, in gold stocks, and in gold itself. The implications here are clearly bearish for the following months and weeks. The above chart doesn't signal anything for gold in the next several days, though. Given how rich this week is in terms of news, things could get quite volatile, especially given the looming reversal turning point, but we'll get to that in the following text.
For now, let's take a look at gold miners' different ratio - the one that compares their prices with the ones of other stocks.
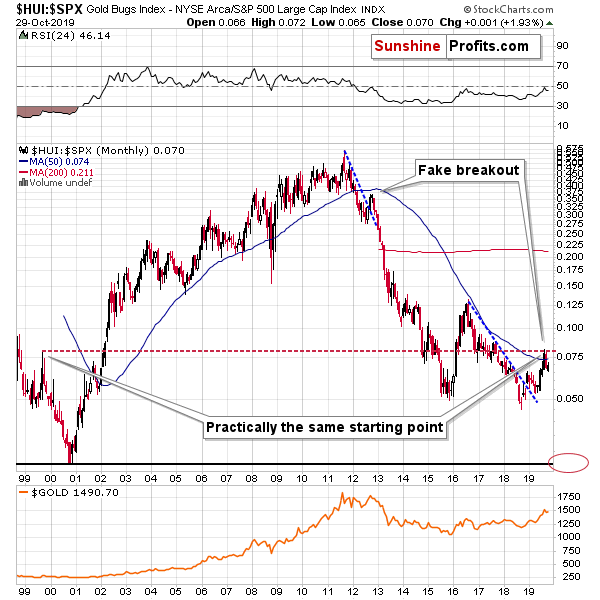
To make long story short, almost nothing changed on the above chart since we featured it previously and what we wrote about it then, remains up-to-date also today:
Dividing the value of the HUI Index by the value of the S&P 500 Index provides us with a ratio that shows us how miners are performing relative to other stocks. The interpretation is quite straightforward. During bull markets this ratio rallies and during bear market this ratio declines.
The ratio was on the rise between 2000 and 2011 and it's been declining since 2011 with two notable corrective upswings. The one in 2016 was big, and the recent one was relatively small.
Now, what is so remarkable about the recent corrective upswing is that it ended at practically the same level, just where the 1999 corrective upswing had ended.
This is astonishing. Based on other analogies, that year was very similar to what we saw right now, and it turns out that relative to other stocks, both situations were practically identical. These rallies (the 1999 and 2018-2019 one) started from similar price levels too.
History tends to rhyme, which suggests that we should expect the HUI to S&P 500 ratio to decline severely in the following months. The target is at about 0.027. The S&P 500 is currently trading at about 3000, which means that the HUI Index could fall to about 0.027 x 3000 = 81. This level is in tune with the target that we described based on the HUI Index chart, which further validates this forecast.
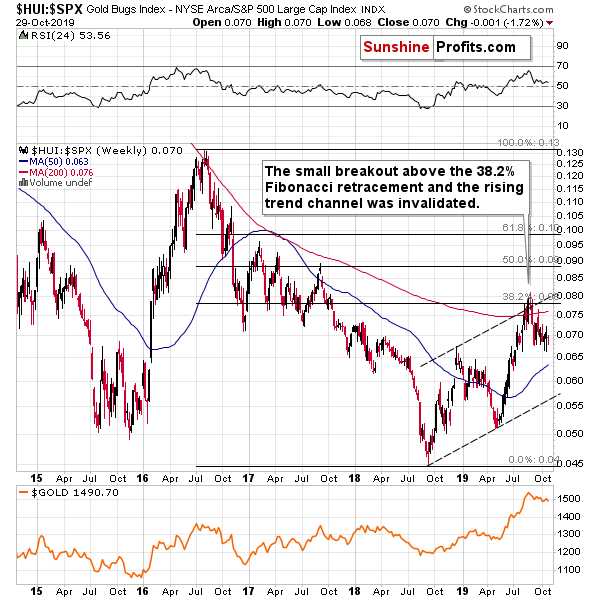
On a medium-term basis, the rally in the ratio seems to be over as well. The ratio moved a bit above its 38.2% Fibonacci retracement and the rising trend channel (dashed lines), but both small breakouts were invalidated, which acted as a strong sell signal. The ratio has been in the decline mode ever since.
Having said that, let's take a look at yesterday's prices and - what may appear to be - changes.
Yesterday in the PMs
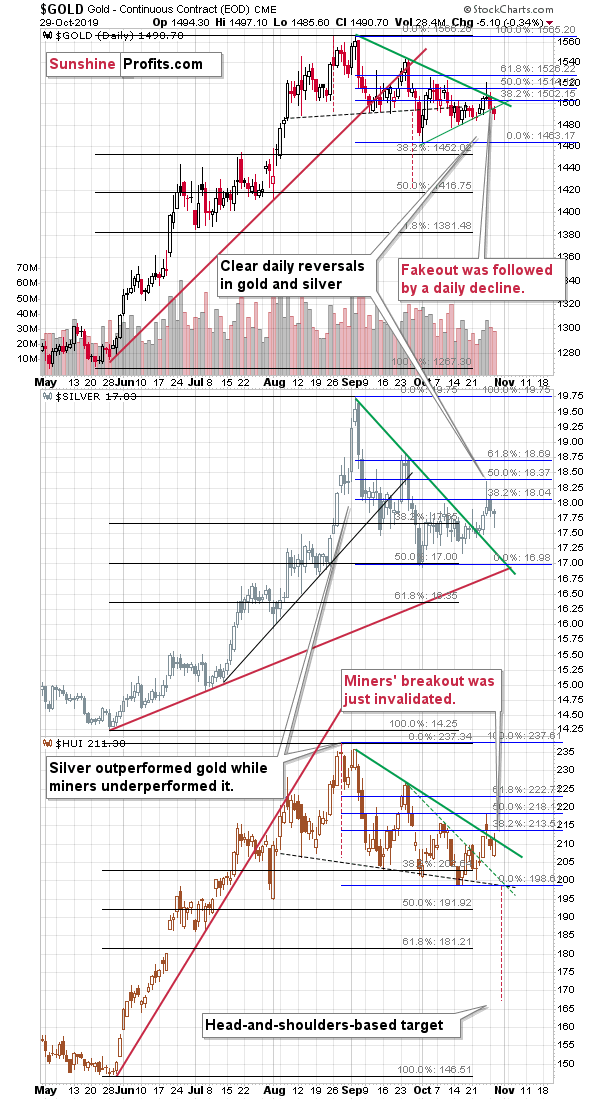
Gold broke below the rising green support line, which is bearish at first sight.
Silver moved lower, but reversed and erased practically all the previous gains within the same day.
Gold stocks reversed as well and they even managed to close the day higher, showing some very short-term strength. That's bullish at first sight.
What should one make of all these contradictory signs?
As disappointing as it may sound, the best course of action seems to be not making anything of them. The Fed's interest decision is today and some kind of erratic movement in the very near term is to be expected. That's one of the reasons not to engage in day trading on such days, for example. So, gold's breakdown is not as bearish as it may appear at first sight, silver's reversal is not as meaningful as it may seem, and miners' strength is not really strength, especially since that the HUI Index closed right at the declining resistance line, without breaking above it in terms of the daily closing prices.
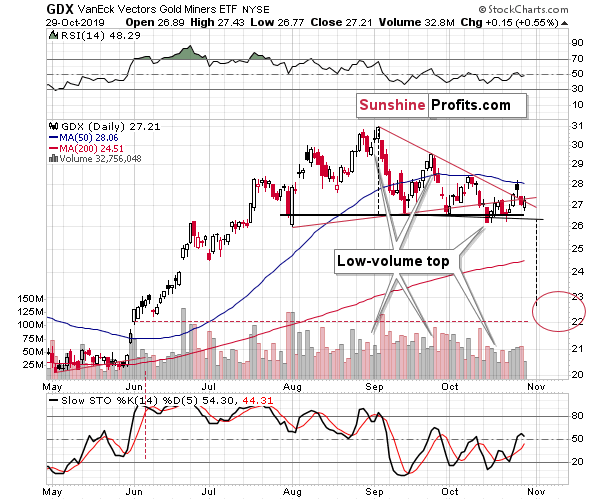
The GDX ETF didn't show any substantial strength either. The additional detail that we can see on the above chart is the relatively low volume that accompanied yesterday's 0.55% upswing. This serves as a perfect confirmation of the above - people are reluctant to trade before major news announcement and thus the price might move in a more or less random way as the market forces aren't at work to their full extent. After we learn the Fed's decision, after we hear what Powell has to say during the press conference, and after a day or two pass, the dust will settle, with the markets most likely resuming their previous moves. In case of the precious metals market, this implies a decline.
On a side note, please note how GDX reversed on Monday - it happened right at the intersection of the two red resistance and support lines - right at the vertex, confirming the usefulness of the vertex-reversal technique.
Naturally, the other key bearish factors for the medium term remain intact.
Key Factors to Keep in Mind
Critical factors:
- The USD Index broke above the very long-term resistance line and verified the breakout above it. Its huge upswing is already underway.
- The USD's long-term upswing is an extremely important and bearish factor for gold. There were only two similar cases in the past few decades, when USD Index was starting profound, long-term bull markets, and they were both accompanied by huge declines in gold and the rest of the precious metals market
- Out of these two similar cases, only one is very similar - the case when gold topped in February 1996. The similarity extends beyond gold's about a yearly delay in reaction to the USD's rally. Also the shape of gold price moves prior to the 1996 high and what we saw in the last couple of years is very similar, which confirm the analysis of the gold-USD link and the above-mentioned implications of USD Index's long-term breakout.
- The similarity between now and 1996 extends to silver and mining stocks - in other words, it goes beyond USD, gold-USD link, and gold itself. The white metal and its miners appear to be in a similar position as well, and the implications are particularly bearish for the miners. After their 1996 top, they erased more than 2/3rds of their prices.
- Many investors got excited by the gold-is-soaring theme in the last few months, but looking beyond the short-term moves, reveals that most of the precious metals sector didn't show substantial strength that would be really visible from the long-term perspective. Gold doesn't appear to be starting a new bull market here, but rather to be an exception from the rule.
- Gold stocks appear to be repeating their performance from 20 years ago, which means that a bottom in the entire precious metals sector is quite likely to form at much lower prices, in about a year
Very important, but not as critical factors:
- Long-term technical signs for silver, i.a. the analogy in terms of price to what we saw in 2008, shows that silver could slide even below $10.
- Silver's very long-term cycles point to a major reversal taking place right now and since the most recent move was up, the implications are bearish (this is also silver's technical sign, but it's so important that it deserves its own point)
- Long-term technical signs for gold stocks point to this not being a new gold bull market beginning. Among others, it's their long-term underperformance relative to gold that hint this is rather a corrective upswing within a bear market that is not over yet.
- Record-breaking weekly volume in gold is a strong sign pointing to lower gold prices
Important factors:
- Extreme volume reading in the SIL ETF (proxy for silver stocks) is an effective indication that lower values of silver miners are to be expected
- Silver's short-term outperformance of gold, and gold stocks' short-term underperformance of gold both confirm that the precious metals sector is topping here
- Gold topped almost right at its cyclical turning point, which makes the trend reversal more likely
- Copper broke below its head-and-shoulders pattern and confirmed the breakdown. The last time we saw something similar was in April 2013, when the entire precious metals sector was on the verge of plunging lower.
Moreover, please note that while there may be a recession threat, it doesn't mean that gold has to rally immediately. Both: recession and gold's multi-year rally could be many months away - comparing what happened to bond yields in the 90s confirms that.
Summary
Summing up, the outlook for the precious metals sector remains very bearish for the following weeks and months and given the recent invalidations of short-term breakouts, the short-term outlook is bearish as well. Based on the triple triangle-vertex-based reversals (visible on today's third chart), we might see a counter-trend move that starts in early November, but based on the recent invalidations of breakouts, this counter-trend move might actually be a small rally after a bigger decline. If, however, we see a move higher this week, it shouldn't cause concern either as it will likely be a combination of temporary and emotional reaction to the upcoming news announcements. Myriads of factors point to much lower precious metals prices so regardless of what happens in the next few days, their prices are likely to slide in the following weeks and months.
The similarity to how gold stocks rallied and then declined about 20 years ago provides us with a specific time target for the decline in the entire precious metals sector - it's likely to take place close to October, 2020. That may seem like a very long wait, but let's keep in mind that the road lower that gold, silver, and miners are likely to take is not short either. The profits from the short position in gold, silver and mining stocks are likely to be legendary, but the difficult part is not to miss the decline. Fortunately, the slide's pace that we saw 20 years ago provides suggestions regarding when it might be worth to bet on the corrective upswing with one's trading capital and when it's better to wait it out. Based on the analogy to the above-mentioned decline, the next medium-term bottom might take place in mid-December.
As always, we'll keep you - our subscribers - informed.
To summarize:
Trading capital (supplementary part of the portfolio; our opinion): F speculative short position (250% of the full position) in gold, silver, and mining stocks are justified from the risk/reward perspective with the following stop-loss orders and binding exit profit-take price levels:
- Gold: profit-take exit price: $1,391; stop-loss: $1,573; initial target price for the DGLD ETN: $36.37; stop-loss for the DGLD ETN: $25.44
- Silver: profit-take exit price: $15.11; stop-loss: $19.06; initial target price for the DSLV ETN: $24.88; stop-loss for the DSLV ETN: $14.07
- Mining stocks (price levels for the GDX ETF): profit-take exit price: $23.21; stop-loss: $30.11; initial target price for the DUST ETF: $14.69; stop-loss for the DUST ETF $6.08
In case one wants to bet on junior mining stocks' prices, here are the stop-loss details and target prices:
- GDXJ ETF: profit-take exit price: $30.32; stop-loss: $41.22
- JDST ETF: profit-take exit price: $35.88 stop-loss: $12.46
Long-term capital (core part of the portfolio; our opinion): No positions (in other words: cash)
Insurance capital (core part of the portfolio; our opinion): Full position
Whether you already subscribed or not, we encourage you to find out how to make the most of our alerts and read our replies to the most common alert-and-gold-trading-related-questions.
Please note that the in the trading section we describe the situation for the day that the alert is posted. In other words, it we are writing about a speculative position, it means that it is up-to-date on the day it was posted. We are also featuring the initial target prices, so that you can decide whether keeping a position on a given day is something that is in tune with your approach (some moves are too small for medium-term traders and some might appear too big for day-traders).
Plus, you might want to read why our stop-loss orders are usually relatively far from the current price.
Please note that a full position doesn't mean using all of the capital for a given trade. You will find details on our thoughts on gold portfolio structuring in the Key Insights section on our website.
As a reminder - "initial target price" means exactly that - an "initial" one, it's not a price level at which we suggest closing positions. If this becomes the case (like it did in the previous trade) we will refer to these levels as levels of exit orders (exactly as we've done previously). Stop-loss levels, however, are naturally not "initial", but something that, in our opinion, might be entered as an order.
Since it is impossible to synchronize target prices and stop-loss levels for all the ETFs and ETNs with the main markets that we provide these levels for (gold, silver and mining stocks - the GDX ETF), the stop-loss levels and target prices for other ETNs and ETF (among other: UGLD, DGLD, USLV, DSLV, NUGT, DUST, JNUG, JDST) are provided as supplementary, and not as "final". This means that if a stop-loss or a target level is reached for any of the "additional instruments" (DGLD for instance), but not for the "main instrument" (gold in this case), we will view positions in both gold and DGLD as still open and the stop-loss for DGLD would have to be moved lower. On the other hand, if gold moves to a stop-loss level but DGLD doesn't, then we will view both positions (in gold and DGLD) as closed. In other words, since it's not possible to be 100% certain that each related instrument moves to a given level when the underlying instrument does, we can't provide levels that would be binding. The levels that we do provide are our best estimate of the levels that will correspond to the levels in the underlying assets, but it will be the underlying assets that one will need to focus on regarding the signs pointing to closing a given position or keeping it open. We might adjust the levels in the "additional instruments" without adjusting the levels in the "main instruments", which will simply mean that we have improved our estimation of these levels, not that we changed our outlook on the markets. We are already working on a tool that would update these levels on a daily basis for the most popular ETFs, ETNs and individual mining stocks.
Our preferred ways to invest in and to trade gold along with the reasoning can be found in the how to buy gold section. Additionally, our preferred ETFs and ETNs can be found in our Gold & Silver ETF Ranking.
As a reminder, Gold & Silver Trading Alerts are posted before or on each trading day (we usually post them before the opening bell, but we don't promise doing that each day). If there's anything urgent, we will send you an additional small alert before posting the main one.
Thank you.
Sincerely,
Przemyslaw Radomski, CFA
Editor-in-chief, Gold & Silver Fund Manager

