
tools spotlight

-
Gold and Silver Grew Some Feathers, but They Won’t Fly Far
January 5, 2022, 8:49 AMWhile the PMs put on brave faces amid the recent surge in the U.S. 10-Year Treasury yield, their fundamental outlooks continue to deteriorate.
To explain, while the Delta variant increased investors’ economic anxiety in August and September, I warned on Sep. 24 that the path to higher interest rates was still intact.
I wrote:
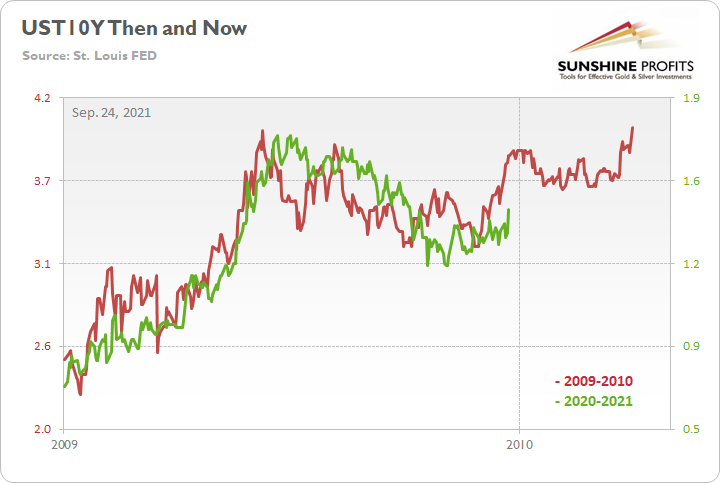
To explain, the red line above tracks the U.S. 10-Year Treasury yield’s rally off of the bottom in 2009-2010, while the green line above tracks the U.S. 10-Year Treasury yield’s current move. If you analyze the fits and starts, you can see that excessive optimism often gives way to excessive pessimism. However, after the dust settled in 2009, the U.S. 10-Year Treasury yield continued its uptrend and ultimately made a new high.
For context, the yield fell off a cliff in April 2010 before another sharp rally ensued in October 2010 (which recouped most of the losses). However, the important point is that the second cliff arrived roughly four months after the U.S. 10-Year Treasury yield recorded its second bottom. As a result, with the pace of the current economic recovery tracking well ahead of 2009, it will likely take a Black Swan event to keep the U.S. 10-Year Treasury yield from following a similar script.
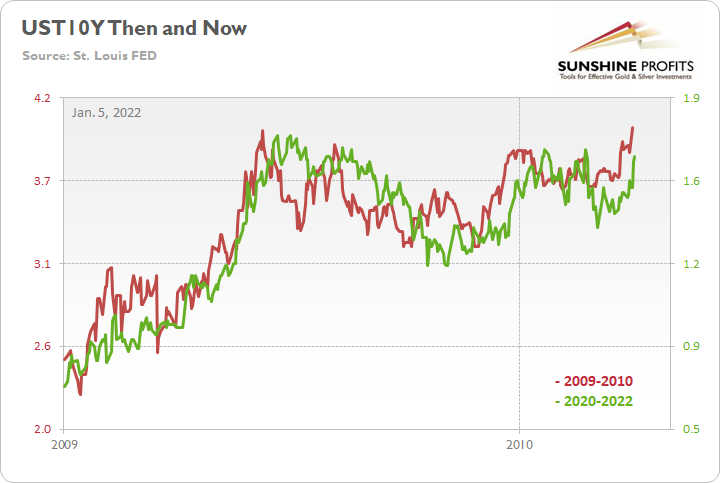
To that point, while the Omicron variant helped delay the fireworks, the U.S. 10-Year Treasury yield is poised to complete its mission. With the Treasury benchmark ending the Jan. 4 session at 1.66%, more upside will likely materialize over the medium term.
Furthermore, while I warned throughout 2021 that higher U.S. Treasury yields would stifle the PMs' upward momentum, their 'flash crashes' often occur with a delay. For example, the PMs can ignore rising interest rates for a few days or a week. However, once fundamental pressure becomes too much to bear, the PMs often suffer sharp daily sell-offs that wipe out days or weeks of gains. As a result, don't be surprised if another one materializes once Omicron fears fade.
Furthermore, while the PMs have enjoyed Fed speakers' holiday quiet period, the fundamentals remain unchanged: the Fed is hawked up, and simmering inflation should result in higher interest rates in the coming months.
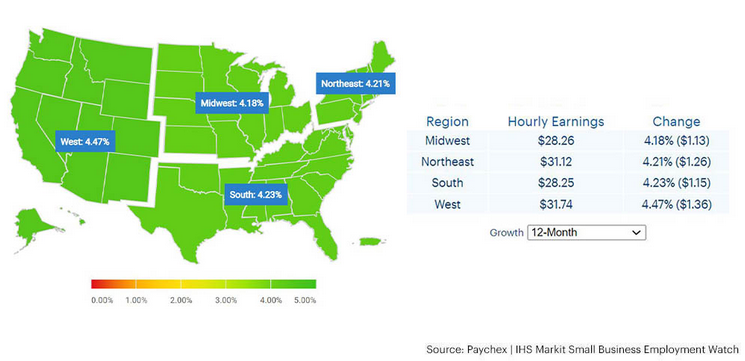
As evidence, Paychex and IHS Markit released their Small Business Employment Watch report on Jan. 4. After analyzing 350,000 small businesses with less than 50 employees, they revealed that "the December data shows hourly earnings growth improved to 4.27 percent, the highest level since reporting began ten years ago."
In addition, the Small Business Jobs Index increased to 100.94 in December, its highest level since August 2014. As a result, the U.S. labor market continues to strengthen, and the Fed is unlikely to reverse its hawkish policy plans anytime soon.
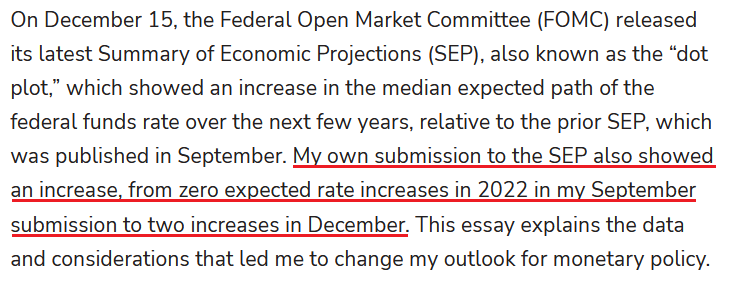
 To that point, Minneapolis Fed President Neel Kashkari – who is by far the most dovish Fed member of them all – wrote on Jan. 4: “while my baseline forecast remains that the high inflation consumers and businesses are currently experiencing will likely be transitory, I am putting more weight on the possibility that such transitory high inflation could nonetheless lead to an increase in long-term inflation expectations above our 2 percent target.”
As a result:
 Source: Minneapolis Fed
Thus, while the PMs didn’t notice, the man who preached the most monetary patience in 2021 now expects two rate hikes in 2022. As such, Kashkari’s material about-face highlights the inflationary anxiety within the Fed.
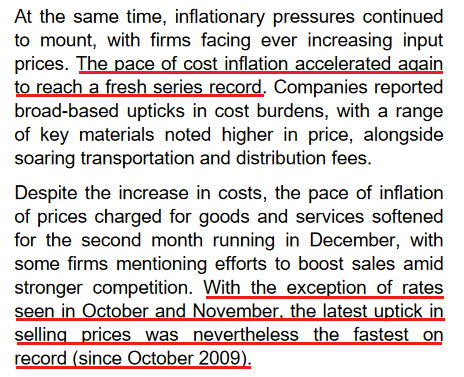
Continuing the theme, IHS Markit released its U.S. composite PMI on Jan. 3. While the headline index declined from 57.2 in November to 56.9 in December, U.S. economic output ended 2021 on a relatively high note. The report revealed:
“Supporting the upturn in activity was a quicker increase in new orders during December. The pace of expansion was the sharpest for five months, and largely driven by a faster rise in service sector new business. New order inflows to the manufacturing sector eased to the slowest since October 2020, however. Meanwhile, new export orders increased at the strongest pace since September.”
More importantly, though, inflationary pressures still remain:
 Source: IHS Markit
Likewise, the Institute for Supply Management (ISM) released its U.S. Manufacturing PMI on Jan. 4. While its Prices Index decreased from 82.4 in November to 68.2 in December, the report revealed that “raw materials prices increased for the 19th consecutive month, at a slower rate in December. This is the 16th month in a row that the index has been above 60.”
In addition, the ISM’s Employment Index “reported a fourth consecutive month of expansion” and that “an overwhelming majority of panelists indicate their companies are hiring or attempting to hire, as 85 percent of Employment Index comments were hiring focused.”
As a result, while it may seem like the PMs have a bullish bid under them, their fundamental prospects are fading. With the stars aligning for aggressive Fed policy in 2022, ignoring these realities will likely upend overzealous investors over the medium term.
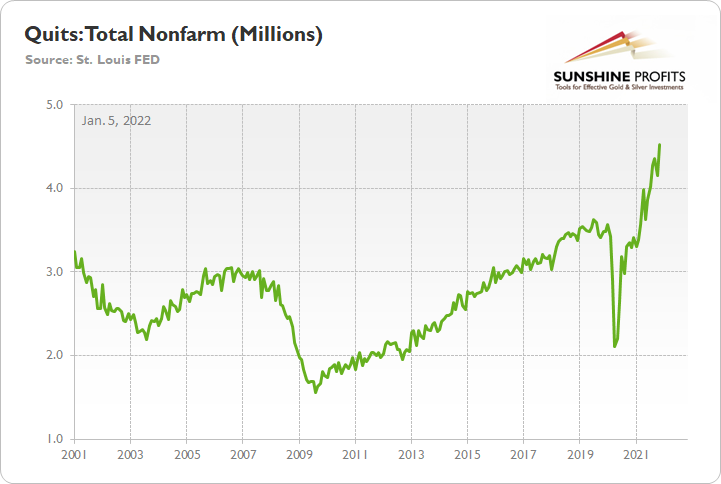
For example, with inflation still rising – at a slower pace, though – it’s drifting further away from the Fed’s 2% annual target. Second, with the U.S. labor market, the main deterrent to an earlier tightening cycle, near-record job openings and strong hiring sentiment eliminate that concern.
As evidence, the U.S. Bureau of Labor Statistics (BLS) released its Job Openings and Labor Turnover Survey (JOLTS) on Jan. 4. With more than 4.5 million Americans quitting their jobs in November – an all-time high – does it seem like they’re worried about their employment prospects?
Finally, while the U.S. 10-Year Treasury yield hovers roughly 10 basis points from its 2021 high (~1.75%), pandemic progress should elicit a move back toward 2%. Likewise, with higher long-term yields as the key to calming inflation, we’ll likely witness more upward pressure in the coming months.
“You only reduce inflationary pressure by slowing aggregate demand and that requires higher long-term rates,” David Kelly, chief global strategist at JPMorgan Asset Management, told Bloomberg on Jan. 4. “There will be no impact on curbing inflation if long-term rates are not pushed up. The Fed is quite capable of pushing up long-term rates if it decides to reduce the size of its balance sheet along with higher overnight rates.”
The bottom line? Investors have gotten so used to a dovish Fed that they assume Chairman Jerome Powell won’t follow through and raise interest rates. However, with rampant inflation, a hot labor market, and a resilient U.S. economy still in play, the PMs may find out the hard way that the Fed isn’t bluffing. As a result, their superficial strength will likely fade, and their price action on Jan. 4 mirrors the tepid confidence they displayed throughout 2021.
In conclusion, the PMs rallied on Jan. 4, though, nothing fundamental supported the moves. While 2021 was filled with defiant rallies that ultimately ended in disappointment, 2022 is shaping up like more of the same. Moreover, with the USD Index and the U.S. 10-Year Treasury yield rising in unison on Jan. 4, the two-headed monster is extremely bearish for the PMs. As a result, more downside will likely materialize over the medium term.
Thank you for reading our free analysis today. Please note that the above is just a small fraction of the full analyses that our subscribers enjoy on a regular basis. They include multiple premium details such as the interim targets for gold and mining stocks that could be reached in the next few weeks. We invite you to subscribe now and read today’s issue right away.
Sincerely,
Przemyslaw Radomski, CFA
Founder, Editor-in-chief -
Precious Metals Still Hungover After New Year’s Eve
January 4, 2022, 9:32 AMGold, silver, and mining stocks started 2022 with a bang. However, this wasn’t the kind of fireworks investors were hoping for.
While gold, silver, and mining stocks partied hard into year-end, the trio woke up to massive hangovers on Jan. 3. Although I’ve been warning for some time that mining stocks would stumble in 2021, the New Year is still filled with old problems.
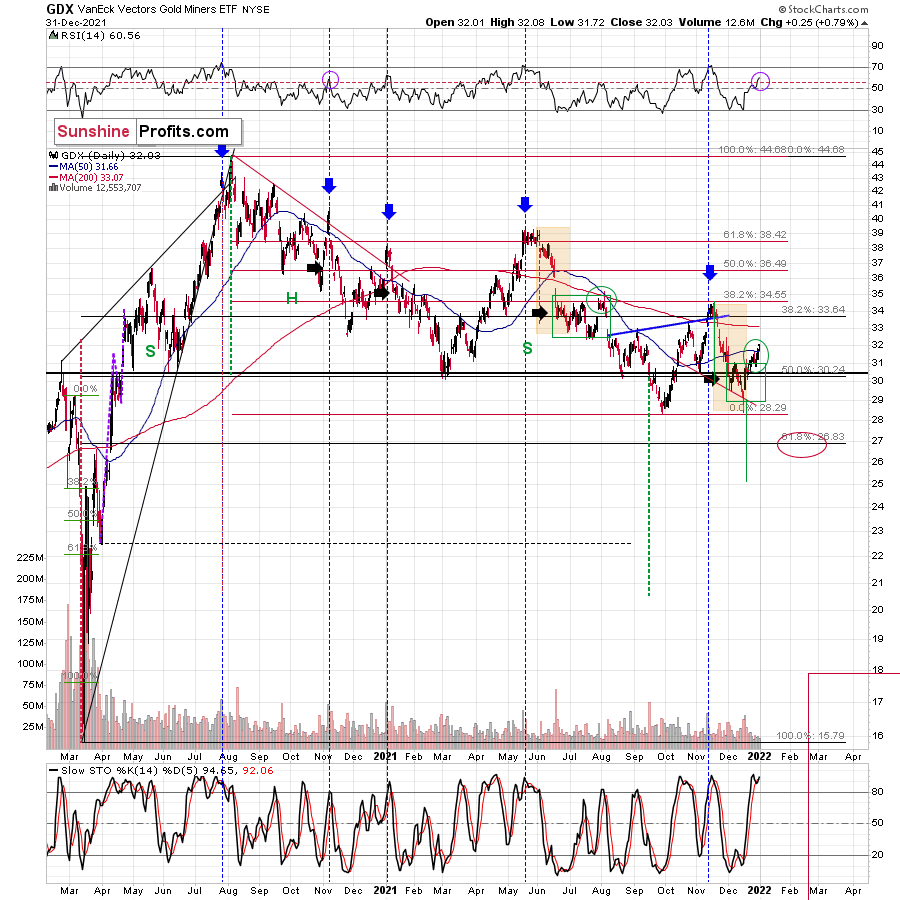
For example, the GDX ETF has been making lower lows and lower highs for months, and when its RSI (Relative Strength Index) approaches 70, the senior miners often run out of gas. For context, I highlighted the events with the blue vertical dashed lines below.
Moreover, with the senior miners’ current price action following the ominous paths of 2000, 2008, and 2013, and their stochastic indicator still signaling overbought conditions, Monday’s weakness may be a sign of things to come.
Please see below:
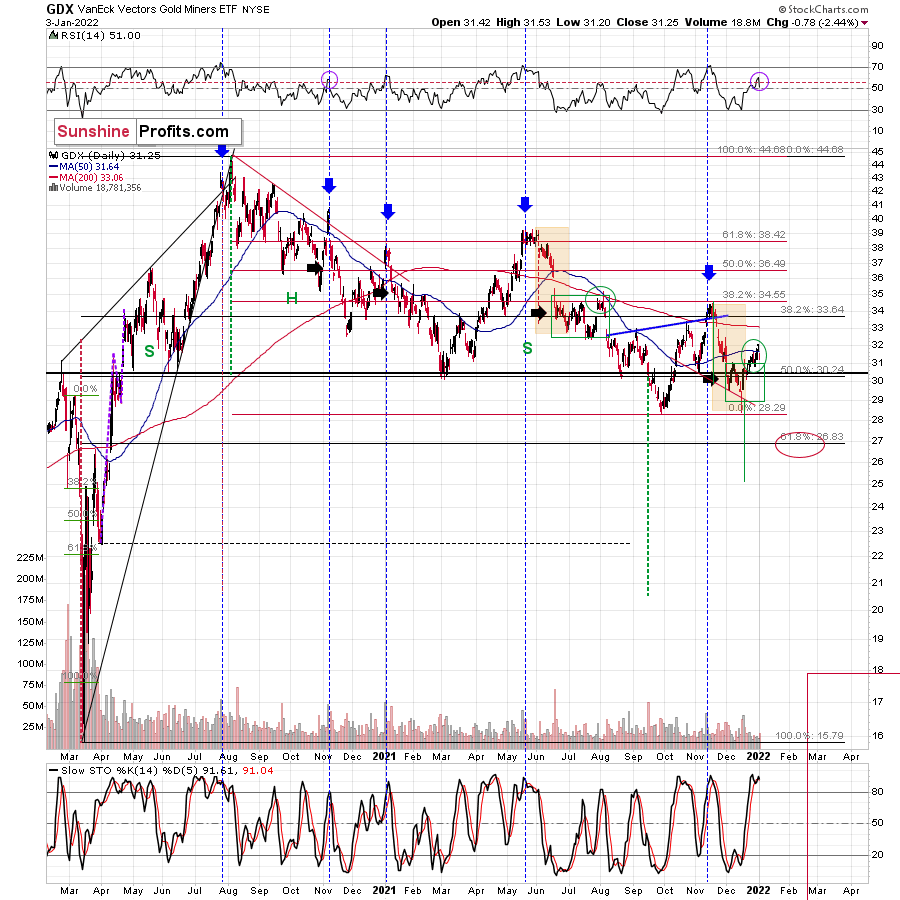
Please also consider the implications of year-end tax-loss harvesting. With the general stock market rallying to start the New Year, losing positions that were sold to offset capital gains near the end of 2021 were likely repurchased on Jan. 3. However, gold, silver, and mining stocks didn’t benefit from the phenomenon. As a result, while the GDX ETF may have outperformed gold, the relative strength was immaterial within the overall picture.
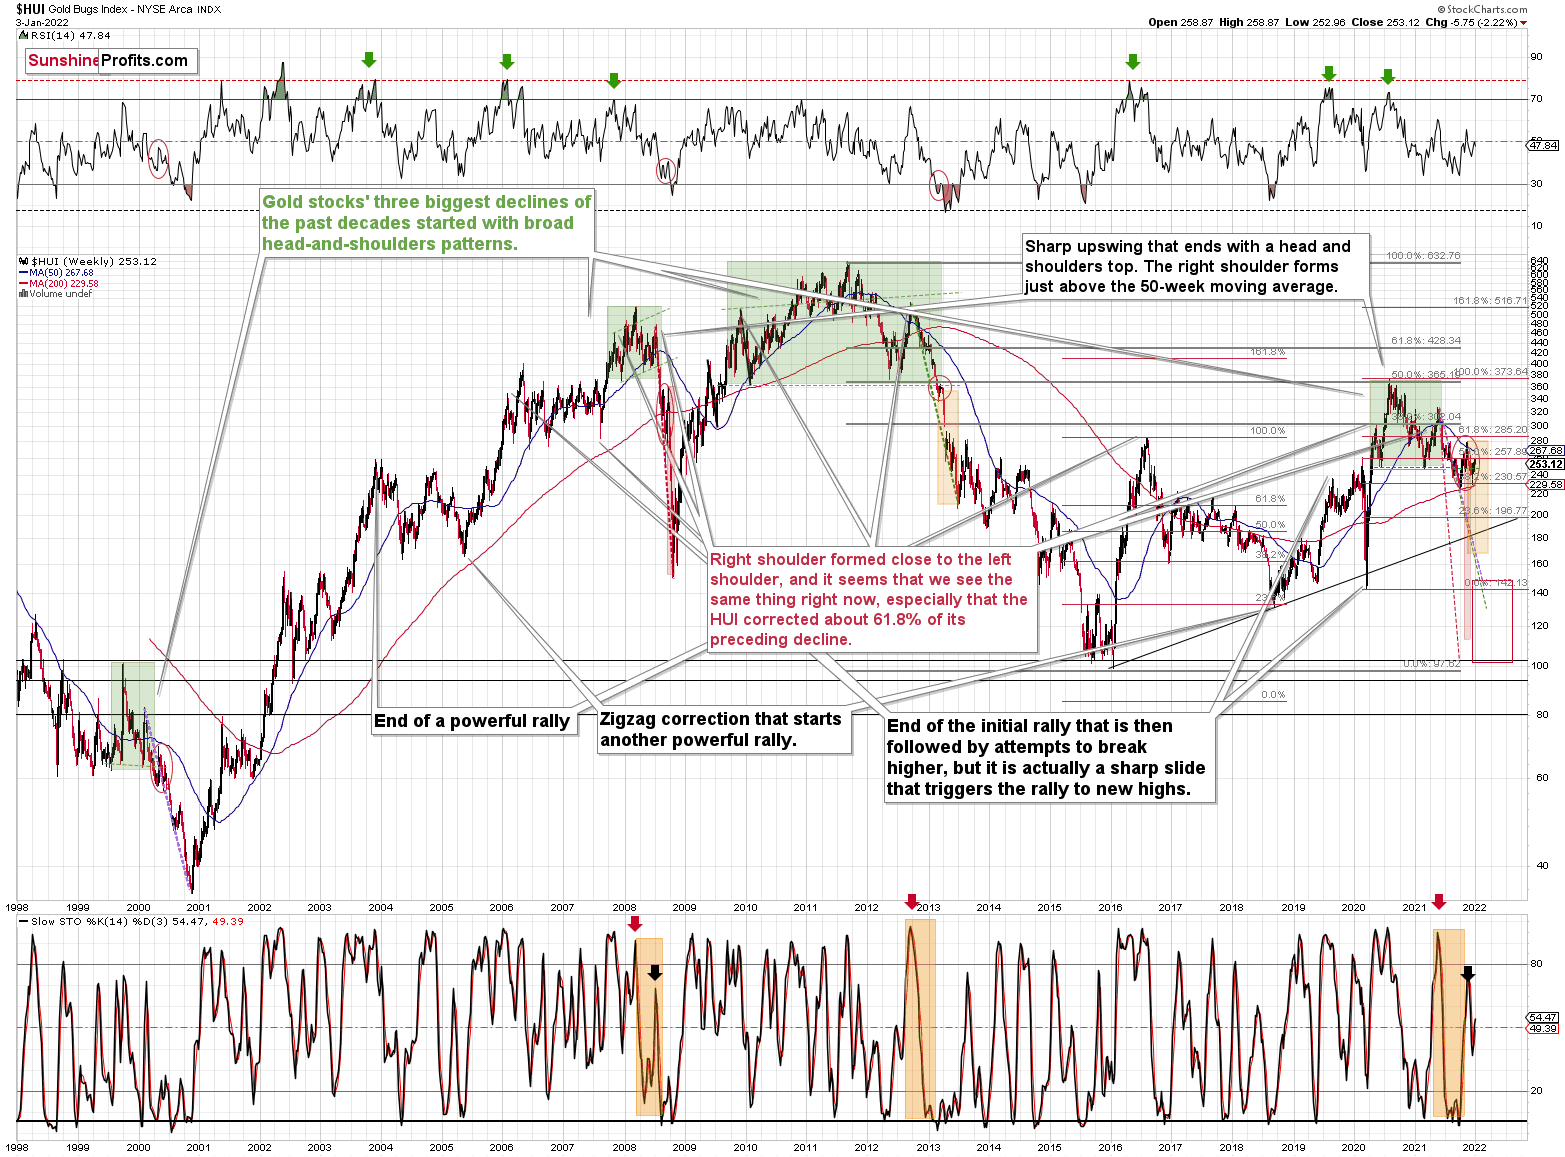
Turning to the HUI Index’s long-term chart, the same bearish forecast is present. For example, I marked the specific tops with red and black arrows. In the current situation, we saw yet another small move up, but that’s most likely because price moves are now less volatile. The areas marked with red ellipses remain similar and show back-and-forth movement before the big decline.
As a result, we’ve entered a consolidation phase, and the implications are not bullish, but bearish.
Making three of a kind, the GDXJ ETF’s corrective upswing has likely run its course. Interestingly, the junior miners’ current rally mirrors the small correction that materialized in mid-2021. Back then, the GDXJ ETF rallied on low volume and didn’t recapture its 50-day moving average. With the same tepid strength present today, the drawdown that followed in mid-2021 will likely commence once again.
On top of that, the behavior of the GDXJ ETF’s RSI is also similar – with the indicator moving from roughly 30 to 50. For context, I highlighted the similarities with green and purple ellipses below. Also noteworthy, similar developments occurred in February/March 2020, before the profound plunge unfolded. As a result, the GDXJ ETF looks set for another sharp drawdown over the medium term and predicting higher prices might be misleading.
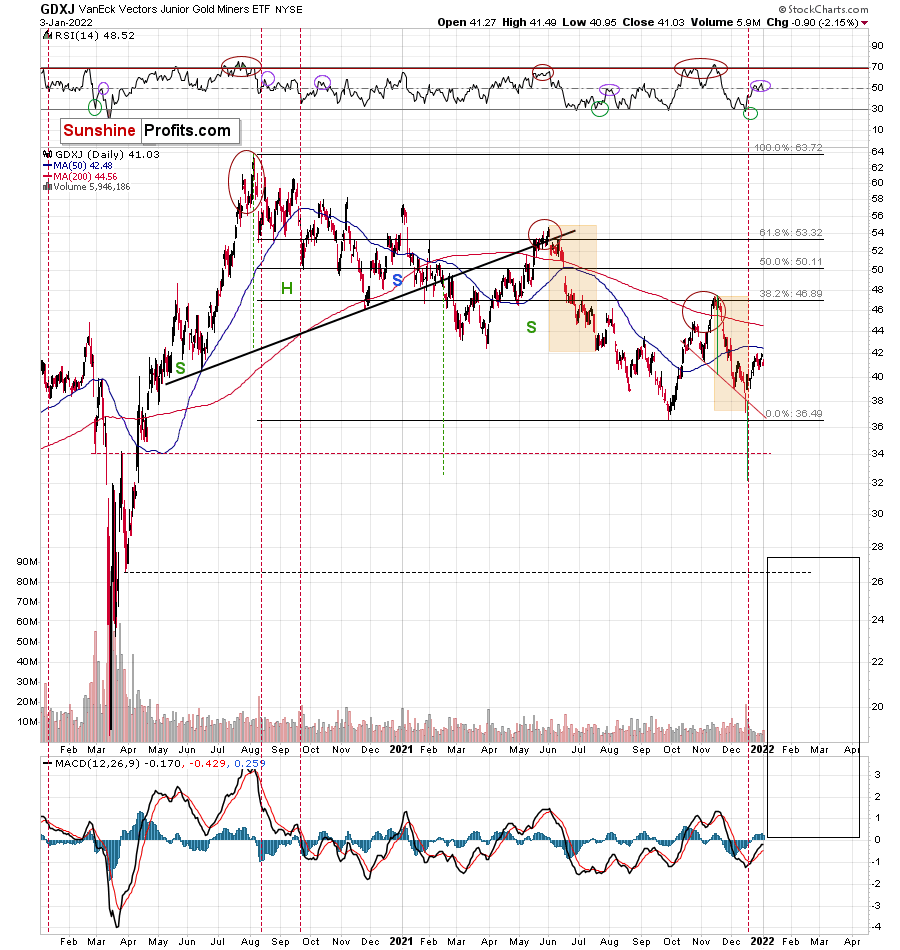
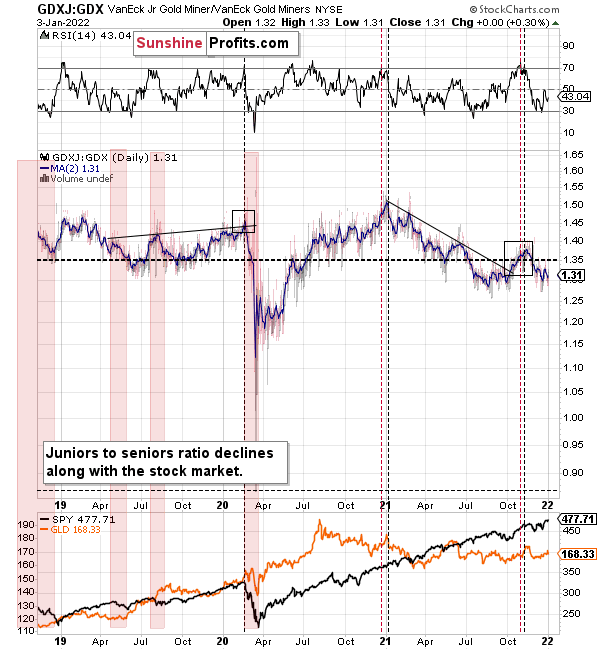
Finally, while my short position in the GDXJ ETF proved quite prescient in 2021, the junior miners continue to underperform the senior miners. With the GDX/GDXJ ratio likely to confront new lows in the coming months, the GDXJ ETF should remain a material laggard in 2022.
In conclusion, gold, silver, and mining stocks started off 2022 with a bang. However, it wasn’t the kind of fireworks that investors were hoping for. With each new celebration shorter in magnitude, it’s likely only a matter of time before their parties are canceled. As a result, the precious metals still confront the same bearish technical outlooks that plagued them in 2021. While mean reversion remains undefeated over the long term, the wait may prove longer than many expect.
Thank you for reading our free analysis today. Please note that the above is just a small fraction of the full analyses that our subscribers enjoy on a regular basis. They include multiple premium details such as the interim targets for gold and mining stocks that could be reached in the next few weeks. We invite you to subscribe now and read today’s issue right away.
Sincerely,
Przemyslaw Radomski, CFA
Founder, Editor-in-chief -
New Year, Old Gold? The Devil Is in the Patterns
January 3, 2022, 9:39 AMChanges are expected with the advent of a new year, but the precious metals seem to have missed the moment of transition. When will they wake up?
The year 2021 is over, 2022 has finally arrived. However, why does the current price action look “sooo last year”? Because the patterns appear to be repeating and the clearest similarity is present in the key precious metal – gold itself.
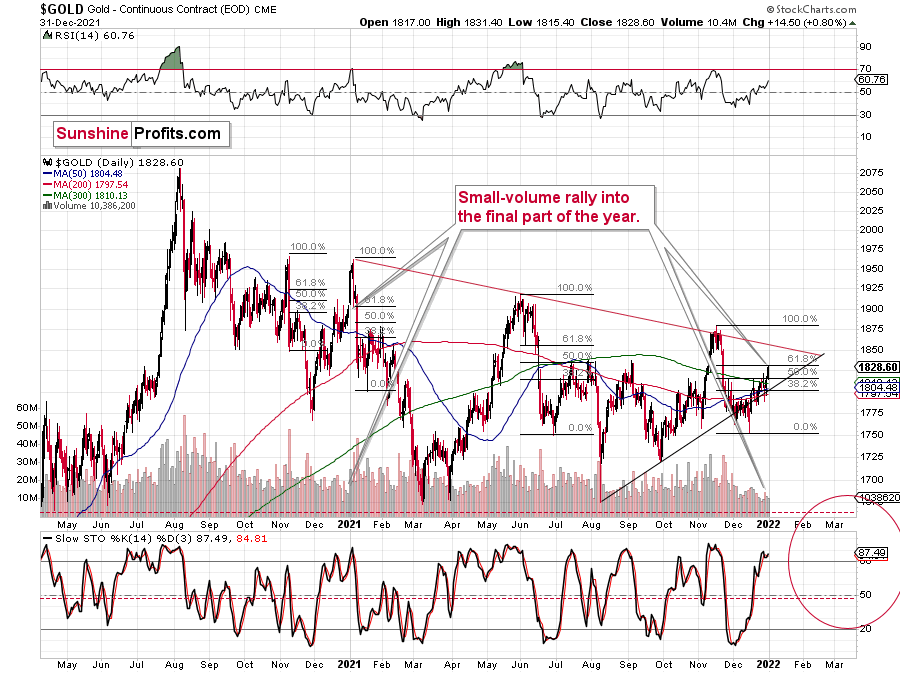
Gold prices moved higher in late December, and it happened on low volume. The rally caused the stochastic indicator to move above 80 and the RSI above 50. That’s exactly what happened in both: late 2021 and late 2020.
What does it mean? Well, it means that we shouldn’t trust this rally, as it could end abruptly, just like the one that we saw a year ago.
Besides, gold corrected 61.8% of the preceding decline (so it moved to its most classic Fibonacci retracement), which means that – technically – what we saw in the past two weeks was just a correction, not the beginning of a new rally.
Moving back to the similarity to what happened last year, let’s take a look at the mining stocks’ performance.
The price moves were more volatile last year, which is why it’s useful to look at the analogies from the indicators’ point of view. After all, indicators exist to make situations more comparable to each other and, thus, to be able to play the history-rhymes card more often.
The stochastic indicator is above 80, and the RSI is above 70. I marked the moves in the RSI with purple ellipses – they look alike.
Since declines followed soon in January 2021, it seems that we’re going to see something similar also this year.
Of course, the analogy to last January is not the most important one. What happened in 2013, 2008, and 2000 is much more important. In particular, the link between now and 2008 is interesting because of what’s happening in the stochastic indicator in the long-term HUI Index chart.

The moves in the indicator are similar, and I marked the specific tops with red and black arrows. In the current situation, we saw yet another small move up, but that’s most likely because the price moves are now less volatile. The areas marked with red ellipses remain similar and show back-and-forth movement before the big decline.
We are now in this back-and-forth trading movement period.
The implications are not bullish, but bearish.
Speaking of back-and-forth movement, let’s take a look at what’s been taking place in the USD Index recently.
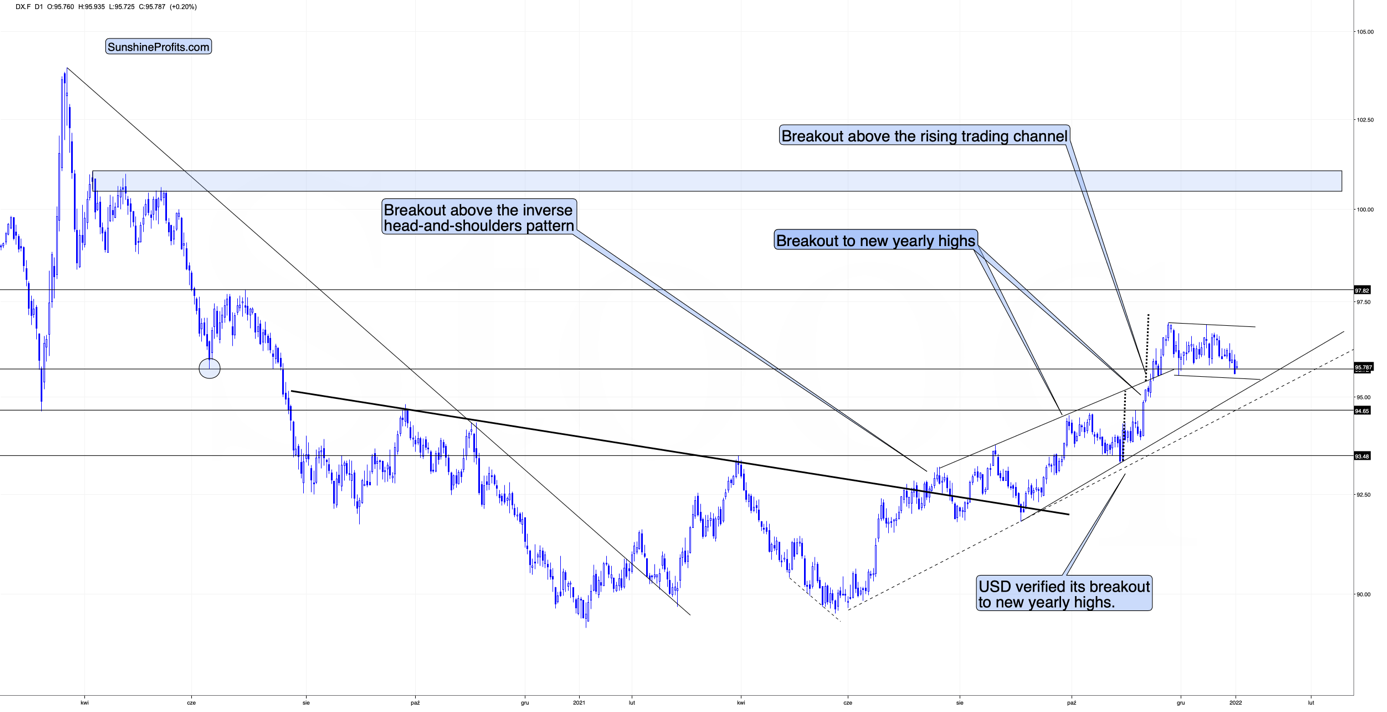
The USDX has been consolidating after rallying sharply in November 2021. This is quite normal, and we saw something similar after previous short-term rallies during the current medium-term rally.
By the way, do you remember when I told you how the USD Index was likely to rally in 2021, when everyone and their brother was bearish on it last year?
The July-September 2021 consolidation, as well as the smaller October consolidation, were also normal parts of the bigger upswing. However, why would I say that this is a consolidation and not a double top?
Because the consolidation takes place after the USD Index breaks clearly above the previous important lows. The March 2020 low and the June 2020 low can be examples. Consolidation has been taking place above the latter. In fact, it was even tested in late November, and it held. The recent move lower is simply another test – just like what we saw in June 2020.
Since consolidation has been taking place for some time now, it’s likely that the next move higher will be quite visible once again.
This means that the previous target of about 97.5 might have been too conservative. Instead, it seems more likely that the USD Index would rally to its previous resistance area close to its April and May 2020 highs. That’s approximately the 100-101 area.
Of course, such a rally in the USD Index would be bearish for precious metals prices.
Let’s take a look at the silver price outlook.
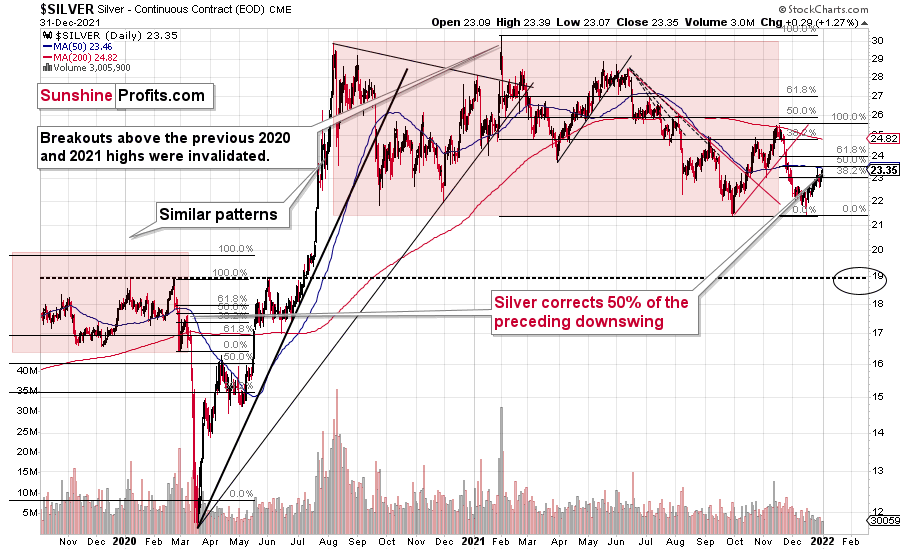
The white metal is not as strong as it was in late 2020 and early 2021, but it seems to be repeating a different pattern.
Namely, after the late-Feb. and early-Mar. 2020 slide (that took silver to its previous lows), silver corrected about half of its previous decline. The same thing happened recently.
Back then, silver topped close to its 50-day moving average, and that’s where the white metal moved recently as well.
Just because this pattern is similar price-wise, it doesn’t mean that it’s identical time-wise, and thus that silver is likely to drop as quickly as it did in 2020. Right now, the price moves are not as volatile, and the declines are unlikely to be AS volatile as they were in 2020 – at least not before the final part of the decline.
It seems that what took days in 2020, now takes weeks. This means that we might see a decline that’s so huge that it takes weeks or even months to complete, not just several days.
Thank you for reading our free analysis today. Please note that the above is just a small fraction of the full analyses that our subscribers enjoy on a regular basis. They include multiple premium details such as the interim targets for gold and mining stocks that could be reached in the next few weeks. We invite you to subscribe now and read today’s issue right away.
Sincerely,
Przemyslaw Radomski, CFA
Founder, Editor-in-chief -
Will Santa Give Us Interest Rate Hikes for 2022?
December 23, 2021, 10:52 AMIf the Fed normalizes its balance sheet and markets freak-out, it will be a bridge too far. Interest rate hikes won’t crash a strong US economy.
With Fed officials increasingly hawked up, the narrative shifted from a tapering of asset purchases to potential interest rate hikes. And now, with whispers of the Fed plotting to normalize its balance sheet, questions have arisen over the potential impact on the PMs.
To explain, I wrote on Dec. 20:
After admitting that inflation “is alarmingly high, persistent, and has broadened to affect more categories of goods and services,” Waller implored the Fed to sell some of its bond holdings.
For context, tapering means that bonds are purchased at a slower pace or not at all. However, even zero purchases result in the Fed’s nearly $8.76 trillion in bond holdings remaining constant. Conversely, if the Fed reduces its balance sheet by selling bonds to private investors, it’s akin to a taper on steroids. Waller said:
“If we start doing some balance sheet runoff by summer, that’ll take some pressure off, you don’t have to raise rates quite as much. My view is we should start doing that by summer.”
 Source: Bloomberg
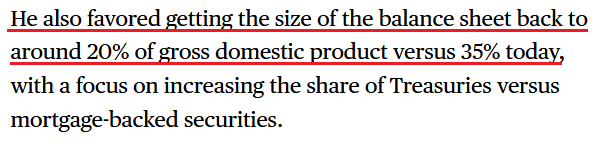
However, is this a plausible path for the Fed over the medium term? In a word: no. While the prospect is profoundly bullish for the USD Index and profoundly bearish for the PMs, Chairman Jerome Powell will likely avoid quantitative tightening.
For one, if the Fed tries to reduce its balance sheet from 35% to 20% of GDP, the financial markets will freak out. Currently, the Fed has such a large stockpile of bonds that private investors can’t absorb that kind of supply. Thus, another taper tantrum will likely unfold if the Fed tries to ‘normalize’ its balance sheet through the open market.
Second, the Fed’s only hawkish goal is to calm inflation. To explain, when inflation was running hot and most Americans bought into the “transitory” narrative, Fed officials exuded confidence. However, when consumer confidence sunk to a 10-year low and inflation became political, the Fed changed its tune. As a result, Powell wants to reduce inflation while tightening as little as possible (3% to 4% inflation may be considered acceptable in 2022). Thus, normalizing the balance sheet is likely a bridge too far.
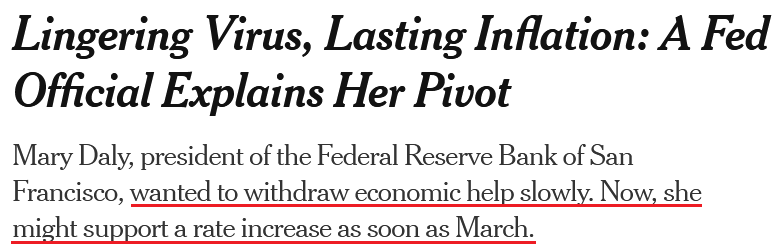
However, please remember that if quantitative tightening is a ten on the hawkish scale, hitting a seven or an eight is still profoundly bearish for the PMs. To explain, I highlighted on Dec. 20 how San Francisco Fed President Mary Daly had a come-to-Jesus moment. I wrote:
Daly – a major dove that urged patience in November – admitted on Dec. 17 that “I have adjusted my stance.”
And conducting another interview with The New York Times on Dec. 21, Daly said:
“My community members are telling me they’re worried about inflation. What influenced me quite a lot was recognizing that the very communities we’re trying to serve when we talk about people sidelined” from the labor market “are the very communities that are paying the largest toll of rising food prices, transportation prices and housing prices….
“I’m comfortable with saying that I expect us to need to raise rates next year. But exactly how many will it be – two or three – and when will that be – March, June, or in the fall? For me it’s just too early to know, and I don’t see the advantage of a declaration.”
However, with her slip of “two or three” rate hikes offering a window into her thought process, it’s clear that more hawkish policy will materialize over the medium term.
Please see below:
 Source: The New York Times
To that point, many short and medium-term gold bulls support the narrative that “the Fed is trapped.” For context, we’re bullish on the PMs over the long term. However, we expect sharp medium-term corrections before their uptrends resume.
Moreover, the narrative implies that the Fed can’t tighten monetary policy without crashing the U.S. economy. Thus, Fed officials are “trapped,” and the PMs should soar as inflation runs wild. However, this hyper-inflationist theory is much more semblance than substance.
To explain, adopters assumed that the Fed couldn’t taper its asset purchases without crashing the U.S. economy. However, the Fed tapered, then accelerated the taper, and the U.S. economy remained resilient. Now, the new narrative is that the Fed can’t raise interest rates without crashing the U.S. economy. However, it’s simply misleading.
As evidence, anxiety has increased with U.S. monetary and fiscal spending stuck in reverse/neutral. For example, the Fed is tightening monetary policy and Americans are no longer receiving stimulus checks and enhanced unemployment benefits. Moreover, U.S. President Joe Biden’s $1.75 trillion stimulus package was torpedoed by Senator Joe Manchin. As a result, who knows if it will pass in 2022?
However, while “the Fed is trapped” crew cites these issues as reasons for an economic calamity, they often miss the forest through the trees. For example, while the fiscal spending spree may end, U.S. households are still flush with cash.
Please see below:
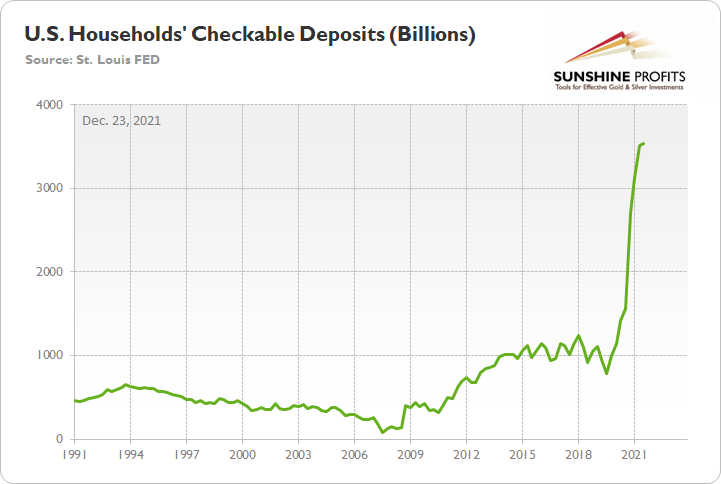
To explain, the green line above tracks U.S. households’ checkable deposits (data released on Dec. 9). In a nutshell: it’s the amount of money that U.S. households have in their checking accounts and/or demand deposit accounts.
If you analyze the vertical ascent on the right side of the chart, you can see that U.S. households have nearly $3.54 trillion in their checking accounts. For context, this is 253% more than Q4 2019 (pre-COVID-19).
Likewise, even though U.S. stimulus has disproportionately flowed to the top, the bottom 50% of American households (based on wealth percentiles) still have plenty of money to spend.
Please see below:
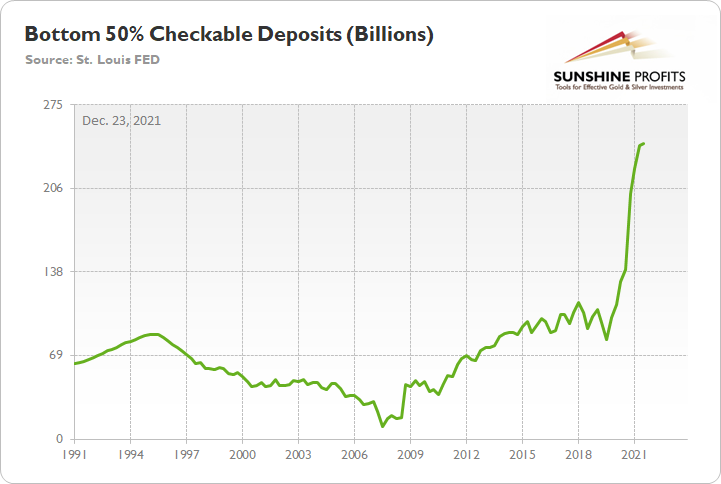
To explain, the green line above tracks the checkable deposits held by the bottom 50% of U.S. households (again, data released on Dec. 9). And with these individuals sitting on nearly $243 billion in cash, it's 142% more than Q4 2019.
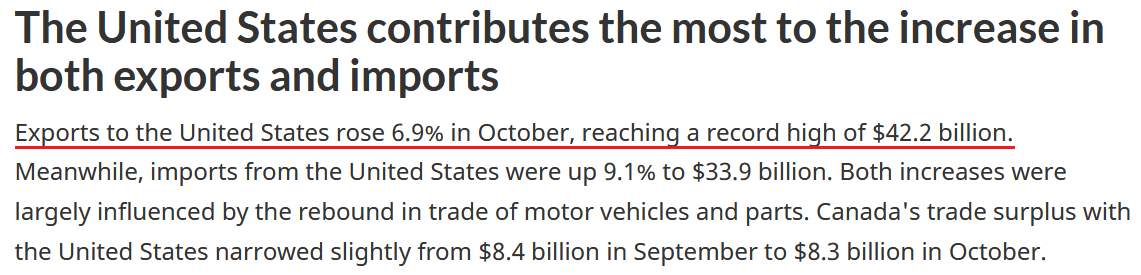
Finally, it's important to remember that more than 75% of Canada's exports are sent to the United States. And with the former's exports to the latter hitting an all-time high in October (data released on Dec. 7), it's another indicator that U.S. consumer demand remains resilient.
 Source: Statistics Canada
The bottom line? While some investors expect a dovish 180 from the Fed, they shouldn’t hold their breath. With U.S. economic growth still resilient and the U.S. consumer in much better shape than some portray, the Fed can raise interest rates without crashing the U.S. economy. As a result, Powell will likely stick to his hawkish script and forge ahead with rate hikes in 2022.
Conversely, the only wild card is the Omicron variant. If the latest strain severely disrupts economic activity, the Fed could slow its roll. However, this is extremely unlikely. For one, the strain’s spread has been violent, but so far, the data shows it’s much milder than Delta. Second, the Fed needs to solve its inflation problem. And with the FOMC’s dot plot and officials’ rhetoric nodding in agreement, they likely realize that a continuation of 6%+ inflation will do more harm to the U.S. economy than raising interest rates.
Also, please note that when the Fed called inflation “transitory,” I wrote for months that officials were misreading the data. As a result, I don’t have a horse in this race. However, now they likely have it right. Thus, if investors assume that the Fed won’t tighten, their bets will likely go bust in 2022.
In conclusion, the PMs rallied on Dec. 22, as an FDA approval of Pfizer’s coronavirus treatment pill helped uplift sentiment. However, the next several months will likely test their mettle. With the Fed hawked up and little stopping interest rate hikes in 2022, the pace of the current liquidity drain should surpass the precedent set in 2013/2014. As a result, more downside likely confronts the PMs over the medium term.
Thank you for reading our free analysis today. Please note that the above is just a small fraction of the full analyses that our subscribers enjoy on a regular basis. They include multiple premium details such as the interim targets for gold and mining stocks that could be reached in the next few weeks. We invite you to subscribe now and read today’s issue right away.
Sincerely,
Przemyslaw Radomski, CFA
Founder, Editor-in-chief -
Even the Stock Shopping Frenzy Didn’t Dethrone Resilient Dollar
December 22, 2021, 9:31 AMAfter another (likely) short squeeze helped propel the S&P 500 higher on Dec. 21, silver and mining stocks benefited from the bulls’ enthusiasm. However, immense relative strength of the USD Index was hidden beneath the surface.
To explain, the frenzy on Dec. 21 was broad-based: the ARK Innovated ETF jumped by 3.84%, Tesla jumped by 4.29%, Uber rallied by 5.72%, and crude rallied by 3.66%. As a result, investors bought anything that had a ticker symbol – whether it was the bubble basket (ARK and Tesla) or the cyclicals that have been hurt by the Omicron variant (Uber and crude).
Despite that, though, the USD Index barely flinched. In the past, risk-on sentiment occurred at the U.S. dollar’s expense. Moreover, the euro, commodity, and EM currencies often caught a bid. However, with the greenback’s recent rally built on a solid fundamental foundation, the S&P 500’s surge couldn’t knock the dollar off of its lofty perch.
Please see below:
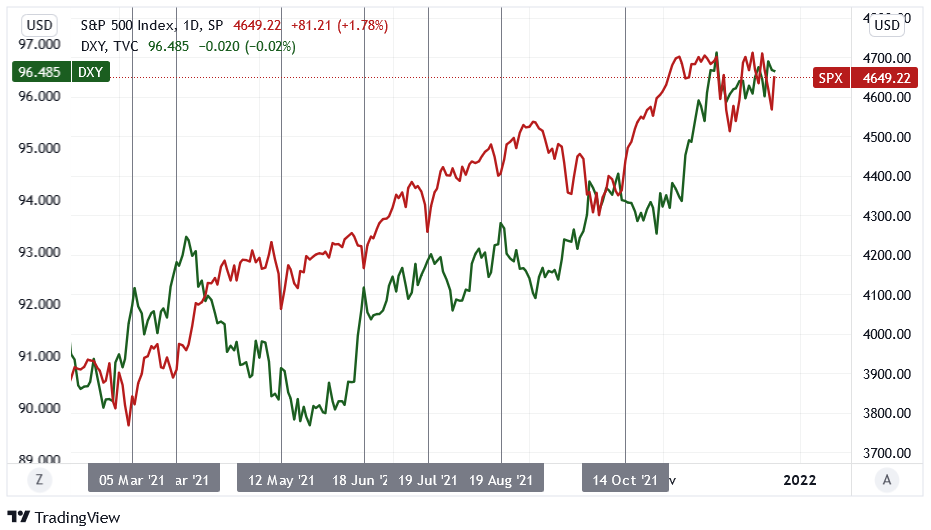
To explain, the green line above tracks the USD Index, while the red line tracks the S&P 500. If you analyze the intersections of the gray vertical lines, you can see that the S&P 500's daily surges (red line rises) often coincide with the USD Index's daily declines (green line falls).
Furthermore, while these short-term swings reversed once sentiment settled, it's essential to understand the importance of the then-and-now price action. To that point, if you analyze the right side of the chart, you can see that the USD Index completely ignored the S&P 500's rally on Dec. 21. As a result, the USD Index's relative strength signals that a renewed sense of confidence underpins the greenback.
In addition, while gold was the only precious metal to notice on Dec. 21, U.S. Treasury yields awoke from their slumber. For context, the Omicron variant's negativity has helped depress U.S. interest rates. However, with the U.S. 10-Year Treasury yield rallying without the S&P 500 on Dec. 20 and with the S&P 500 on Dec. 21, a resumption of its uptrend is fundamentally bearish for the PMs.
Please see below:
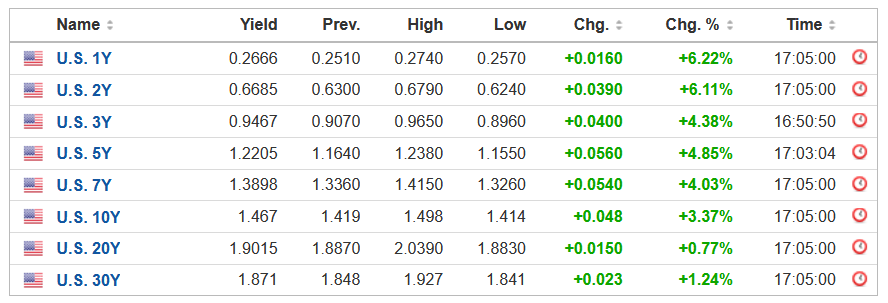 Source: Investing.com
 To that point, Bloomberg reported on Dec. 21 that the U.S. Food and Drug Administration (FDA) is preparing to green-light Pfizer and Merck's COVID-19 pills. The article claimed that "an announcement may come as early as Wednesday, according to three of the people [that] asked not to be identified ahead of the authorization and cautioned that the plan could change."
For context, Pfizer's pill showed an 89% reduction in hospitalization for patients who received the medicine within three days of developing symptoms. Thus, if the drugs are formally approved, they could provide additional medical ammunition to help fight the pandemic.
More importantly, though, with milder symptoms present in each new variant and more treatment options available for those who want them, each outbreak's economic impact should decelerate. As a result, consumer mobility and economic growth should improve in the coming months, placing upward pressure on U.S. interest rates.
To that point, The Conference Board released its Leading Economic Index (LEI) on Dec. 21. After recording month-over-month (MoM) increases of 0.3% in September, 0.9% in October, and now, 1.1% in November, the U.S. economy remains on solid footing. The report revealed:
“The U.S. LEI rose sharply again in November, suggesting the current economic expansion will continue into the first half of 2022. Inflation and continuing supply chain disruptions, as well as a resurgence of COVID-19, pose risks to GDP growth in 2022. Still, the economic impact of these risks may be contained. The Conference Board forecasts real GDP growth to strengthen in Q4 2021 to about 6.5 percent (annualized rate), before moderating to a still healthy rate of 2.2 percent in Q1 2022.”
In addition, The Confidence Board revealed separately that they “forecast that the US economy will grow by 3.5 percent (year-over-year) in 2022 and 2.9 percent (year-over-year) in 2023.”
Please see below:
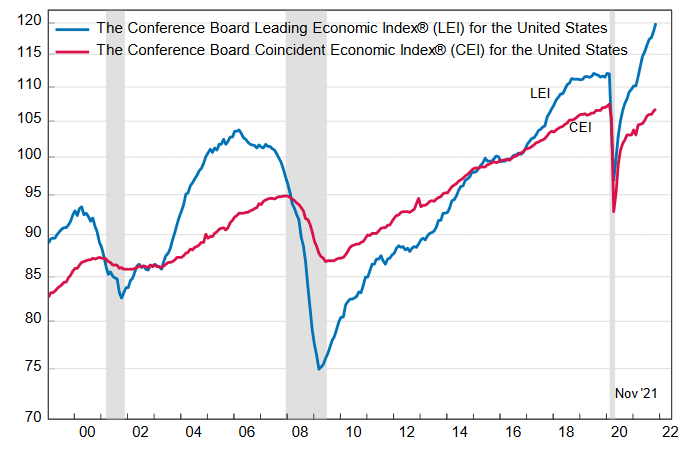 Source: The Confidence Board
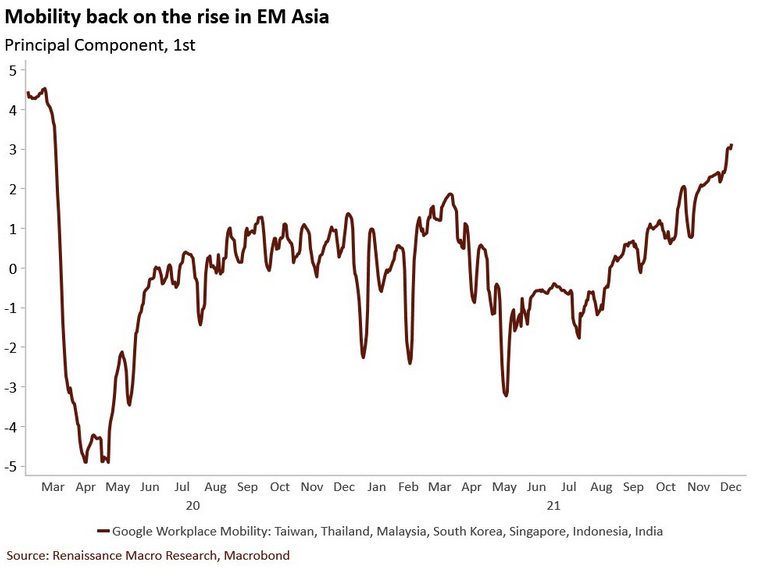
Also supporting the thesis, Asian countries have been hard-hit by coronavirus outbreaks, and for better or worse, regions often impose restrictions to reduce case counts. Moreover, when the Delta wave hit them before it reached the U.S., workplace mobility sank like a stone. However, with workplace mobility now on the rise, the development could uplift economic growth and alleviate some of the U.S. supply chain issues.
In a nutshell: the lower the economic impact of each coronavirus outbreak, the more pressure it puts on the Fed to tighten monetary policy. Thus, if Asia’s momentum is replicated in the U.S., the Fed’s foot should remain on the hawkish accelerator.
Please see below:
Speaking of a hawkish Fed, I’ve been warning for months that rent inflation would put upward pressure on the headline Consumer Price Index (CPI). With the Shelter CPI rising by 3.9% year-over-year (YoY) on Dec. 10 (a new 2021 high), the Fed’s inflationary margin for error is shrinking by the day.
To that point, CoreLogic released its Single-Family Rent Index (SFRI) on Dec. 21. After “U.S. single-family rent growth increased 10.9% in October 2021”, it marked “the fastest year-over-year increase in over 16 years.”
The report revealed:
- Lower-priced units: rent inflation was 9.5% in October 2021 versus 2.8% in October 2020.
- Lower-middle priced units: rent inflation was 10.1% in October 2021 versus 2.8% in October 2020.
- Higher-middle priced units: rent inflation was 11.3% in October 2021 versus 3% in October 2020.
- Higher-priced units: rent inflation was 11.4% in October 2021 versus 3.5% in October 2020.
Please see below:
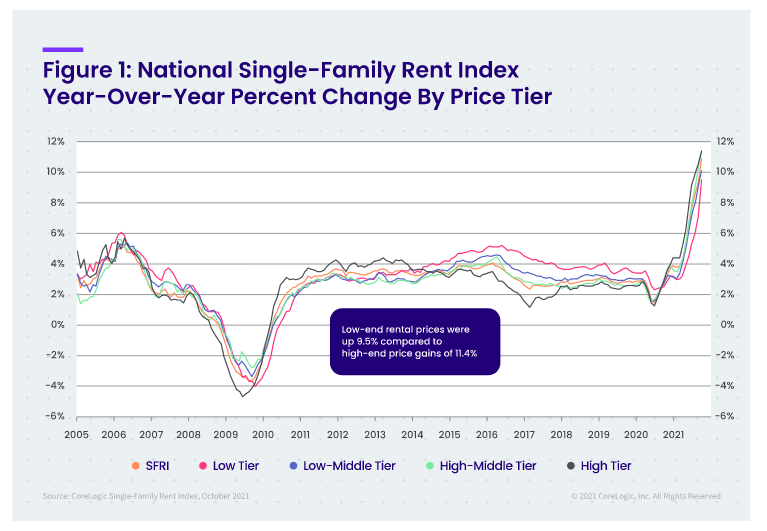
For context, Molly Boesel, principal economist at CoreLogic, said:
“Single-family rent growth hit its sixth consecutive record high in October 2021, mirroring record price increases in the for-sale housing market. Rent growth in October 2020 had already recovered from pre-pandemic lows and rent growth this October was more than three times that of a year earlier.”
The bottom line? The USD Index continues to demonstrate immense resilience. With inflation running hot and U.S. economic growth poised to re-accelerate in the coming months, the Fed’s tightening cycle should continue to uplift the U.S. dollar. Moreover, with U.S. Treasury yields slowly creeping higher, interest rates should mirror the greenback’s ascent over the medium term. With this fundamental cocktail extremely bearish for the PMs, a realization should help push the GDXJ ETF to new lows.
In conclusion, the PMs were mixed on Dec. 21, and gold was the daily underperformer. While the S&P 500 helped uplift the GDXJ ETF (which is often the case), hyper-growth technology stocks are no fans of rising interest rates. As a result, if the Omicron variant fades and the U.S. economy records a solid recovery, the bullish economic outcome is profoundly bearish for the NASDAQ Composite, and to a lesser extent, the S&P 500. With the PMs often upended by similar fundamental developments, a re-acceleration of U.S. economic growth will likely sour their performances as well.
Thank you for reading our free analysis today. Please note that the above is just a small fraction of the full analyses that our subscribers enjoy on a regular basis. They include multiple premium details such as the interim targets for gold and mining stocks that could be reached in the next few weeks. We invite you to subscribe now and read today’s issue right away.
Sincerely,
Przemyslaw Radomski, CFA
Founder, Editor-in-chief


Gold Investment News
Delivered To Your Inbox
Free Of Charge
Bonus: A week of free access to Gold & Silver StockPickers.
Gold Alerts
More-
Status
New 2024 Lows in Miners, New Highs in The USD Index
January 17, 2024, 12:19 PM -
Status
Soaring USD is SO Unsurprising – And SO Full of Implications
January 16, 2024, 8:40 AM -
Status
Rare Opportunity in Rare Earth Minerals?
January 15, 2024, 2:06 PM

