
tools spotlight

-
USDX Caught in a Triangle. Will the Fed Set It Free to Fly?
December 14, 2021, 9:35 AMIn yesterday’s gold analysis, I emphasized that there was very little to say about gold’s movement, and the same is up-to-date also today. Consequently, the full version of today’s analysis focuses on fundamental issues and only a small technical note is added at the beginning.
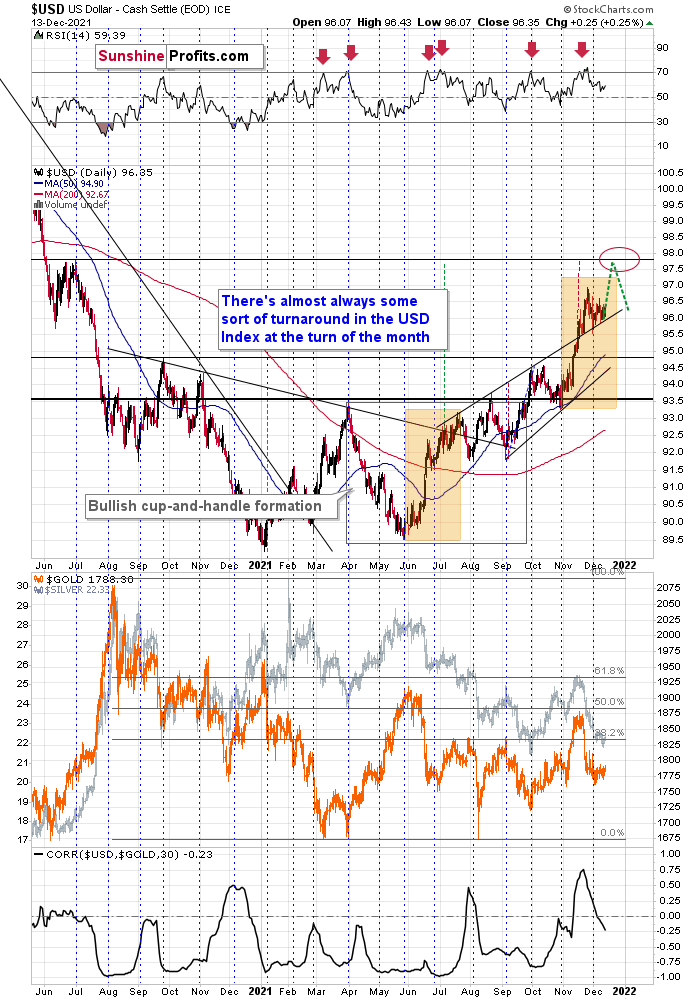
In short, the USD Index has been consolidating in one of the most classic ways possible. Namely, it formed a triangle. Triangles are generally “continuation patterns,” which suggests that the USDX is likely to break to the upside and rally.
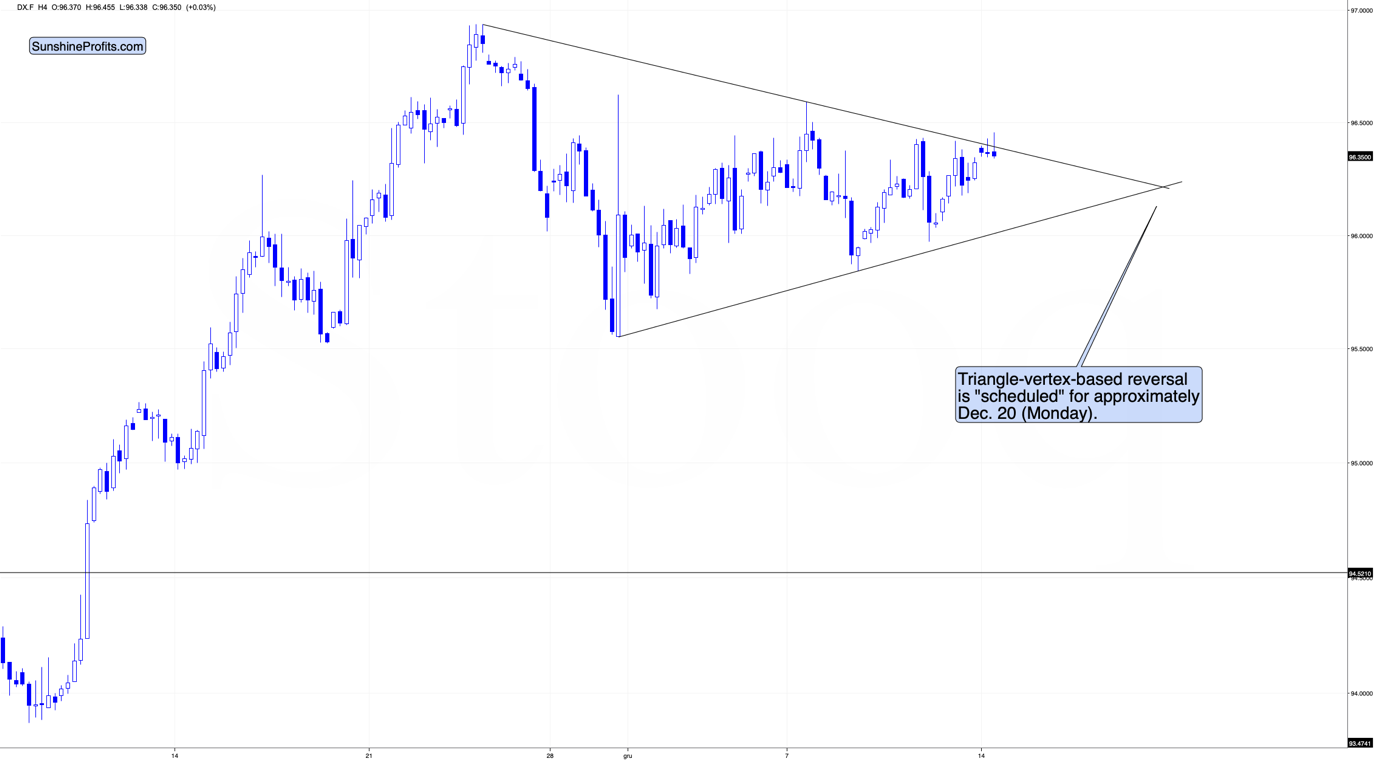
Taking a closer look at the triangle, we see that earlier today, the USD Index tried to move above it, but so far it was not successful. The move higher was really small, so I don’t view it as a major invalidation.
Still, I wouldn’t be surprised to see the USD Index continue its back-and-forth trading within the triangle until we get some news from the Fed. In other words, we’re likely to see some major price action tomorrow.
The above, plus the fact that gold has been consolidating below its rising support line, suggests that the next move in the USDX is going to be to the upside, while gold is going to decline.
Still, let’s keep in mind that it’s also possible that we see a fake move lower (USDX) and higher in gold right before or right after the FOMC. That kind of volatility around important news announcements is relatively normal. Whatever happens initially, please don’t take it at its face value. It might or might not be the market’s true reaction, especially if silver rallies much more than gold.
The trends support higher USDX values in the near and medium-term and lower gold prices in the near and medium-term.
Thank you for reading our free analysis today. Please note that the above is just a small fraction of the full analyses that our subscribers enjoy on a regular basis. They include multiple premium details such as the interim targets for gold and mining stocks that could be reached in the next few weeks. We invite you to subscribe now and read today’s issue right away.
Sincerely,
Przemyslaw Radomski, CFA
Founder, Editor-in-chief -
Will Inflation Look Different in 2022?
December 13, 2021, 9:35 AMOne swallow doesn't make a summer, but when it comes to slower inflation pressure, there have been several. Will the narrative change soon?
While Fed Chairman Jerome Powell had been preaching his “transitory” doctrine for months, the thesis was obliterated once again after the headline Consumer Price Index (CPI) surged by 6.8% year-over-year (YoY) on Dec. 10. Additionally, while the Commodity Producer Price Index (PPI) – which will be released on Dec. 14 – is likely provide a roadmap for inflation’s next move, signs of deceleration are already upon us.
For example, supply bottlenecks, port congestion, and rapidly rising commodity prices helped underwrite inflation’s ascent. However, with those factors now stagnant or reversing, inflationary pressures should decelerate in 2022.
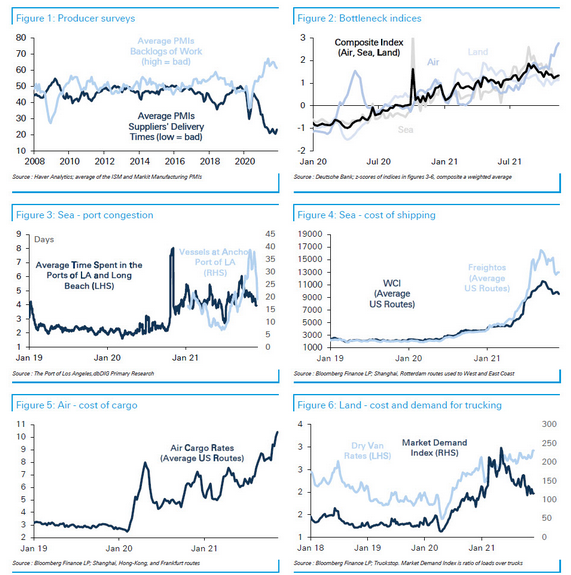
To explain, Deutsche Bank presented several charts that highlight 2021’s inflationary problems. However, whether it’s suppliers’ delivery times, backlogs of work, port congestion, bottleneck indices, or the cost of shipping and trucking, several inflationary indicators (excluding air cargo rates) have already peaked and rolled over.
Please see below:
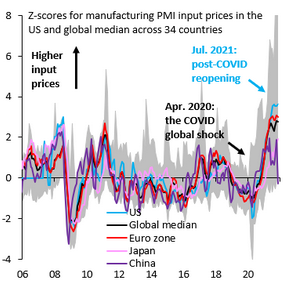
To that point, global manufacturing PMIs also signal a deceleration in input price pressures. With input prices leading output prices (like the headline CPI), the latter will likely showcase a similar slowdown if the former’s downtrend holds.
Please see below:
 Source: IIF/Robin Brooks
To explain, the colored lines above track the z-scores for prices paid within global manufacturing PMI reports. In a nutshell: regions were experiencing input inflation that was ~2 and ~4 standard deviations above their historical averages. However, if you analyze the right side of the chart, you can see that all of them have consolidated or come down (the U.S. is in light blue). As a result, it’s another sign that peak input inflation could elicit peak output inflation.
As mentioned, though, the commodity PPI is the most important indicator and if the data comes in hot on Dec. 14, all bets are off. However, the monthly weakness should be present since the S&P Goldman Sachs Commodity Index (S&P GSCI) declined by 11.2% in November.
Also noteworthy, Morgan Stanley’s Chief U.S. Economist, Ellen Zentner, also sees signs of a deceleration. She wrote:
“We are seeing nascent signs that pipeline inflation pressures are easing – based on evidence from company earnings transcripts, ISM comments, Korea trade data, China's inflation data, the Fed's Beige Book, a department huddle with our equity analysts, and our own survey.”
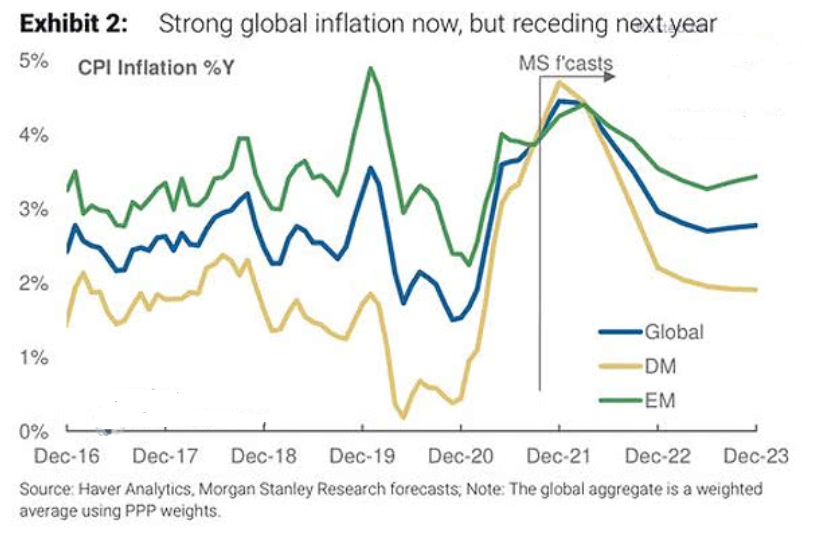
To explain, the green, gold, and blue lines above track Morgan Stanley’s core inflation estimates for emerging markets, developed markets, and global markets. If the predictions prove prescient, the 2022 inflation narrative could look a lot different than in 2021.
However, please remember that inflation doesn’t abate without direct action from the Fed, and with a hawkish Fed known to upend the PMs (at least in the short- or medium run), the fundamental environment has turned against them. For example, when the Fed turns hawkish, commodities retreat, and with U.S. President Joe Biden showcasing heightened anxiety over inflation, more of the same should materialize over the medium term.
To explain, Morgan Stanley initially projected no rate hikes in 2022. Now, Zentner expects “2 hikes in 2022, followed by 3 hikes plus a halt in reinvestments in 2023.”
She wrote:
“Before investors close out the year, we need to get past the FOMC's final meeting next week, and it comes with every opportunity for surprise. On Wednesday, we expect the Fed to move to a hawkish stance by announcing that it is doubling the pace of taper, highlighting continued inflation risks and no longer labeling high inflation as transitory, and showing a hawkish shift in the dot plot. We think this shift will shake out in a 2-hike median in 2022, followed by 3.5 hikes in 2023 and 3 hikes in 2024.”
Furthermore, upping the hawkish ante, Goldman Sachs initially projected no rate hikes in 2022. Then, the team moved to three rate hikes in 2022 (June, September, and December 2022). Now, Goldman Sachs expects the FOMC to hike rates in May, July, and November 2022 – with another four hikes per year in 2023 and 2024.
The Fed’s Time to Shine
“The FOMC is very likely to double the pace of tapering to $30bn per month at its December meeting next week, putting it on track to announce the last two tapers at the January FOMC meeting and to implement the last taper in March,” wrote Chief Economist Jan Hatzius.
“We expect the Summary of Economic Projections to show somewhat higher inflation and lower unemployment. Our best guess is that the dots will show 2 hikes in 2022, 3 in 2023, and 4 in 2024, for a total of 9 (vs. 0.5 / 3 / 3 and a total of 6.5 in September). We think the leadership will prefer to show only 2 hikes in 2022 for now to avoid making a more dramatic change in one step, especially at a meeting when the FOMC is already doubling the taper pace. But if Powell is comfortable showing 3 hikes next year, then we would expect others to join him in a decisive shift in the dots in that direction.”
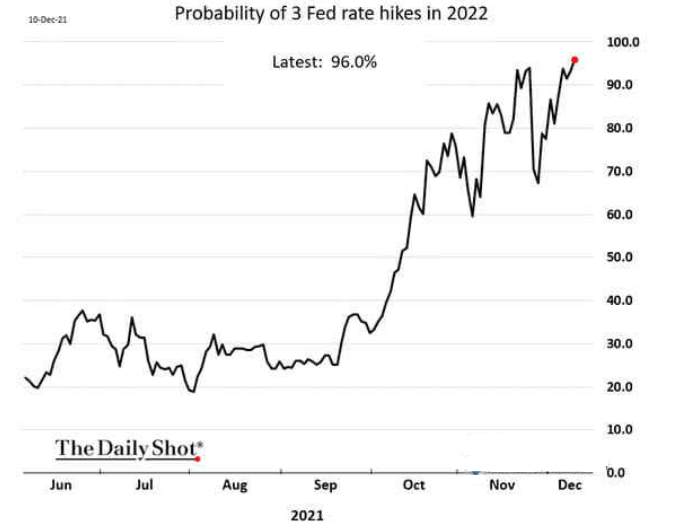
Speaking of three hikes, the market-implied probability of three FOMC rate hikes in 2022 has risen to 96%.
Please see below:
For context, I’ve been warning for months that surging inflation would force the Fed’s hand. I wrote on Oct. 26:
Originally, the Fed forecasted that it wouldn’t have to taper its asset purchases until well into 2022. However, surging inflation pulled that forecast forward. Now, the Fed forecasts that it won’t have to raise interest rates until well into 2023. However, surging inflation will likely pull that forecast forward as well.
More importantly, though, while the PMs have remained upbeat in recent weeks, the forthcoming liquidity drain will likely shift the narrative over the medium term.
The bottom line? While inflation shows signs of peaking, there is a vast difference between peak inflation and the Fed’s 2% annual target. As a result, even if a 6.8% YoY headline CPI was the precipice, it’s nothing to celebrate. Thus, the Fed needs to tighten monetary policy to control inflation, and anything less will likely re-accelerate the cost-push inflationary spiral.
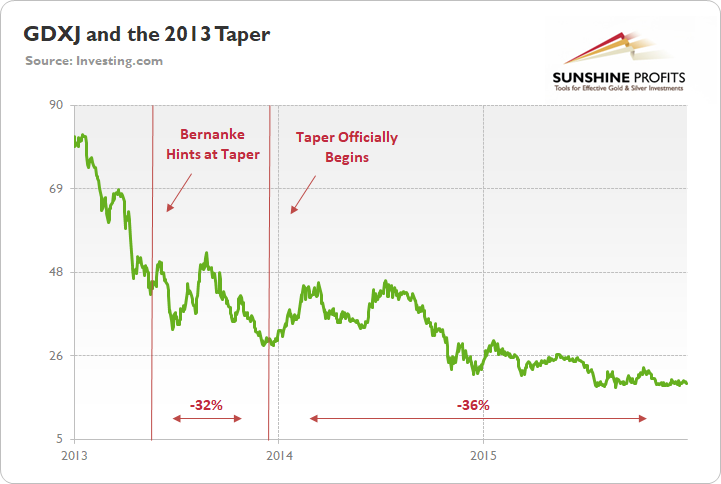
To that point, with the precious metals extremely allergic to a hawkish Fed, I’ve highlighted on numerous occasions how the GDXJ ETF suffered following the 2013 taper. With 2022 Fed policy looking even more hawkish than in mid-2014, the latter’s downtrend should have plenty of room to run.
In conclusion, the PMs were mixed on Nov. 10, and the scorching inflation print was largely ignored by investors. However, with the Fed poised to provide another dose of reality on Dec. 15, the recent volatility should persist. To that point, it’s important to remember that the S&P 500’s volatility increased materially after the Fed tapered in 2013. With stock market drawdowns bullish for the USD Index and bearish for the PMs, there are plenty of technical, fundamental, and sentiment factors brewing that favor the theme of ‘USD Index up, PMs down’ over the medium term.
Thank you for reading our free analysis today. Please note that the above is just a small fraction of the full analyses that our subscribers enjoy on a regular basis. They include multiple premium details such as the interim targets for gold and mining stocks that could be reached in the next few weeks. We invite you to subscribe now and read today’s issue right away.
Sincerely,
Przemyslaw Radomski, CFA
Founder, Editor-in-chief -
Gold & Silver Trading Alert #2
December 10, 2021, 12:11 PMI thought that you’d appreciate a quick note before the end of the week. Not much is happening today, but what is happening is bearish. Miners are underperforming gold once again on an intraday basis – GLD is up, while GDX and GDXJ are relatively flat.
However, as I plotted GDXJ, GLD and S&P 500 on the same chart, it became obvious that miners are actually underperforming in a few different ways, which make the overall picture even more bearish.
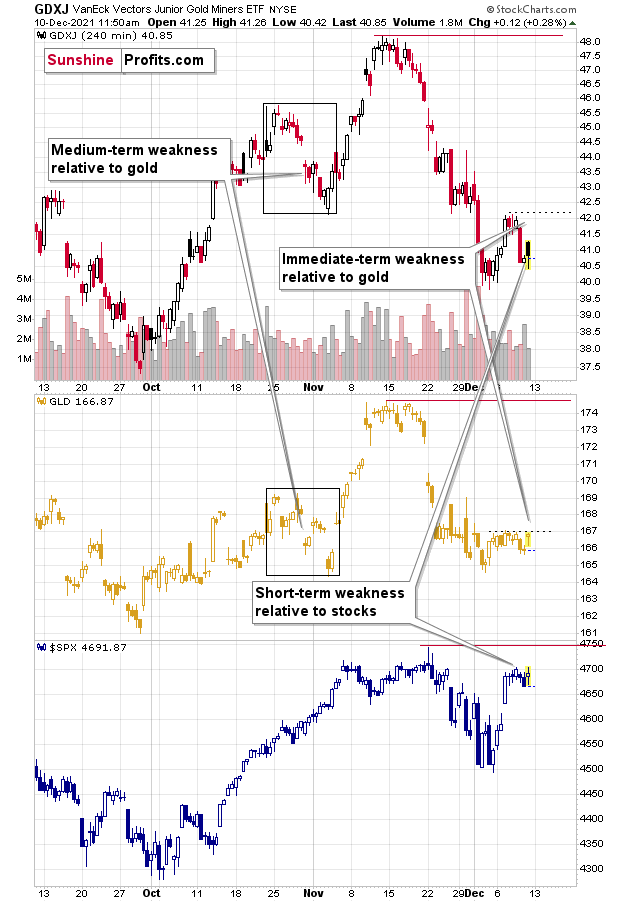
GLD moved to its recent highs, while GDXJ didn’t, and it also moved back to the start of today’s session. That’s significant underperformance on an immediate-term basis.
While the general stock market declined at the beginning of this month and junior miners followed, some said that as stocks recover, miners should recover as well. Stocks recovered and rallied to new monthly highs, and GDXJ didn’t. It’s much closer to its monthly lows than it is to its monthly highs. The implications are bearish.
Finally, please note that while the GLD ETF is trading between its October/November highs and lows, the GDXJ ETF is trading well below its November lows. This is – once again – bearish.
So, all in all, what we see so far today confirms the bearish outlook for the mining stocks. It seems that the profits on our short positions in the junior mining stocks (and/or in silver, if anyone shorts that part of the precious metals market) are likely to be much bigger in the following weeks, and perhaps also days.
As always, I’ll keep my subscribers informed.
Thank you.
Sincerely,
Przemyslaw Radomski, CFA -
All’s Well That Ends Well, But Gold Is Far From Finished
December 10, 2021, 7:22 AMFundamentals are as strong as ever, but gold has to go some way down before it can resume its uptrend. Think of Moria from The Lord of the Rings.
While inflation has soared, the S&P 500 has soared, WTI has soared, and copper has soared, 2021 has been extremely unkind to the precious metals. Gold has declined by 6.25%, silver by 16.66% and the GDX ETF by 14.83% YTD – not to mention the GDXJ ETF (our short position), which is down by 24.91% (all as of the Dec. 9 close).
Moreover, investors often assume that material underperformance provides them with buying opportunities. I mean, why not position for a reversion to the mean? However, the harsh truth is that bearish technicals predicted these drawdowns well in advance. And while 2021 has been rough, the charts signal more downside in 2022.
To explain, while gold prices, silver prices, and mining stocks rallied hard in October, their price action was more of a trick than a treat. And with the trio becoming part of the bears’ Thanksgiving dinner in November, only Santa Clause can save them now.
However, while the S&P 500 had uplifted sentiment, the GDX ETF closed the Dec. 9 session one cent below its Dec. 3 close and the senior miners gave back all of their early-week stock-market-induced gains. As a result, investors aren’t showing much faith in the GDX ETF’s medium-term prospects.
Please see below:
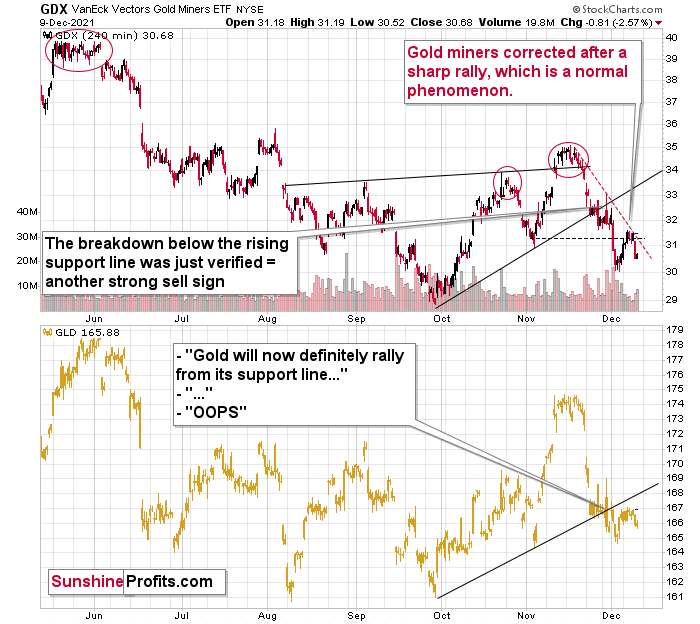
As further evidence, the GDX ETF’s 4-hour chart is also sending ominous signals. For example, after running into its declining resistance line (the red dashed line on the right side of the chart below), the senior miners’ momentum fizzled, and a sharp decline followed.
For more context, I wrote the following on Dec. 7 and updated the analysis on Dec. 9:
After verifying the breakdown below its rising support line, the GDX moved lower, just as I expected it to. Now it’s after a breakdown below its previous (November) lows, and it seems to be verifying that breakdown just as it verified the breakdown below the rising support line in late November.
The black dashed line in the above chart shows the resistance provided by the previous lows. It wasn’t invalidated. At the same time, the GDX is well below its declining red resistance line, and even if it moves close to this line but then declines, it will not be viewed as something bullish.
What happened yesterday (Wednesday) and on Tuesday is exactly what I put in bold.
Gold miners moved to their declining red resistance lines and then they moved back down.
As far as the November lows are concerned, while it might not be 100% clear based on the above chart, it is the case that the lowest daily close in November was $31.53, and yesterday, the GDX ETF closed the day at $31.49. As the daily closes are more important than the mid-session candlestick closes, I don’t view the breakdown below the November lows as invalidated.
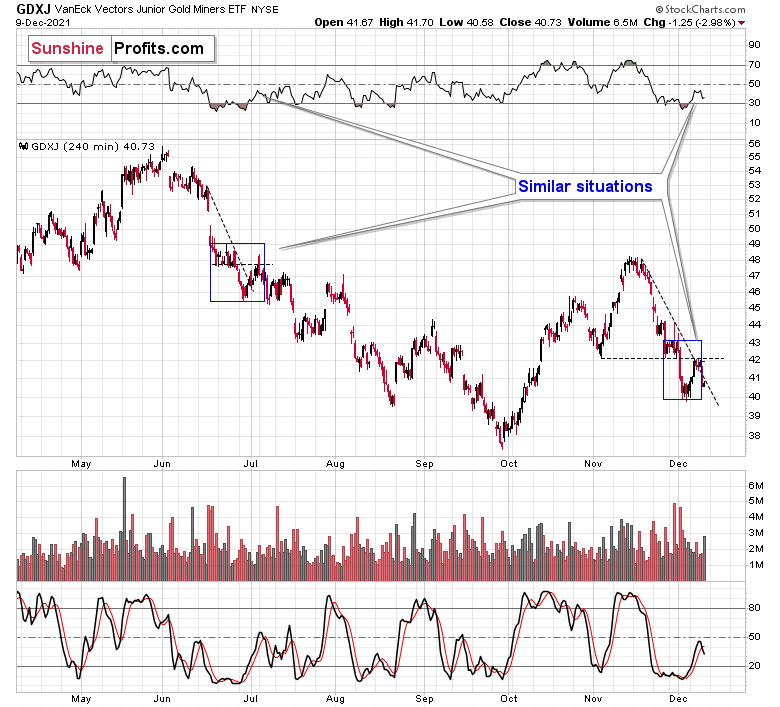
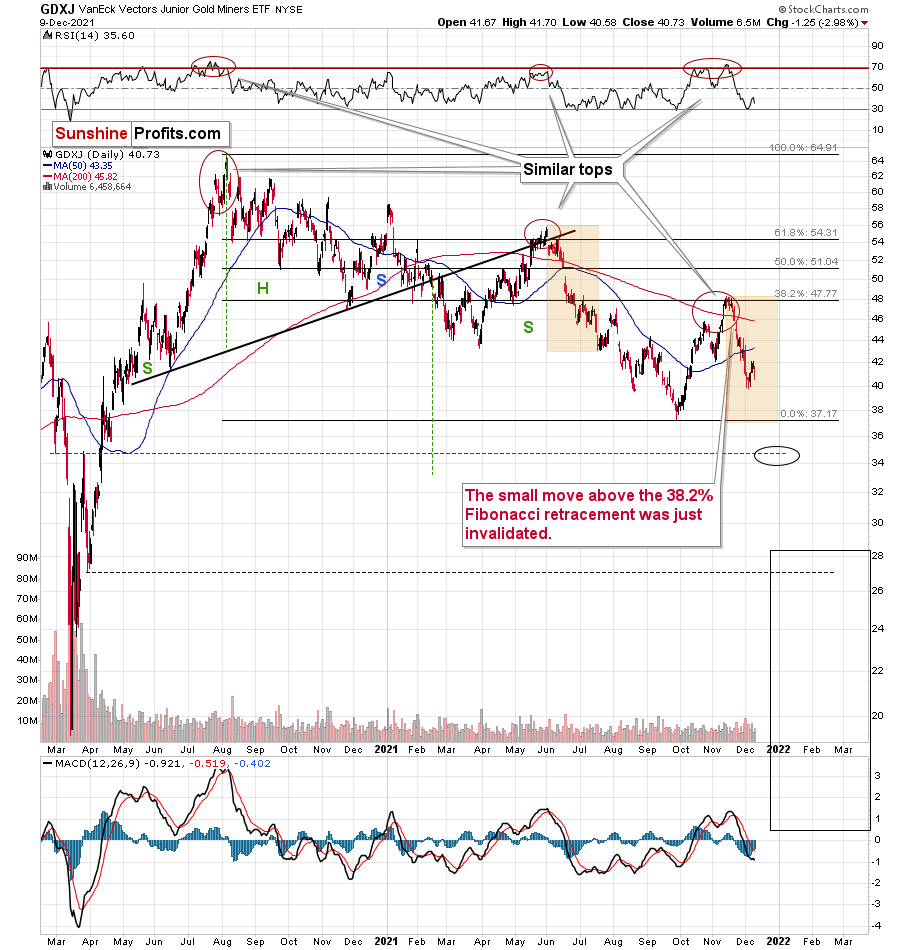
Showcasing similar weakness, the GDXJ ETF also reversed sharply after slightly breaking above its declining resistance line (the black dashed line on the right side of the chart below). The invalidation of the breakout served as a strong sell sign, and it’s no wonder that junior miners declined by almost 3% yesterday.
Moreover, investors rejected the junior miners’ attempt to rally back above their November lows. As a result, whether big or small, the gold miners have struggled mightily.
Please see below:
To that point, with more negativity likely to commence in the coming weeks and months, I wrote on Dec. 2 that the selling pressure may persist until the GDXJ ETF reaches its September lows:
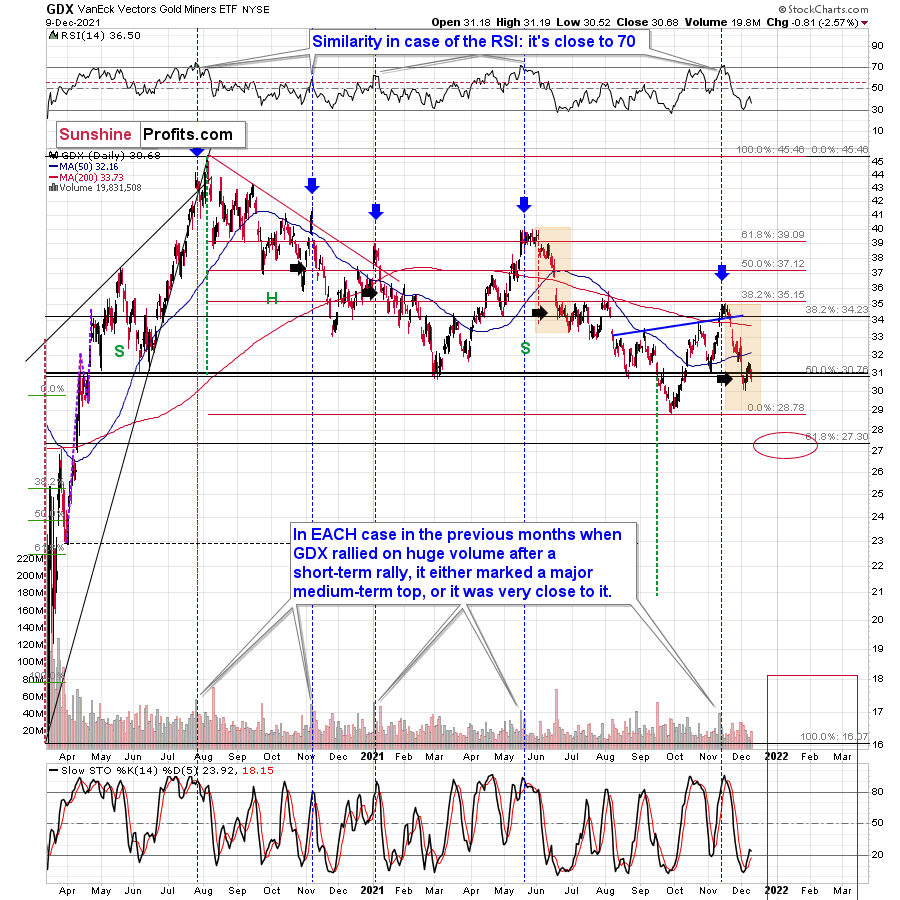
One of the previous situations that’s similar to the current one is what we saw right before the mid-year top. I marked mid-year declines (from the start to the first more visible correction) in both charts: GDX and GDXJ with orange rectangles. If the history repeats itself, both proxies for mining stocks could move back to their previous 2021 lows before correcting.
Please see below:
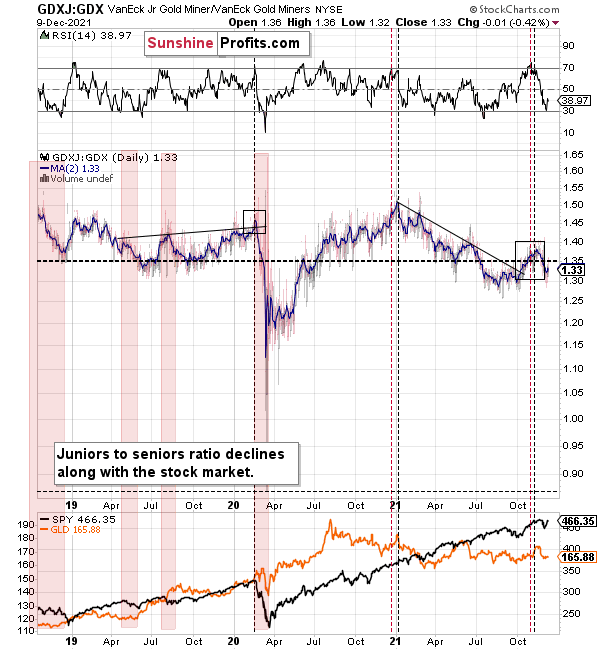
Finally, while I’ve been warning for months that the GDXJ/GDX ratio was destined for devaluation, the ratio has fallen precipitously in 2021. Interestingly, the ratio is still moving lower, its RSI was previously overbought, and similar periods of excessive optimism have preceded major drawdowns (marked with the black vertical dashed lines below).
For example, the ratio showcased a similar overbought reading in early 2020 – right before the S&P 500 plunged. On top of that, the ratio is still near its mid-to-late 2020 lows and its mid-2021 lows. As a result, the GDXJ ETF will likely underperform the GDX ETF over the next few months. It’s likely to underperform silver in the near term as well.
Furthermore, a drop below 1 in the ratio isn’t beyond the realms of possibility. In fact, it’s actually quite likely – that’s what happened in 2020 as well, and that’s why I’m shorting the GDXJ ETF.
For context, I believe that gold, silver, and the GDX ETF are all ripe for sharp re-ratings over the medium term. However, it’s my belief that the GDXJ ETF offers the best risk-reward ratio due to its propensity to materially underperform during bear markets. As a result, shorting junior miners remains the most prudent strategy, in my opinion.
In conclusion, while the seasons have changed, gold, silver, and mining stocks’ downtrends have remained the same. With a cold winter likely to culminate with new lows, the precious metals should embark on a tumultuous journey over the medium term. However, as Shakespeare told us: all's well that ends well. And with gold, silver and mining stocks poised to soar in the years to come, the bulls should have the last laugh over the long term. In the meantime, patience is prudent, as sharp drawdowns will likely materialize before the precious metals resume their secular uptrends.
Thank you for reading our free analysis today. Please note that the above is just a small fraction of the full analyses that our subscribers enjoy on a regular basis. They include multiple premium details such as the interim targets for gold and mining stocks that could be reached in the next few weeks. We invite you to subscribe now and read today’s issue right away.
Sincerely,
Przemyslaw Radomski, CFA
Founder, Editor-in-chief -
Despite Slight Hiccup, US Dollar Fundamentals Remain Intact
December 9, 2021, 9:07 AMWith the USD Index stuck in consolidation mode, its decline on Dec. 8 may seem material. However, while the greenback cools off after its recent sprint higher, the USD Index's fundamentals are still running hot.
To explain, Japan's Cabinet Office revealed on Dec. 8 that third-quarter GDP declined by 3.6% year-over-year (YoY) and underperformed the preliminary reading of a 3% contraction. On top of that, Bank of Japan (BoJ) Governor Masayoshi Amamiya said on Dec. 8 that looser-for-longer monetary policy will remain intact since inflation is still "well below" the BoJ's 2% annual target.
Please see below:
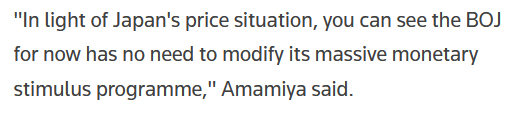 Source: Reuters
As secondary evidence of the U.S. dollar’s fundamental prowess, the Bank of Canada (BoC) released its monetary policy statement on Dec. 8. An excerpt read:
“CPI inflation is elevated…. [However], gasoline prices, which had been a major factor pushing up CPI inflation, have recently declined. Meanwhile, core measures of inflation are little changed since September. The Bank continues to expect CPI inflation to remain elevated in the first half of 2022 and ease back towards 2 percent in the second half of the year. The Bank is closely watching inflation expectations and labour costs to ensure that the forces pushing up prices do not become embedded in ongoing inflation.”
And contrasting the recent hawkish rhetoric from Fed Chairman Jerome Powell, BoC Governor Tiff Macklem maintained his dovish disposition:
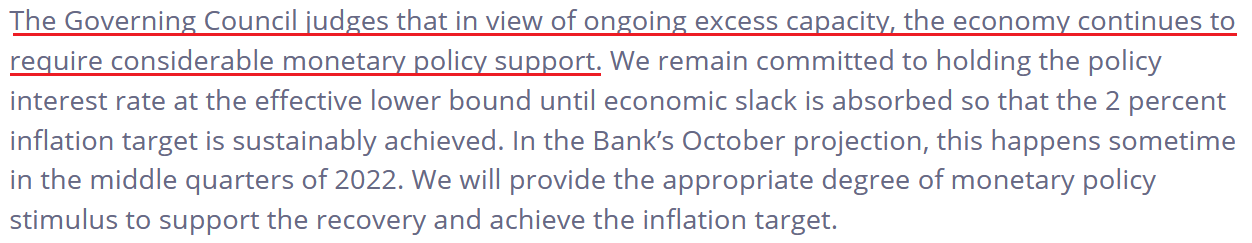 Source: BoC
Third, the EUR/USD is clearly the head of the snake. And while the currency pair rallied sharply alongside the risk-on sentiment, Danske Bank told clients on Dec. 7 that "Peak EUR" has already occurred and that shorting the EUR/USD is its top trade for 2022.
"2022 is likely to bring more of the most recent history. European institutions are conducting a EUR-negative policy in their fight against COVID-19, which will have negative ramifications beyond the COVID-19 crisis itself," wrote Chief Analyst Kristoffer Kjær Lomholt.
Moreover, Lomholt specifically highlighted the Eurozone’s declining Terms of Trade (ToT). For context, ToT compares a regions’ export prices to its import prices. In a nutshell: when a region sells its exports for more than it pays for its imports, its ToT increases. Conversely, when a region sells its exports for less than it pays for its imports, its ToT decreases.
And since “the surge in (commodity) prices has negatively affected Europe (import prices) and positively helped US (export prices),” he expects “more to come as liquidity tightens, global growth expectations increasingly peak, and the market sees more asymmetry between EUR and USD across factors such as economic dynamism.”
Please see below:
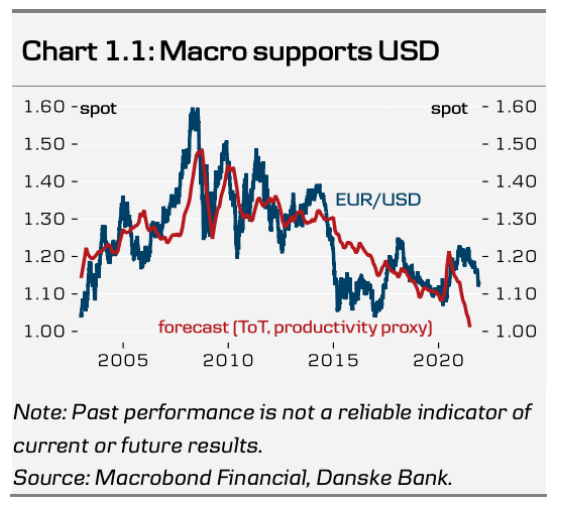
To explain, the blue line above tracks the EUR/USD, while the red line above tracks the relative Eurozone-U.S. ToT. If you analyze the relationship, you can see that U.S. outperformance often coincides with a weaker EUR/USD. And with the red line falling off a cliff recently, the currency pair remains far from its fair value. As a result, Danske Bank expects the EUR/USD to hit 1.0800 in 2022.
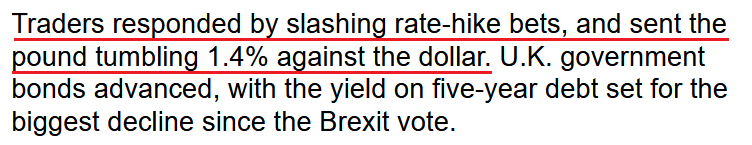
Fourth, after the Bank of England (BoE) was perceived as the hawkish bank on the block in October, officials voted 7-2 to keep interest rates unchanged on Nov. 4. For context, I wrote on Nov. 5:
After criticism erupted following the overpromise and under-deliver event, BoE Governor Andrew Bailey said that “I don’t think it’s our job to steer markets day by day and week by week.”
And how did investors react?
 Source: Bloomberg
To that point, Goldman Sachs did a complete 180 on Dec. 8, telling clients that its prior forecast of a 15 basis point hike in December has been delayed until February.
"Previously, we had thought a 15bp hike in December was more likely than not, but this was a close call,” Goldman Sachs rates strategists wrote. “We now think risk management considerations will dominate in next week’s MPC deliberations. We now look for a 15bp rise in the February MPC meeting."
And why is all of this so important?
Well, with the USD/JPY, the USD/CAD, the EUR/USD, and the GBP/USD combined to account for more than 92% of the USD Index’s movement, the dollar is still the cleanest shirt within the FX basket of dirty laundry.
For context, U.S. fundamentals are far from perfect. However, relative performance is what matters. And with the BoJ in ultra-ease mode, the BoC standing pat, the ECB dismissing a 2022 rate hike, and the BoE now confronted with rising coronavirus cases, the USD Index’s price action on Dec. 8 was likely an outlier.
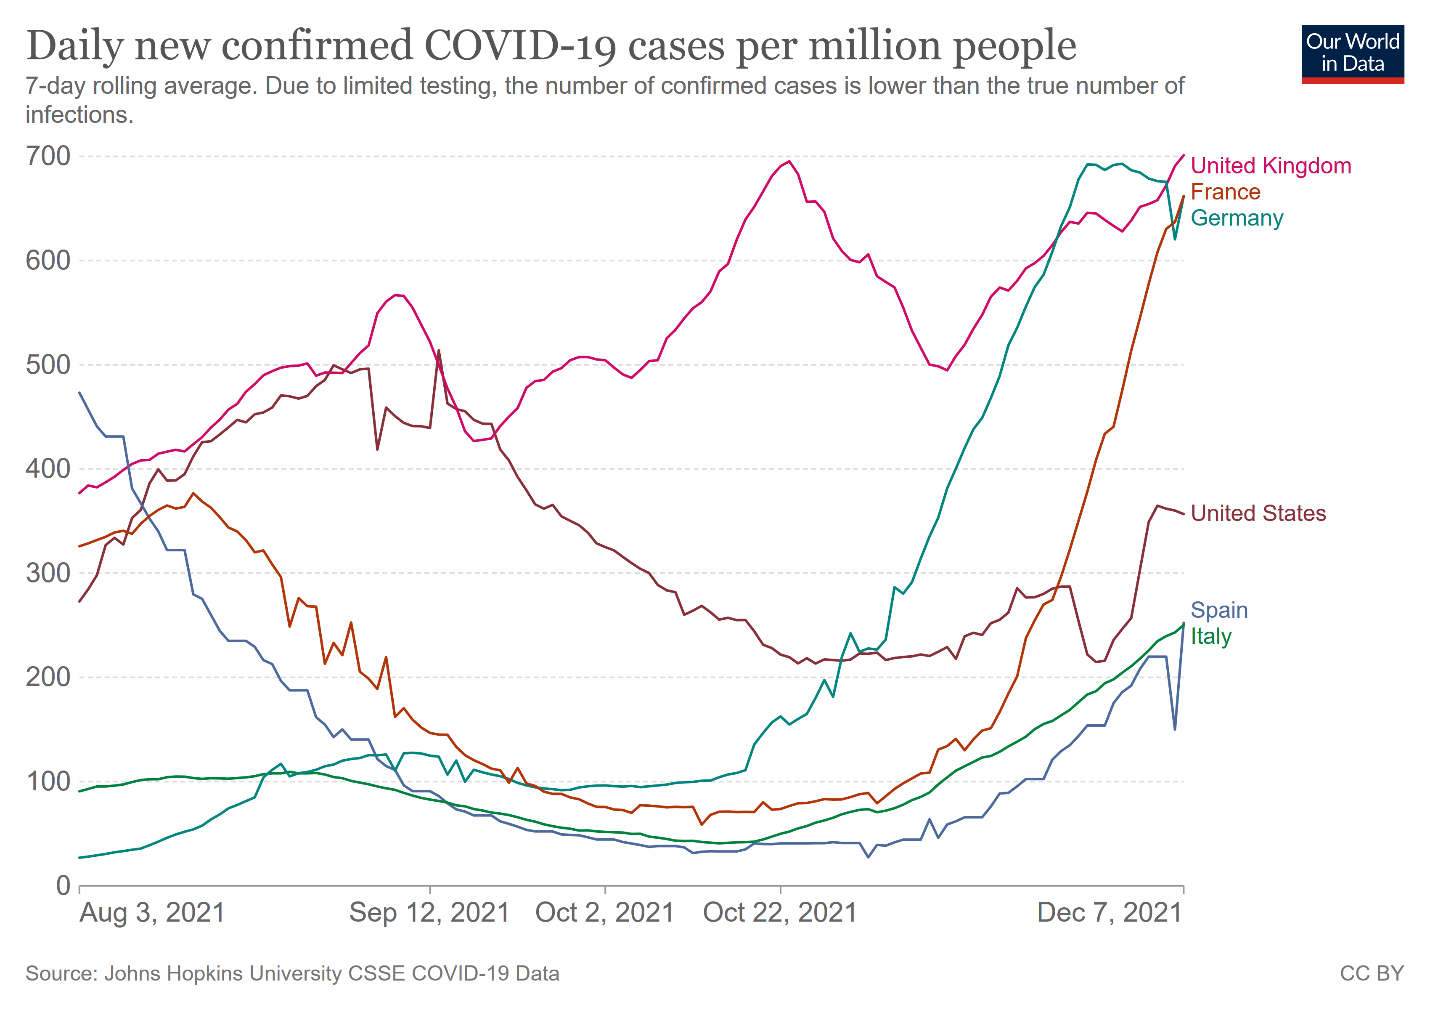
For your reference, coronavirus cases have risen materially in the Eurozone, while U.S. cases have remained roughly flat.
Please see below:
What’s more, U.K. Prime Minister Boris Johnson announced new restrictions on Dec. 8. Thus, disrupting economic activity only weakens the fundamental value of the British pound:
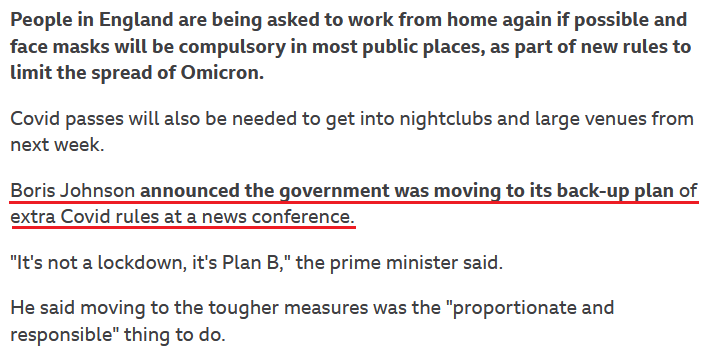 Source: the BBC
Finally, while the news has largely faded from the front page, the number of Chinese property developers suffering debt woes continues to increase. And whether it’s Evergrande, Kaisa Group or the China Aoyuan Group, hundreds of billions of dollars of debt remains in limbo.
As a result, while a Chinese property crisis would likely usher the USD Index well above 100, a simple slowdown of the Chinese economy is also bullish for the greenback.
Please see below:
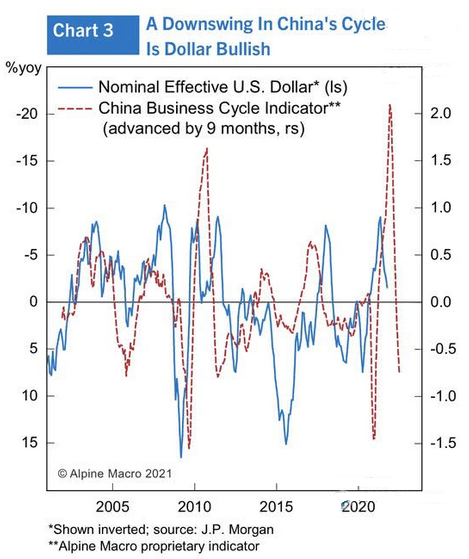
To explain, the red line above tracks Alpine Macro’s China Business Cycle Indicator (advanced by nine months), while the blue line above tracks the inverted (scale flipped upside down) USD Index. If you analyze the relationship, you can see that a weak Chinese economy often supports the USD Index’s uprisings. And with a sharp slowdown already present and expected to continue, more weakness could propel the USD Index to triple digits in 2022.
The bottom line? While daily sentiment garners all of the attention, technicals and fundamentals will likely rule the day over the medium term. And with King Dollar still holding the currency throne, the USD Index will likely rule the weeks and months ahead as well. Moreover, with the PMs often moving inversely to the greenback, they’re unlikely to celebrate if/once the dollar party gains more power.
In conclusion, the PMs were mixed on Dec. 8, and mining stocks outperformed once again. However, as mentioned on Dec. 8, the S&P 500’s ascent often uplifts the junior miners. Despite that, though, with corporate buybacks done for the year on Dec. 10, the algorithms may enable the sell programs soon after. As a result, the S&P 500’s days of uplifting mining stocks could be nearing their end. Likewise, with a shift in sentiment likely to support the U.S. dollar, the greenback’s already robust fundamentals should grow even stronger.
Thank you for reading our free analysis today. Please note that the above is just a small fraction of the full analyses that our subscribers enjoy on a regular basis. They include multiple premium details such as the interim targets for gold and mining stocks that could be reached in the next few weeks. We invite you to subscribe now and read today’s issue right away.
Sincerely,
Przemyslaw Radomski, CFA
Founder, Editor-in-chief


Gold Investment News
Delivered To Your Inbox
Free Of Charge
Bonus: A week of free access to Gold & Silver StockPickers.
Gold Alerts
More-
Status
New 2024 Lows in Miners, New Highs in The USD Index
January 17, 2024, 12:19 PM -
Status
Soaring USD is SO Unsurprising – And SO Full of Implications
January 16, 2024, 8:40 AM -
Status
Rare Opportunity in Rare Earth Minerals?
January 15, 2024, 2:06 PM

