
tools spotlight

-
Silver: Strong and Weak at Once. How Is That Even Possible?
December 21, 2021, 9:23 AMGold is barely crawling up, while silver is boldly climbing the market ladder. When will its rungs turn slippery, causing the precious metal to fall?
Yesterday’s session was particularly uneventful in the case of the precious metals market, as crude oil and the general stock market stole the spotlight.
Consequently, today’s analysis will focus on what’s happening in pre-market trading, as that’s what appears to be more important.
At the moment of writing these words, gold is up very modestly – less than 0.2%.
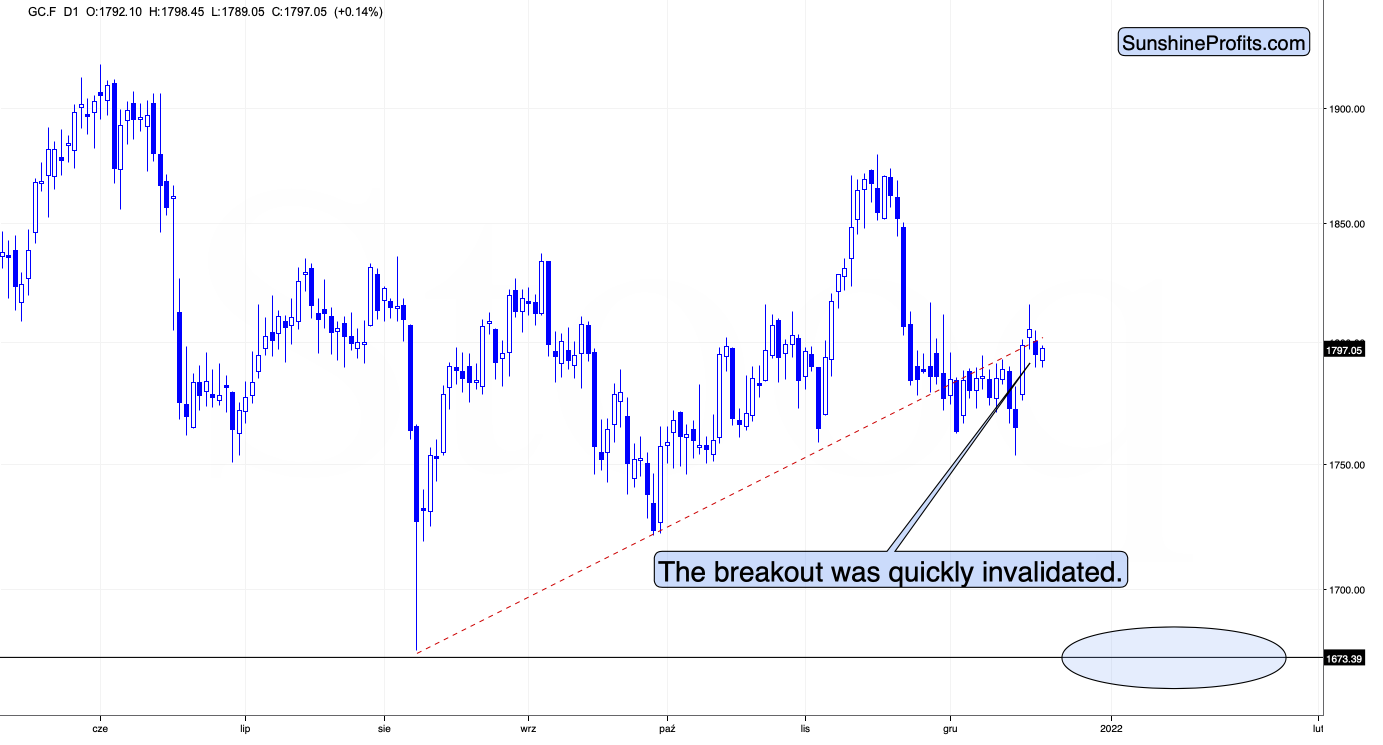
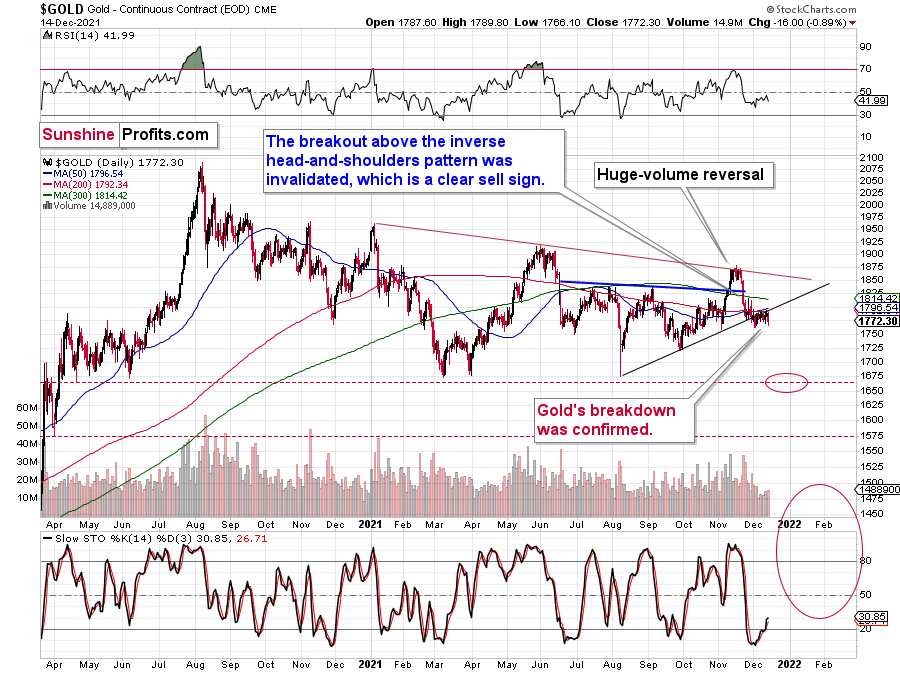
Consequently, after rallying to about $1,815 (in tune with my Thursday’s analysis) and invalidating the breakout above the rising resistance line, gold appears to be making another attempt to rally, but the strength of the move is very limited.
Predicting higher gold prices might not be the best idea here, as the yellow metal was not able to even get to the red line, let alone to its previous monthly high.
Silver, on the other hand, has moved quite visibly higher so far today.
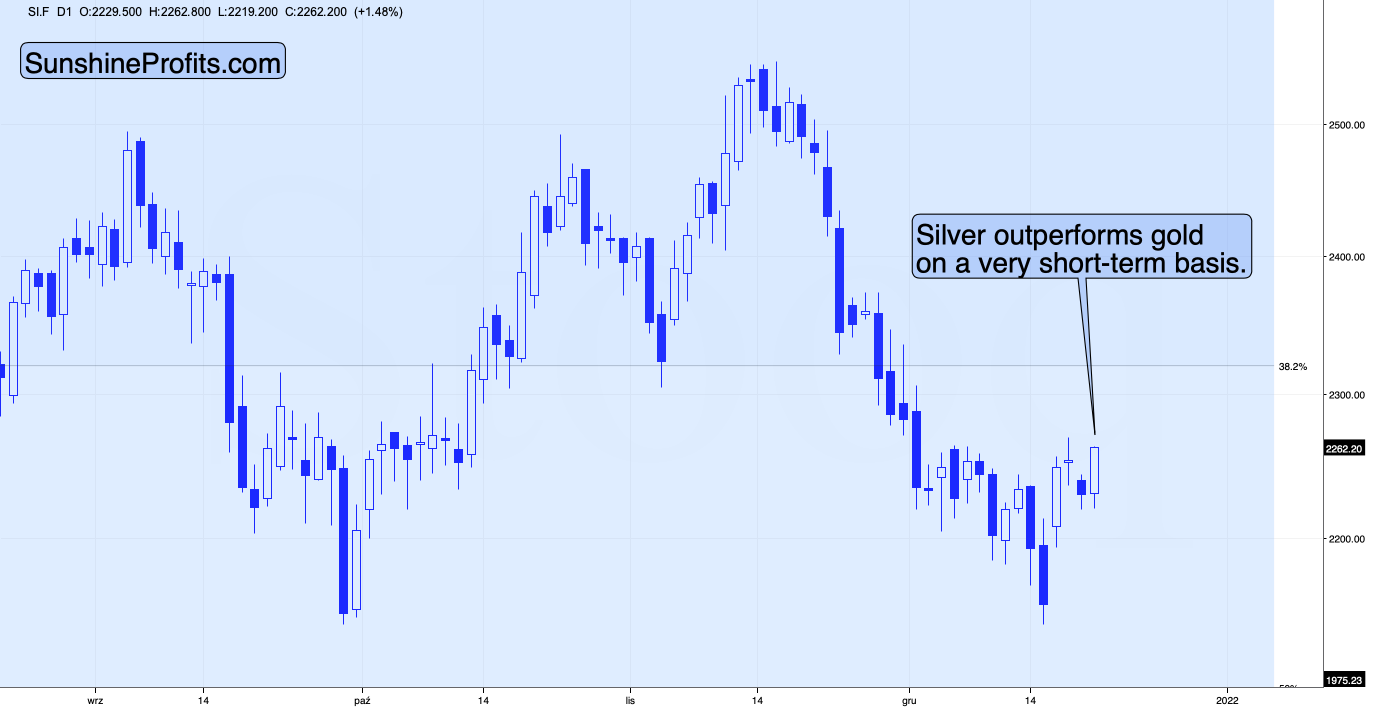
While gold moved higher by less than 0.2%, silver rallied by about 1.5% and is now trading very close to its previous monthly highs.
This is very interesting, because silver is showing strength and weakness at once. How is that possible – one might ask.
It’s the same as with trends or forecasts for silver. They can be bearish and bullish simultaneously, depending on the time frame that one focuses on. For example, I think that the very long-term outlook for silver is extremely bullish, but I also think that the medium-term trend is bearish. The short-term trend is also bearish, but the immediate-term trend is bullish. So, am I bullish or bearish on silver? Answering this without specifying the time frame is bound to create misunderstandings.
Getting back to silver’s relative performance, it’s been weak when taking into account the last couple of weeks – please note how little of the recent monthly decline silver has corrected compared to gold. Gold recently moved to its October highs, but silver topped a few dollars below its October high. What does it tell us? Silver is likely to fall hard, also compared to gold, probably in tune with the general stock market – similarly to what happened in 2008 and 2020. That’s the same kind of performance that we saw in the very early parts of the huge declines.
At the same time, silver is strong compared to gold on an immediate-term basis. This means that we’re likely at or close to a short-term top. Why? Because that’s what the precious metals market tends to do when it’s topping, and it’s one of the great gold trading tips to monitor the PM market for these situations. One could debate why this is really the case, and there are quite a few theories (the silver market is smaller, so more prone to sudden moves, etc.), but the point is that it simply works. Please note that some things – like the Pareto principle (a.k.a. the 20:80 rule) – can work and be very useful, even if it’s not clear why they work.
Consequently, it seems that the days of this short-term corrective upswing are either over or about to be over, and that the precious metals sector will return to its medium-term decline any day now.
Thank you for reading our free analysis today. Please note that the above is just a small fraction of the full analyses that our subscribers enjoy on a regular basis. They include multiple premium details such as the interim targets for gold and mining stocks that could be reached in the next few weeks. We invite you to subscribe now and read today’s issue right away.
Sincerely,
Przemyslaw Radomski, CFA
Founder, Editor-in-chief -
USD’s Next Roar Will Make Gold Cry
December 20, 2021, 10:35 AM“That’s all Folks!”
- Porky Pig at the end of the Looney Tunes cartoon series
The above is what immediately came to my mind after seeing Friday’s price action in the precious metals sector. Why? Because of the reversals and tiny outperformance of silver.
And also because of USD’s decisive daily rally. Let’s start with the latter.
After briefly moving below its rising support line, the USD Index soared back up and the situation is now much more bullish than it was a month ago, when the USD Index was breaking through the 96 level for the first time in many months.
The reason is that now, the USD Index is already after a sizable consolidation. The RSI indicator reflects that as well – it’s no longer in the overbought territory.
And if the USD Index soars once again, precious metals are likely to slide. What we saw in gold, silver, and – in particular – mining stocks on Friday confirms that.
Gold moved to $1,815.70 on Friday, but it’s now once again below $1,800.
This means that the yellow metal moved above its rising support line on Friday, but it ended the day just slightly above it and based on today’s pre-market decline, it’s once again back below this line. The breakout was invalidated.
On Thursday, after gold’s reversal, I wrote the following:
Well, gold moved visibly higher from the recent lows, but:
- It hasn’t invalidated its previous breakdown below the rising red support line
- Even if the size of the very recent rally doubled, gold would not move up that significantly – perhaps to $1,815 or so.
There’s also a risk that gold might rally more visibly because of the similarity to what happened earlier this year.
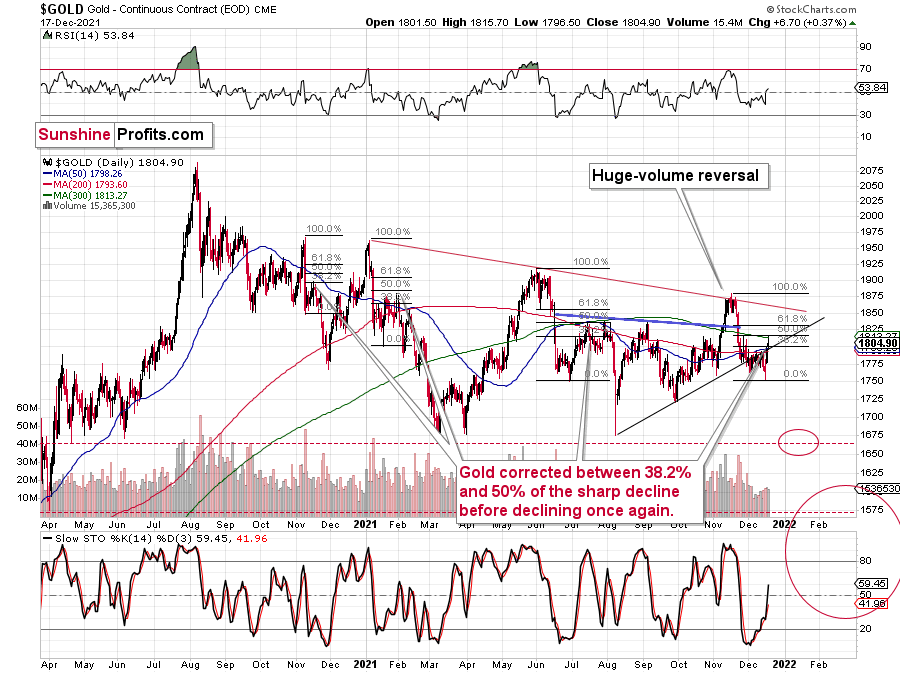
Well, gold did exactly that. The yellow metal moved to late-November highs on Friday, to its 300-day moving average, and it all happened in tune with the previous patterns and with what I wrote previously.
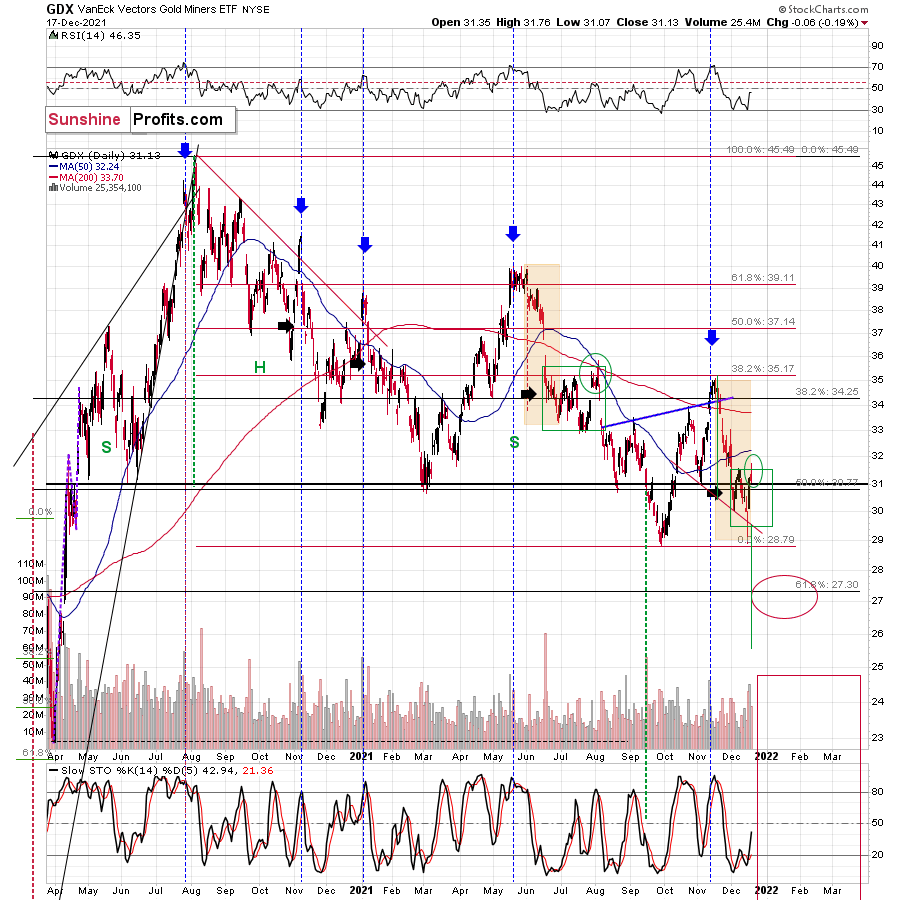
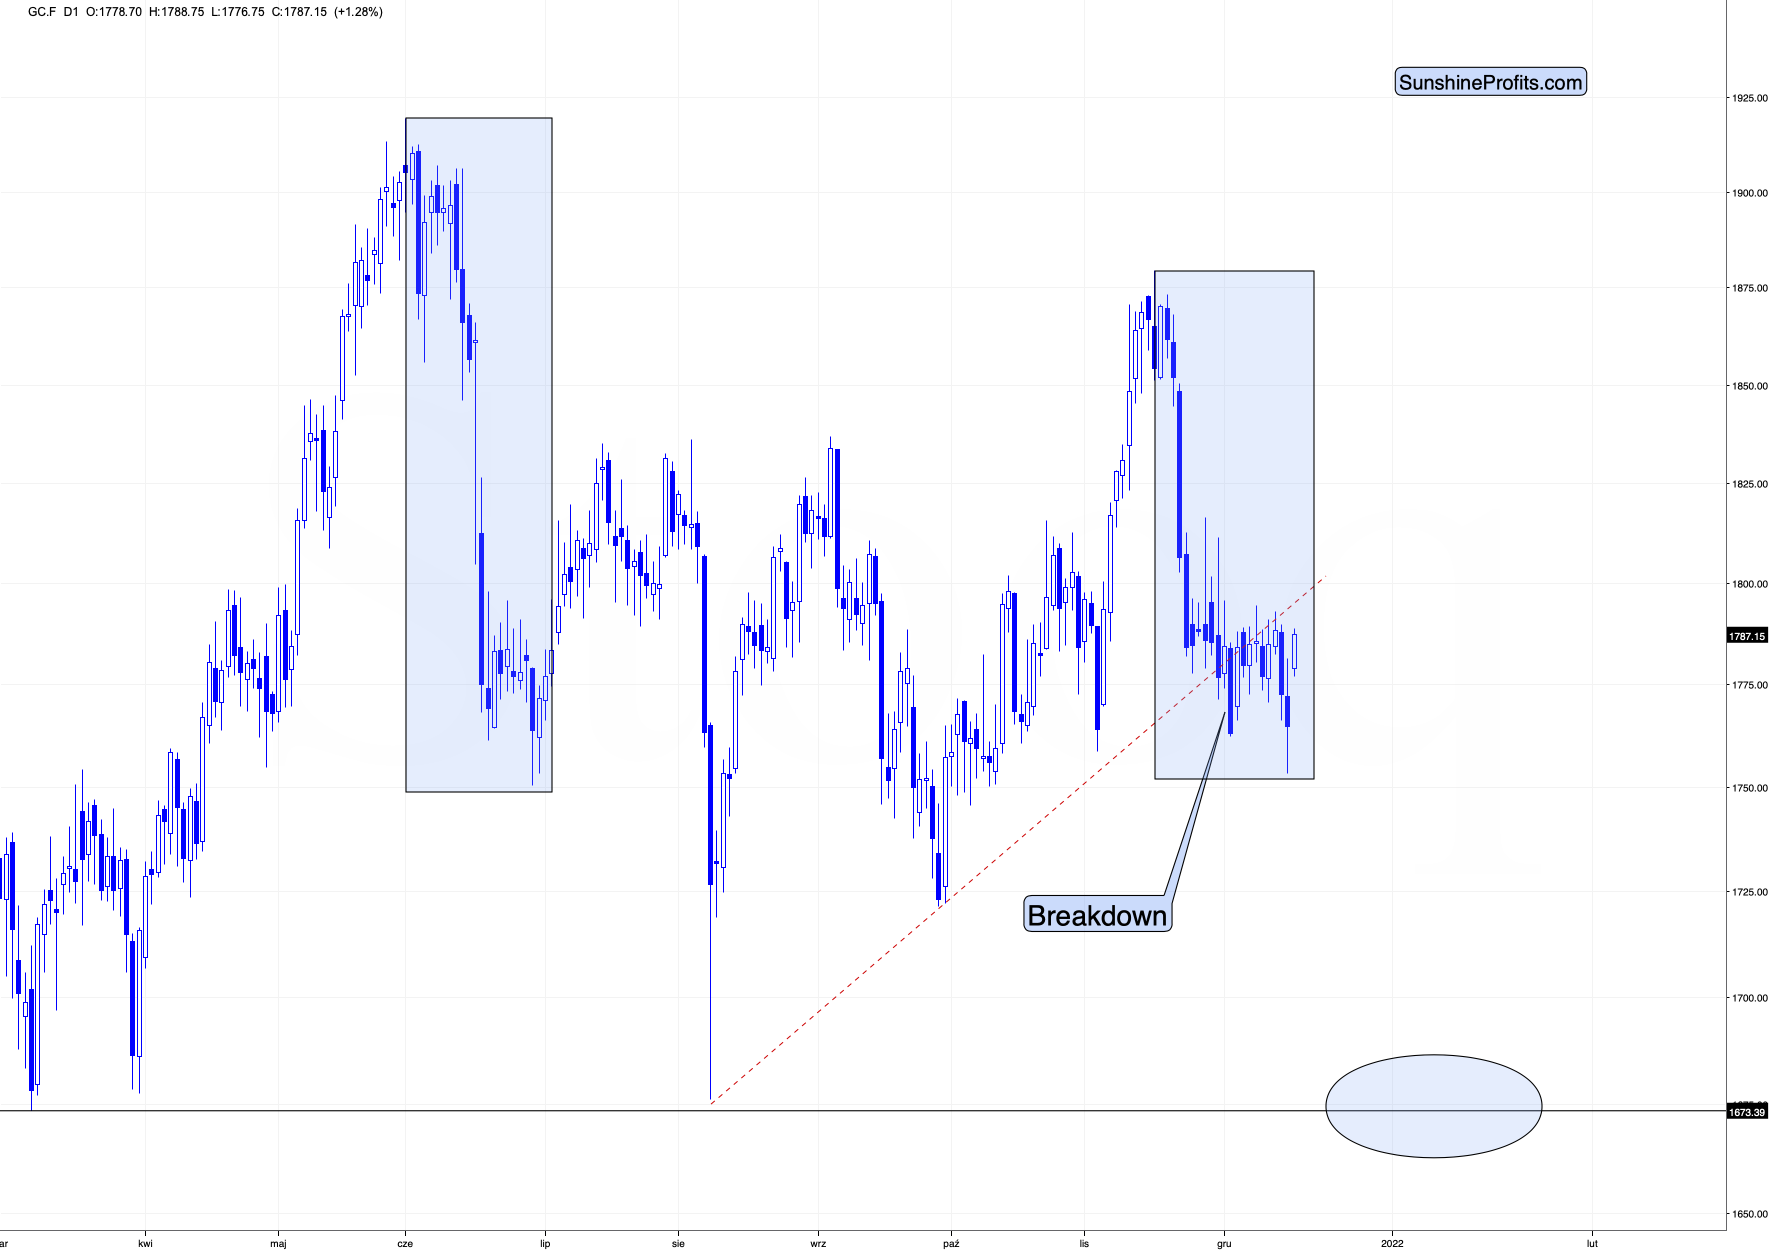
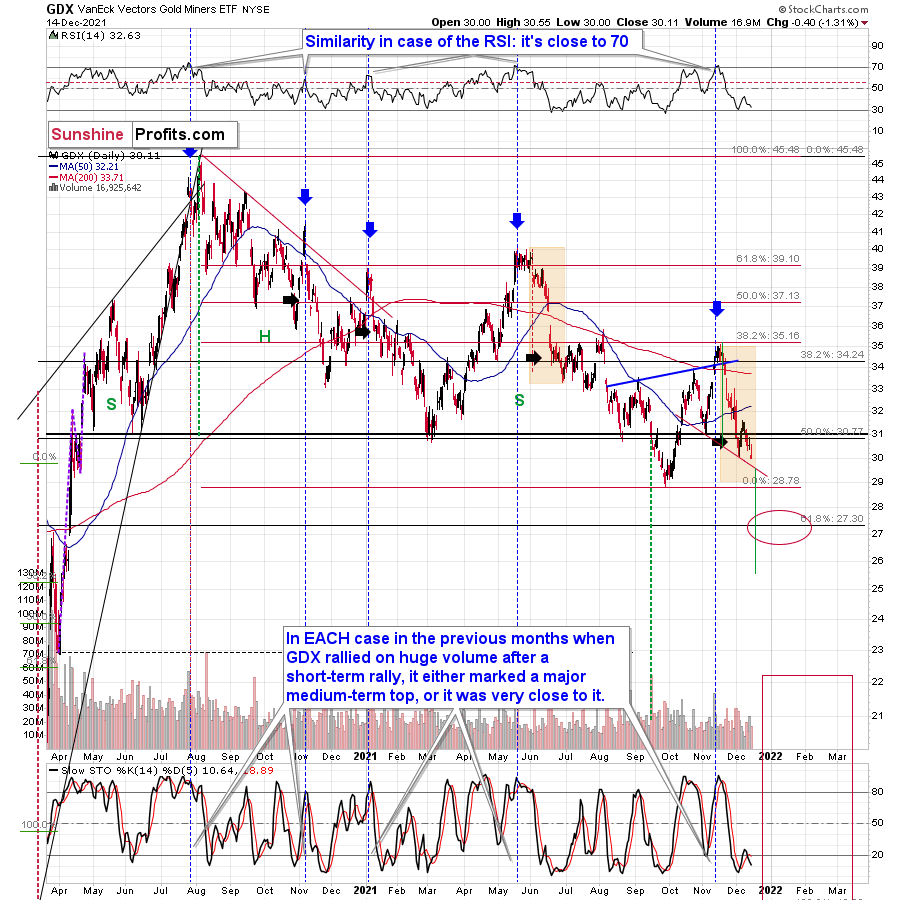
There’s also another pattern that I marked on the above chart. After the previous sharp declines, gold corrected between 38.2% and 50% of the decline, and only after this consolidation did it move to new lows. We saw that in November 2020, January 2021, and July 2021. And it seems that it’s exactly what we saw right now.
On Thursday, I also wrote the following:
But how much did the mining stocks rally in July?
Please take a look at the areas marked with green rectangles. There was a tiny rally in July 2020, but it was nothing significant, unless one was engaged in day-trading or very short-term trading.
So, will we see a rebound here? That’s probably going to be the case. Will it be significant? That depends.
It might be quite visible in case of gold, but not necessarily in case of mining stocks.
In fact, at the moment of writing these words, gold is trading very close to its December highs, while the GDXJ (in London trading) corrected about 23.6% of the entire December decline.
Consequently, if I had a short position in gold, I would probably close it right now in order to re-enter it at higher prices, but since I don’t have one, but I have a short position in junior mining stocks, I’m choosing to keep it intact and wait out the possible correction.
Well, the corrective upswing in mining stocks wasn’t that significant as the one in gold. Miners moved just slightly above their December highs, but close back below them, thus invalidating this breakout. Unlike gold, they were not even close to reaching their late-November highs.
Silver outperformed gold on Friday, but only slightly and only on an immediate-term basis. Overall, just like mining stocks, silver was rather weak during this corrective upswing – relative to gold that is.
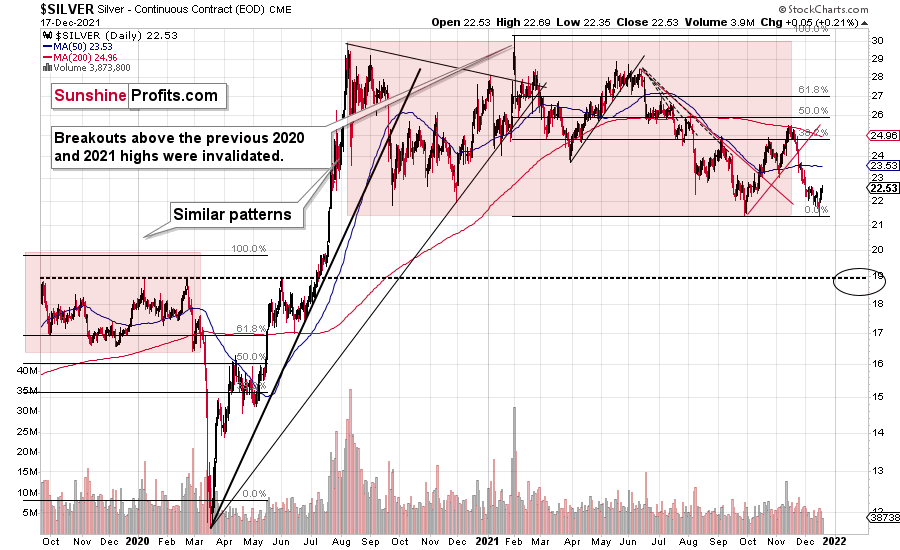
Does this remind you of something? It should, as it has March 2020 written all over it.
Silver corrected after a sizable short-term decline and after reaching its previous lows. Will it now decline substantially? That’s likely, but this time the decline might not be as volatile. After all, it’s not the case that the lockdowns are being introduced for the first time and nobody knows what’s going to happen and how. People are not panicking in the way they panicked in 2020.
Then again, the markets (the main stock indices) are more overvalued, and more capital was used to pump it, so the declines are likely to be huge anyway – also in the PMs. They simply might not be as sharp as they were in 2020. What happened a couple of days back then, might take a couple of weeks this time, but it’s likely to happen, nonetheless.
Thank you for reading our free analysis today. Please note that the above is just a small fraction of the full analyses that our subscribers enjoy on a regular basis. They include multiple premium details such as the interim targets for gold and mining stocks that could be reached in the next few weeks. We invite you to subscribe now and read today’s issue right away.
Sincerely,
Przemyslaw Radomski, CFA
Founder, Editor-in-chief -
Dollar’s 2021 Rally – Over or Just Resting?
December 17, 2021, 3:04 AMWith the USD Index suffering a ‘sell the news’ event on Dec. 15, the FOMC’s hawkish Summary of Economic Projections wasn’t enough to uplift investors’ optimism. However, while the dollar day traders performed their usual disappearing act, the greenback’s fundamentals were bolstered by the FOMC’s median projection of three rate hikes in 2022.
What’s more, while the USD Index initially dipped below 96 and fell below its rising resistance line (which is now support) on Dec. 16, buyers stepped in, and the USD Index bounced.
For context, a short-term correction is possible. However, the important point is that the USD Index is likely on a medium-term path to ~98. And with gold, silver and mining stocks often moving inversely to the U.S. dollar, their optimism may disappear over the next few months.
Please see below:
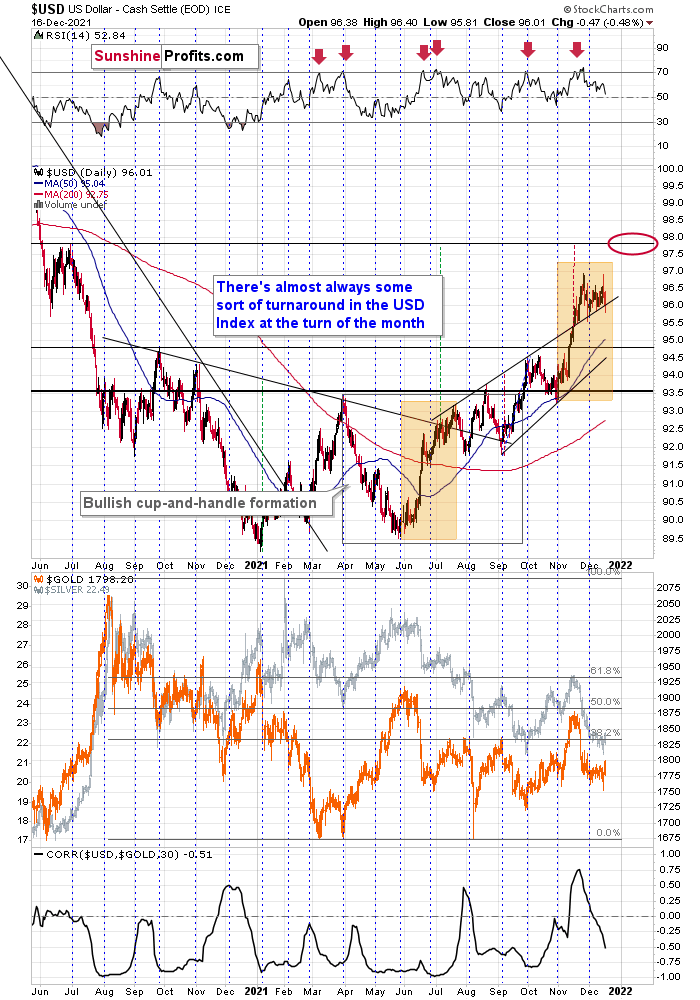
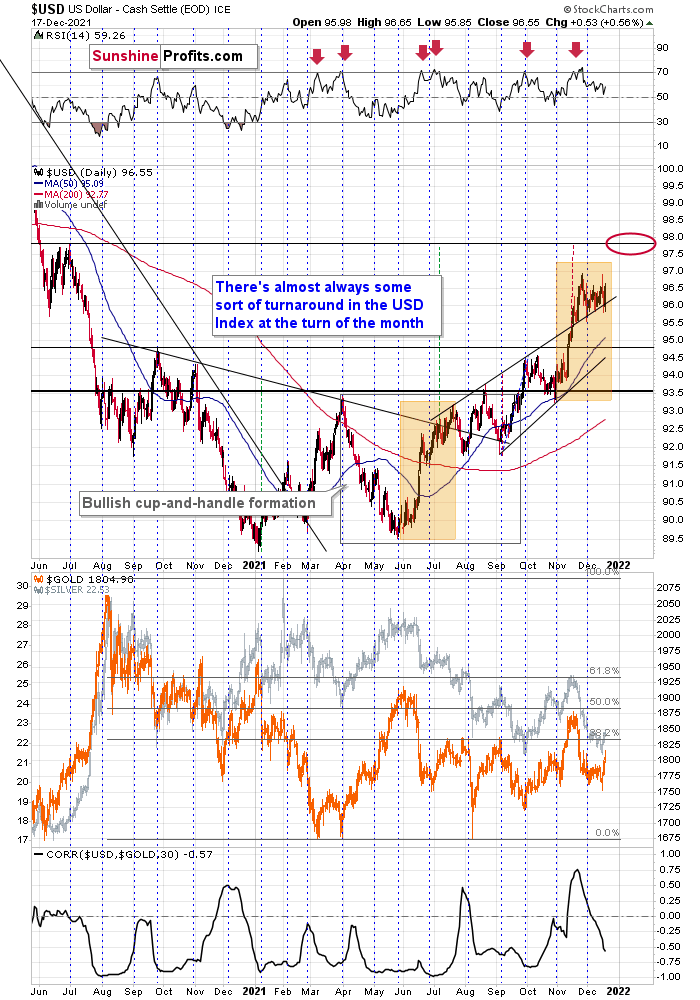
For context, I warned that a consolidation was likely overdue by highlighting the USD Index’s overbought RSI (Relative Strength Index) readings with the red arrows above.
Conversely, the blue vertical dashed lines above demonstrate how the USD Index often bottoms near the end of each month, and rallies often follow. And while the current consolidation may need some more time to run its course, higher highs should materialize over the medium term.
To explain, after the USD Index recorded sharp rallies in June and July, consolidation phases unfolded before the uptrends continued. And while the secondary uprisings occurred at more moderate paces, the USD Index still managed to make new highs. As a result, ~98 should materialize during the winter months.
Furthermore, if the forecast proves prescient, the USD Index’s strength will likely usher gold back to its previous 2021 lows.
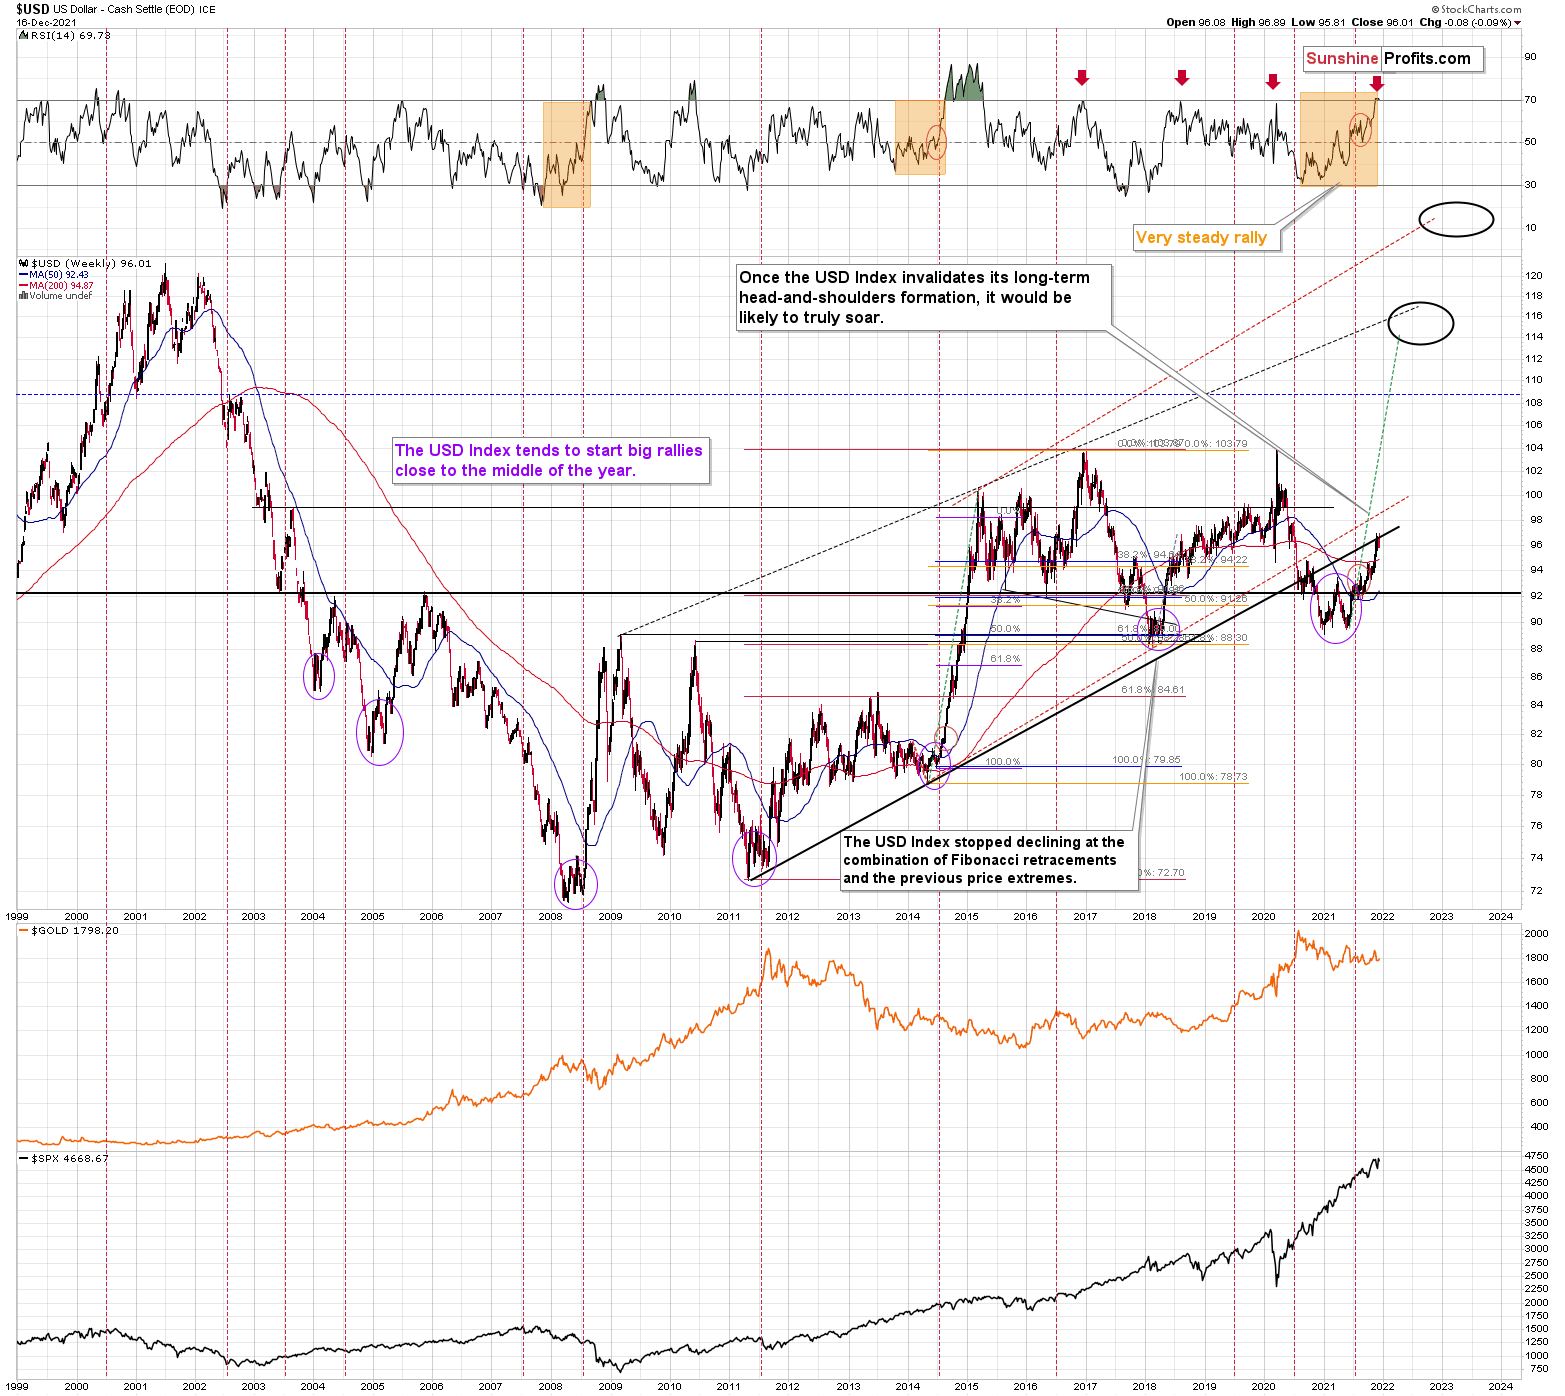
Adding to our confidence (don’t get me wrong, there are no certainties in any market; it’s just that the bullish narrative for the USDX is even more bullish in my view), the USD Index often sizzles in the summer sun and major USDX rallies often start during the middle of the year. Summertime spikes have been mainstays on the USD Index’s historical record and in 2004, 2005, 2008, 2011, 2014 and 2018 a retest of the lows (or close to them) occurred before the USD Index began its upward flights (which is exactly what’s happened this time around).
Furthermore, profound rallies (marked by the red vertical dashed lines below) followed in 2008, 2011 and 2014. With the current situation mirroring the latter, a small consolidation on the long-term chart is exactly what occurred before the USD Index surged in 2014. Likewise, the USD Index recently bottomed near its 50-week moving average; an identical development occurred in 2014. More importantly, though, with bottoms in the precious metals market often occurring when gold trades in unison with the USD Index (after ceasing to respond to the USD’s rallies with declines), we’re still far away from that milestone in terms of both price and duration. Again, the recent move higher in the USD Index doesn’t necessarily apply in the case of the above rule, as it was not the strength of the USD but the weakness in the euro that has driven it.
Likewise, with the USD Index now approaching its long-term rising support line (which is now resistance), a rally above the upward sloping black line above would invalidate the prior breakdown and support a move back above 100.
Also, please note that the recent medium-term rally has been calmer than any major upswing witnessed over the last 20 years, where the USD Index’s RSI has hit 70. I marked the recent rally in the RSI with an orange rectangle, and I did the same with the second-least and third-least volatile of the medium-term upswings.
The sharp rallies in 2008 and 2014 were of much larger magnitudes. And in those historical analogies, the USD Index continued its surge for some time without suffering any material corrections.
As a result, the short-term outlook is more of a coin flip. However, the medium-term outlook remains profoundly bullish, and gold, silver, and mining stocks may resent the USD Index’s forthcoming uprising.
Just as the USD Index took a breather before its massive rally in 2014, it seems that we saw the same recently. This means that predicting higher gold prices (or the ones of silver) here is likely not a good idea.
Continuing the theme, the eye in the sky doesn’t lie. And with the USDX’s long-term breakout clearly visible, the wind remains at the dollar’s back. Furthermore, dollar bears often miss the forest through the trees: with the USD Index’s long-term breakout gaining steam, the implications of the chart below are profound. And while very few analysts cite the material impact (when was the last time you saw the USDX chart starting in 1985 anywhere else?), the USD Index has been sending bullish signals for years.
Please see below:
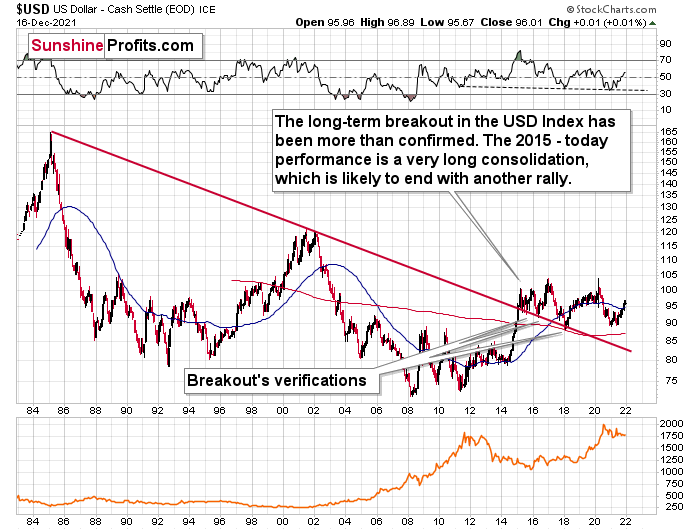
The bottom line?
With my initial 2021 target of 94.5 already hit, the ~98 target is likely to be reached over the medium term (and perhaps quite soon), mind, though: we’re not bullish on the greenback because of the U.S.’ absolute outperformance. It’s because the region is fundamentally outperforming the Eurozone, the EUR/USD accounts for nearly 58% of the movement of the USD Index, and the relative performance is what really matters.
In conclusion, gold, silver and mining stocks pulled rabbits out of their hats on Dec. 16. However, as 2021 has demonstrated, their daily tricks often lose their allure fairly quickly. Moreover, while it’s uncommon for magicians to reveal their secrets, the precious metals tip their hands time and time again. As a result, the USD Index’s daily weakness was likely a corrective downswing, while the precious metals daily strength was likely a corrective upswing. And with a reversal of fortunes likely to occur over the medium term, gold, silver and mining stocks may lose their magic touch.
Thank you for reading our free analysis today. Please note that the above is just a small fraction of the full analyses that our subscribers enjoy on a regular basis. They include multiple premium details such as the interim targets for gold and mining stocks that could be reached in the next few weeks. We invite you to subscribe now and read today’s issue right away.
Sincerely,
Przemyslaw Radomski, CFA
Founder, Editor-in-chief -
Gold Buys the Hawkish Fact and… Rallies
December 16, 2021, 8:58 AMYesterday’s price action was mostly about the Fed’s decision to accelerate tapering and much more hawkish narrative in general, so let’s start today’s analysis with a look at the fundamentals.
Tightening the Screws
While stock market investors orchestrated a ‘sell the rumor, buy the news’ reversal on Dec. 15, the PMs weren’t so lucky. Despite a late-afternoon surge by the S&P 500, gold, silver and mining stocks all ended the day in the red. Moreover, the weakness occurred even as the USD Index declined.
But what helped cause the profound underperformance?
Well, for starters, the Fed fired a hawkish bazooka on Dec. 15. To explain, the FOMC announced that it will increase the pace of its taper from $15 billion per month to $30 billion per month. An excerpt from its monetary policy statement read:
“In light of inflation developments and the further improvement in the labor market, the Committee decided to reduce the monthly pace of its net asset purchases by $20 billion for Treasury securities and $10 billion for agency mortgage-backed securities.”
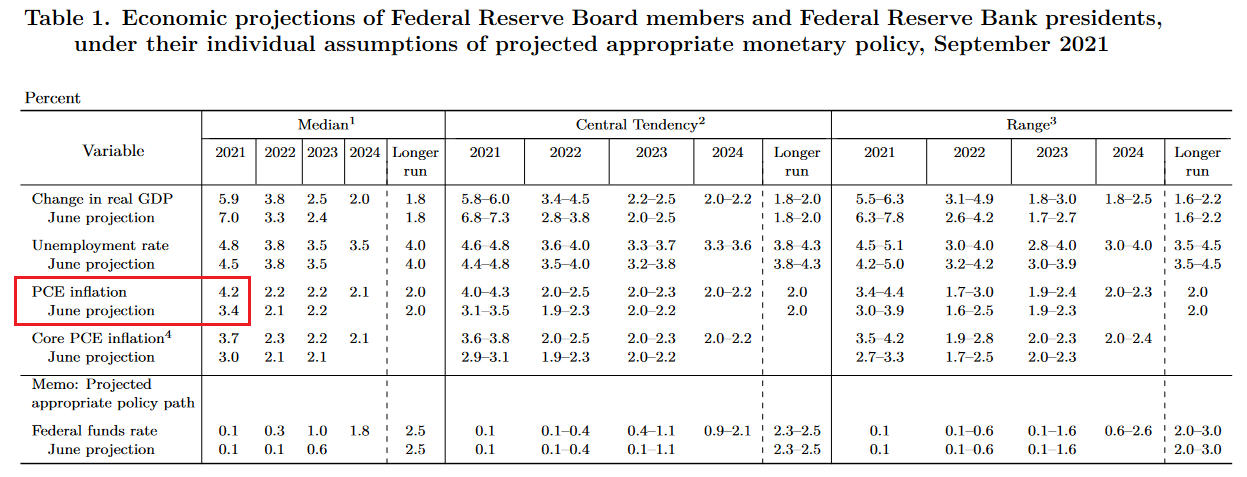
Moreover, the hawkish crusade didn’t end there. However, to know where we’re going, it’s essential to know where we’ve been. For context, I wrote on Sept. 23:
While I’ve been warning for months that Powell remains materially behind the inflation curve, the FOMC increased its 2021 PCE Index projection from 3.4% YoY to 4.2% YoY and increased its 2022 projection by 10 basis points (0.10%) on Sep. 22. For context, the committee also reduced its 2021 real GDP growth forecast and increased its 2021 U.S. unemployment rate forecast (stagflation anyone?).
Please see below:
 Source: U.S. Fed
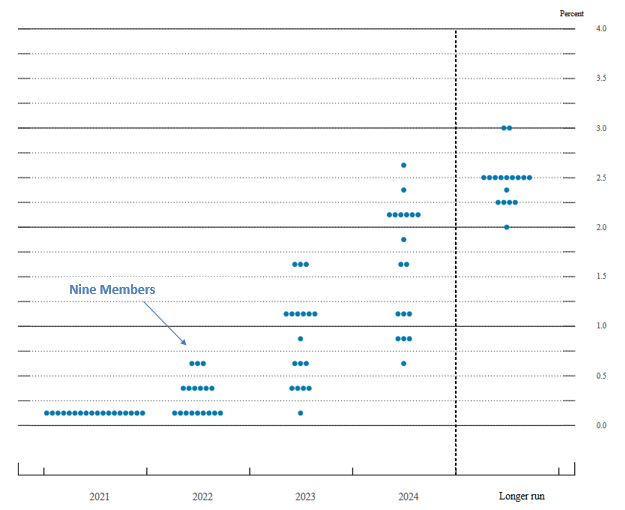
What’s more, the FOMC’s September ‘dot plot’ has nine FOMC participants signaling at least one rate hike in 2022 and 17 FOMC participants signaling at least one rate hike in 2023.
Please see below:
 Source: U.S. Fed
To explain, the vertical scale on the right side of the chart represents the U.S. federal funds rate and the blue dots depict Fed officials’ projections for the rate and when they will likely materialize. If you analyze the arrow near the left side of the chart, you can see that nine members expect the U.S. federal funds rate to range between roughly 0.25% and 0.75% in 2022. In addition, 17 Fed officials expect the U.S. federal funds rate to range between roughly 0.25% and 1.75% in 2023. Thus, surging inflation has the FOMC increasingly hawked up.
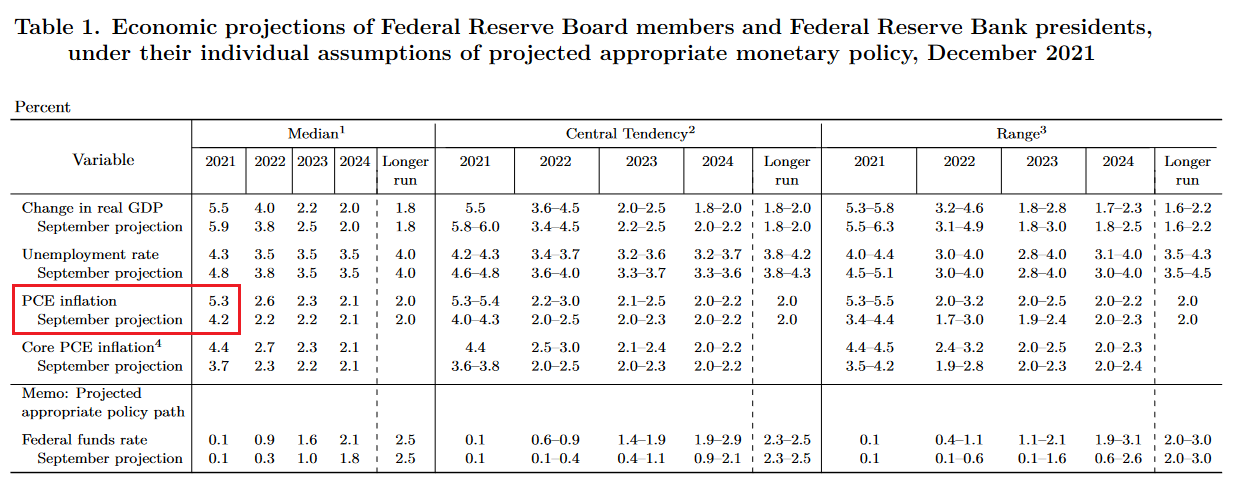
And now, with the FOMC releasing its latest Summary of Economic Projections on Dec. 15, officials’ 2021 PCE Index estimate has increased from 4.2% YoY to 5.3% YoY and its 2022 estimate has increased by 40 basis points (0.40%).
Please see below:
 Source: U.S. Fed
However, the crucial development was the hawkish change in the FOMC’s dot plot. With all 18 members now expecting at least one rate hike in 2022, the median forecast (10 dots = 10 members) is for three rate hikes in 2022.
Please see below:
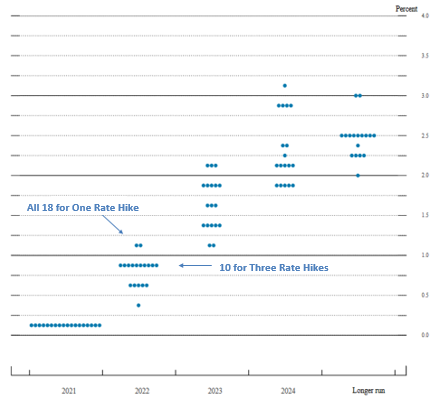 Source: U.S. Fed
On top of that, when Chairman Jerome Powell was asked if he postponed his “hawkish policy stance” until after he was reappointed for a second term, he responded:
“We got the labor market report two days after the [November] meeting, and then one week after that, we got the CPI reading.… I just came to the view over that weekend that we needed to speed up the taper and we started working on that. That’s a full 10 days or so before the president made a decision to re-nominate me. So, honestly, it had nothing to do with that at all.”
However, as one of the most important quotes of the press conference, he admitted:
“My colleagues were out talking about a faster taper and that doesn’t happen by accident. They were out talking about a faster taper before the president made his decision. So, it’s a decision that effectively was more than entrained.”
And while Powell sounded a little rattled during the exchange, his slip highlights the importance of Fed officials’ hawkish rhetoric. Essentially, when Clarida, Waller, Bostic, Bullard, etc., are making the hawkish rounds, “that doesn’t happen by accident.” As such, it’s an admission that his understudies serve as messengers for pre-determined policy decisions.
Also noteworthy, Powell admitted that inflationary risks have increased and that the jump in the 2022 PCE Index projection was a “pretty significant move up.” He said:
“There is a real risk now that inflation may be more persistent and that may be putting inflation expectations under pressure, and that the risk of higher inflation becoming entrenched has increased. It’s certainly increased. I don’t think it’s high at this moment. But I think it’s increased and I think that’s part of the reason behind our move today.”
More importantly, though, with boiling inflation colliding with a lukewarm labor market, Powell said that “one of the two big threats to getting back to maximum employment is actually high inflation.”
As a result, the narrative has been flipped upside down. Before, dovish policy was required to help uplift the consumer and heal the U.S. economy. Now, with consumer confidence near a 10-year low, hawkish policy is required to help uplift the consumer and heal the U.S. economy.
Thus, the PMs remain in no man’s land. For context, I warned on Nov. 11 that the Fed would spoil the PMs’ party. And with the GDXJ ETF now approaching its 2021 lows, investors have come around to our way of thinking. I wrote:
With inflation surging, markets rattled, The White House rattled and precious metals investors assuming that policymakers will do nothing (even as their anxiety accelerates), the calculus boils down to one fundamental question: do you believe the U.S. dollar or do you believe the PMs?
Please see below:
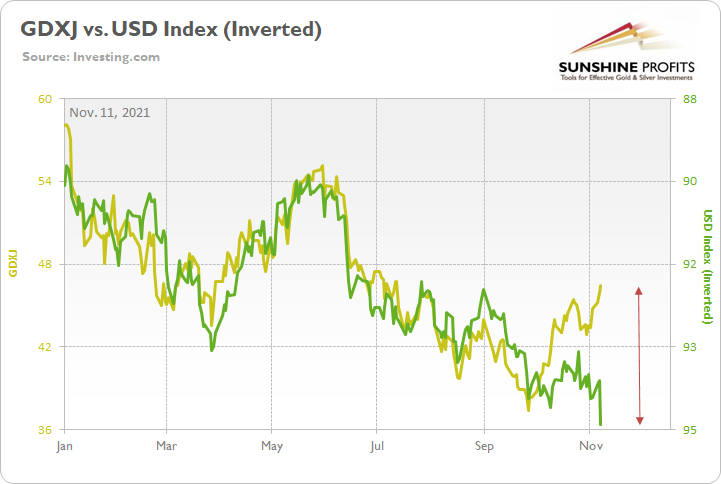
To explain, the gold line above tracks the GDXJ ETF (our short position) in 2021, while the green line above tracks the inverted (scale flipped upside down) USD Index. If you analyze the relationship, you can see that when the USD Index rises (the green line falls), the GDXJ ETF often heads in the opposite direction.
However, with the U.S. dollar betting that the Fed will tighten and the junior miners betting that it won’t, we expect the former to win out over the medium term.
The bottom line? When the Fed drops the hawkish hammer, it shakes the PMs’ fundamental foundation. For example, surging inflation led to an upgrade of the FOMC’s PCE Index projection. Then, it led to a taper announcement being pulled forward by several months. Now, it’s led to an accelerated taper and has the majority of FOMC officials signaling three rate hikes in 2022.
And keep in mind: the accelerated taper will have little effect on inflation in the near term. In reality, the liquidity deceleration will take months to filter through the real economy. As a result, more hot CPI prints will likely hit the wire in the coming months and don’t be surprised if Fed officials ramp up the hawkish rhetoric in 2022. Because, as Powell admitted, “that doesn’t happen by accident.”
In conclusion, the PMs declined on Dec. 15, and silver was the daily underperformer. And while the USD Index declined as well, ‘selling the news’ is a game that day traders like to play. Despite that, though, the greenback’s fundamentals are stronger now than at any other point in 2021. And with the FOMC poised to up the hawkish ante over the medium term, a stronger U.S. dollar and rising real interest rates will likely chip away at the PMs’ prices over the next few months.
On the Technical Front
The question is if it was only the USD Index that got ahead of itself in a buy-the-rumor-sell-the-fact manner, or does the same apply to the precious metals market as well.
In my opinion, gold, silver, and miners were affected too, and we have already seen a small corrective upswing. I know that some of you have already taken profits from your short positions in the precious metals sector, but the question remains: what’s next? Are short positions still justified, or not?
Before replying to these questions, let’s take a look at the USD Index.
In short, yesterday’s intraday breakout above the triangle pattern was invalidated and since invalidations are bearish signals, it’s no wonder that it was followed by lower USDX values.
The immediate-term momentum in the USDX is down. But the late-November lows or the red support line that’s very close to them is likely to stop the decline.
Why? Because that’s the closest relatively strong short-term support level. It’s also possible that the USDX would bottom higher. I don’t think that the USD Index would be likely to fall much lower, as the fundamental situation is still bullish for the USDX (there are more monetary hawks in the U.S. then they are in the Eurozone and Japan), and the medium-term trend remains up.
Given how far the USD Index declined from its very recent high, the above means that the USD Index would be likely to decline by not more than it had already declined recently.
Let’s see how gold and mining stocks reacted.
Well, gold moved visibly higher from the recent lows, but:
- It hasn’t invalidated its previous breakdown below the rising red support line
- Even if the size of the very recent rally doubled, gold would not move up that significantly – perhaps to $1,815 or so.
There’s also a risk that gold might rally more visibly because of the similarity to what happened earlier this year. I marked both cases with blue rectangles. After making a second lower bottom, gold rallied and most of the upswing happened in July 2020.
But does the same fate (a visible counter-trend rally) await silver and mining stocks (in particular: junior mining stocks)? It’s not necessarily the case, because while – at the moment of writing these words – gold is already back to its previous December highs, silver is not, and the GDXJ ETF (proxy for junior mining stocks) is has corrected (based on its London trading) mere 23.6% of the December decline. But I’ll save those details for my subscribers – you will find them in the full version of today’s analysis.
Thank you for reading our free analysis today. Please note that the above is just a small fraction of the full analyses that our subscribers enjoy on a regular basis. They include multiple premium details such as the interim targets for gold and mining stocks that could be reached in the next few weeks. We invite you to subscribe now and read today’s issue right away.
Sincerely,
Przemyslaw Radomski, CFA
Founder, Editor-in-chief -
Apocalypse Day Coming? Gold’s Fate Rests in the Fed’s Hands
December 15, 2021, 8:58 AMThe Fed’s dovish period is likely to be over today. Does this mean a total catastrophe for gold and other precious metals? We’ll find out soon.
Today is the day when the Fed decides and speaks. It’s also the day when the markets are likely to react. Since some market participants will presumably be surprised by whatever is said and done, reactions might be volatile.
However, the markets appear to be already indicating where they want to move. In particular, the USD Index. Let’s start by quoting what I wrote about USD’s 4-hour chart yesterday:
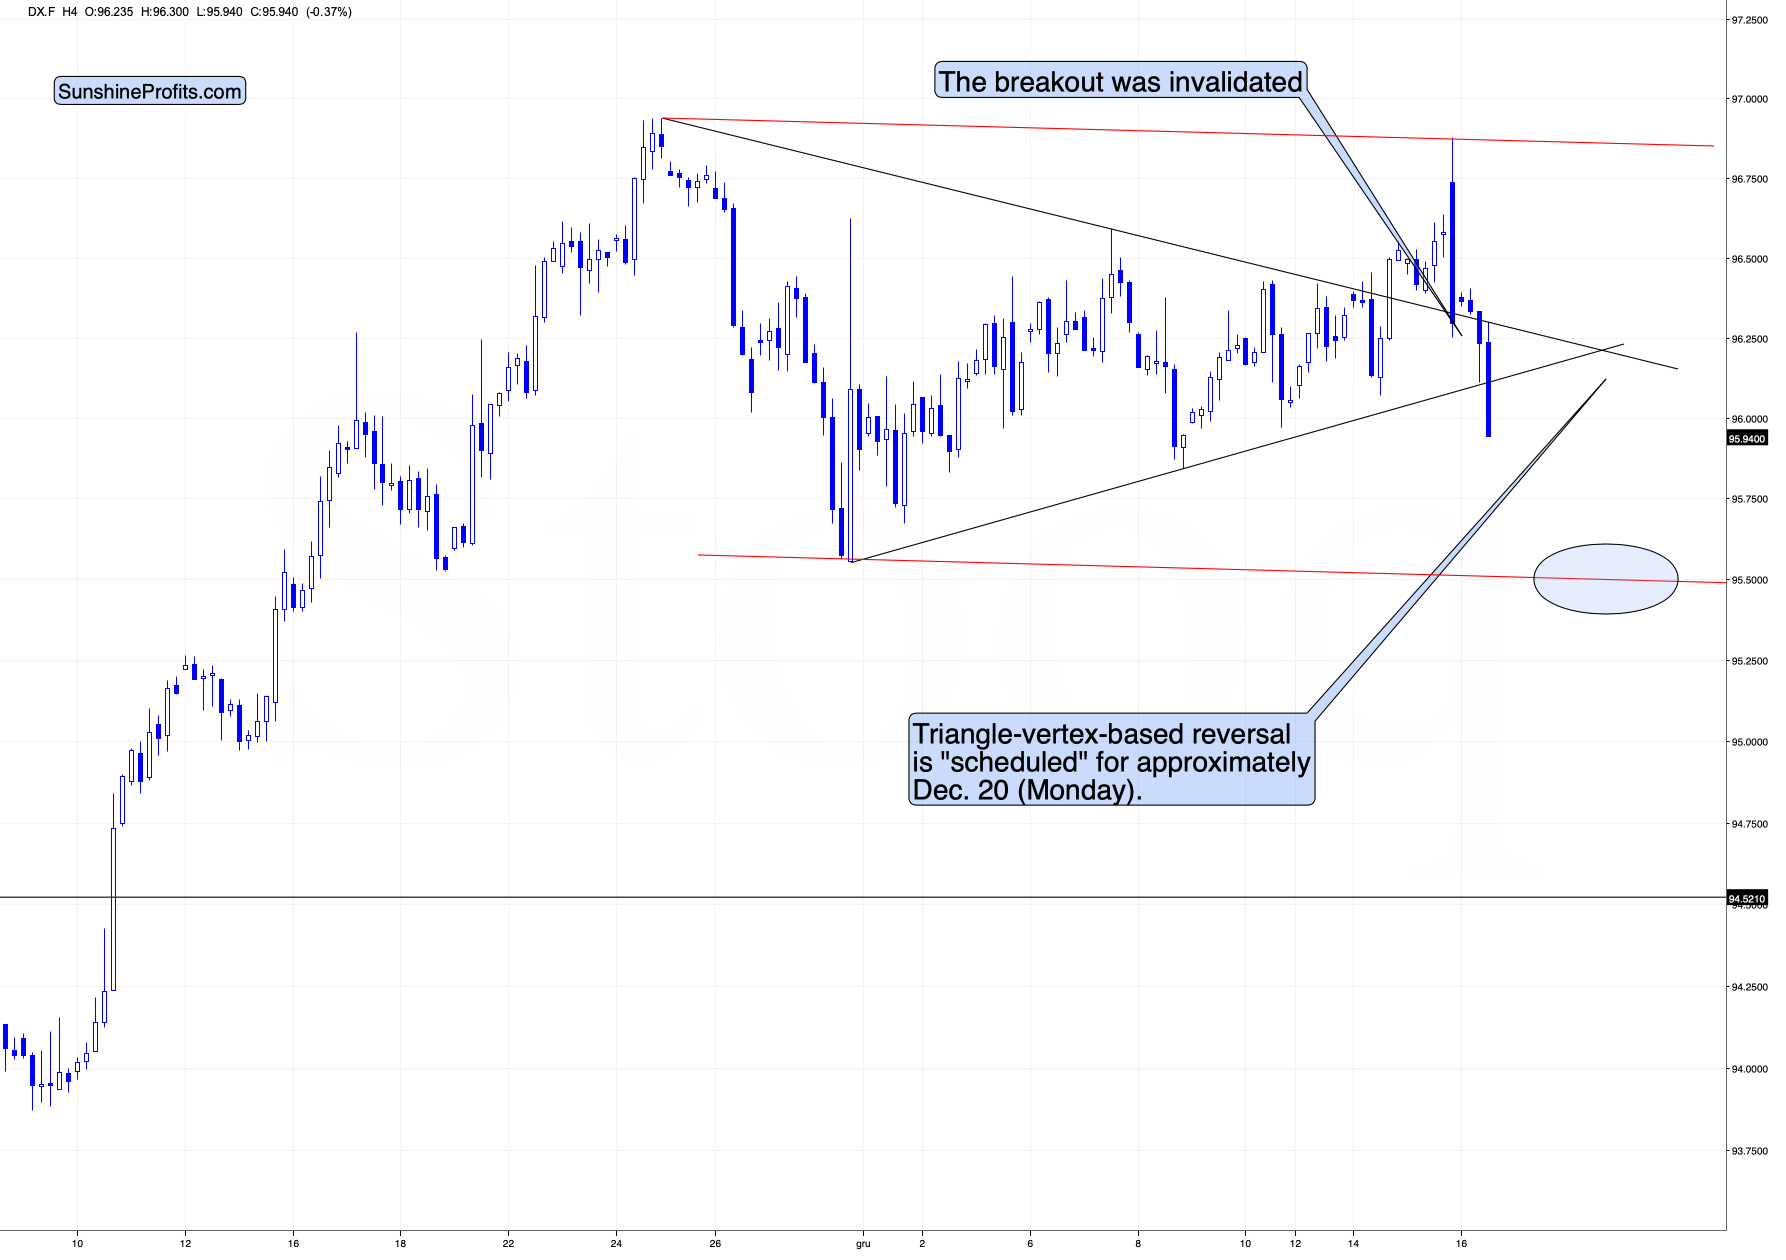
In short, the USD Index has been consolidating in one of the most classic ways possible. Namely, it formed a triangle. Triangles are generally “continuation patterns,” which suggests that the USDX is likely to break to the upside and rally.
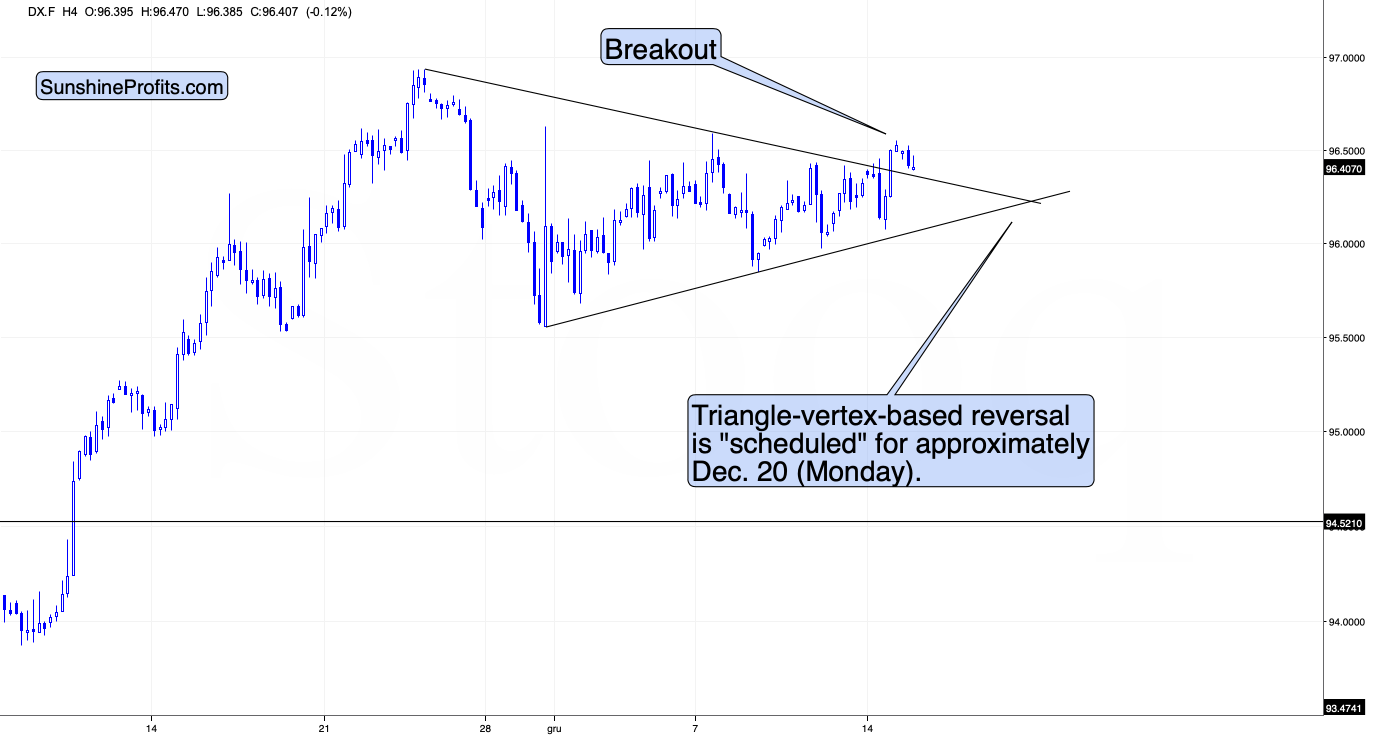
Taking a closer look at the triangle, we see that earlier today, the USD Index tried to move above it, but so far it was not successful. The move higher was really small, so I don’t view it as a major invalidation.
Still, I wouldn’t be surprised to see the USD Index continue its back-and-forth trading within the triangle until we get some news from the Fed. In other words, we’re likely to see some major price action tomorrow.
The above, plus the fact that gold has been consolidating below its rising support line, suggests that the next move in the USDX is going to be to the upside, while gold is going to decline.
Still, let’s keep in mind that it’s also possible that we see a fake move lower (USDX) and higher in gold right before or right after the FOMC. That kind of volatility around important news announcements is relatively normal. Whatever happens initially, please don’t take it at its face value. It might or might not be the market’s true reaction, especially if silver rallies much more than gold.
The trends support higher USDX values in the near and medium-term, and lower gold prices in the near and medium-term.
After I wrote the above, the USD Index moved lower, but then, at its next attempt, it managed to rally above the upper border of the triangle, and it’s now verifying the breakout. In short, this is bullish, and the short-term outlook for the USD Index improved based on that.
Again, we might see huge volatility in either direction today, but based on what we saw, the short-term outlook for the USDX is more bullish. It’s also more bearish for the precious metals sector.
In other news, based on yesterday’s price moves, the GDX ETF and the GDXJ ETF both closed at new monthly lows.
After they decline some more, they will break below their head and shoulders patterns (I marked the neck levels with red, solid lines). Those patterns will open doors to declines even below my previous interim bottoming targets. The implications, of course, are bearish.
Gold didn’t decline below its previous December lows, but it’s now crystal-clear that the breakdown below its rising support line has been more than confirmed. Consequently, the next move is likely to be to the downside, even though we might (!) see a very quick rally after the news hits the markets later today.
Thank you for reading our free analysis today. Please note that the above is just a small fraction of the full analyses that our subscribers enjoy on a regular basis. They include multiple premium details such as the interim targets for gold and mining stocks that could be reached in the next few weeks. We invite you to subscribe now and read today’s issue right away.
Sincerely,
Przemyslaw Radomski, CFA
Founder, Editor-in-chief


Gold Investment News
Delivered To Your Inbox
Free Of Charge
Bonus: A week of free access to Gold & Silver StockPickers.
Gold Alerts
More-
Status
New 2024 Lows in Miners, New Highs in The USD Index
January 17, 2024, 12:19 PM -
Status
Soaring USD is SO Unsurprising – And SO Full of Implications
January 16, 2024, 8:40 AM -
Status
Rare Opportunity in Rare Earth Minerals?
January 15, 2024, 2:06 PM

