

Briefly: in our opinion, full (300% of the regular position size) speculative short positions in junior mining stocks are justified from the risk/reward point of view at the moment of publishing this Alert.
Gold rallied yesterday, and so did miners, but… just for a while. With miners lagging, we all know what will happen next: the PMs are about to slide.
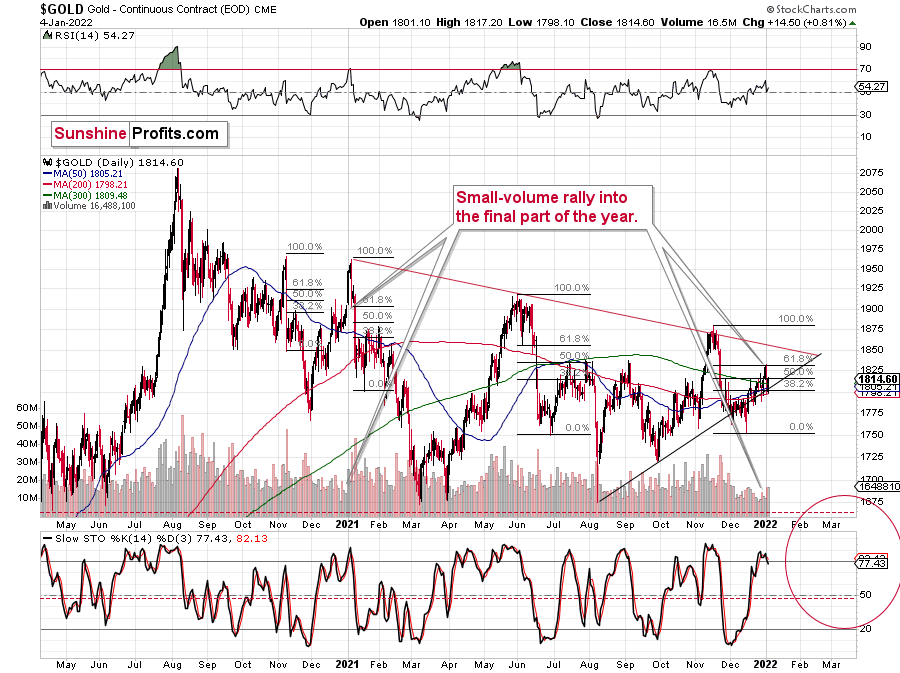
After a sharp decline, gold corrected about half of the previous day’s decline. This doesn’t change the fact that, so far, 2022 has been a down year for gold.
The visible sell signal from the stochastic indicator (lower part of the above chart) suggests that the decline has only begun. The last couple of times we saw this kind of sell signal in such a decisive manner was at the November, September, July, and June tops. In all the above-mentioned cases, significant declines followed. Is this time any different? This seems unlikely.
This is especially the case given how gold miners and silver reacted.
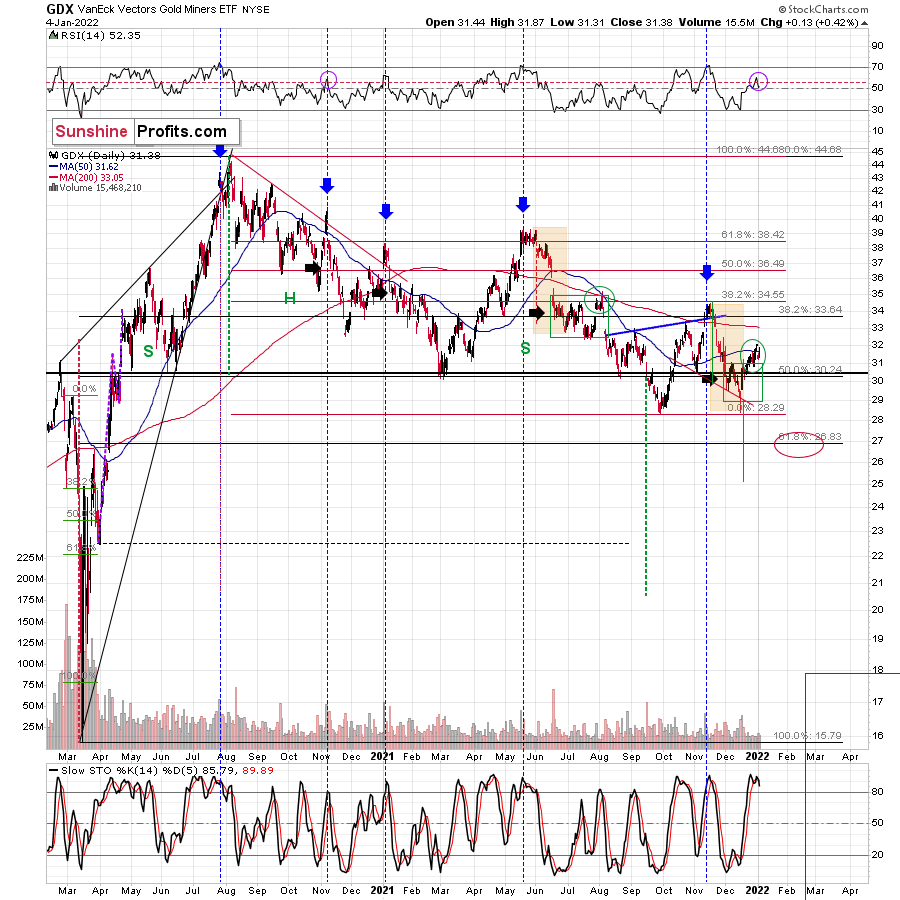
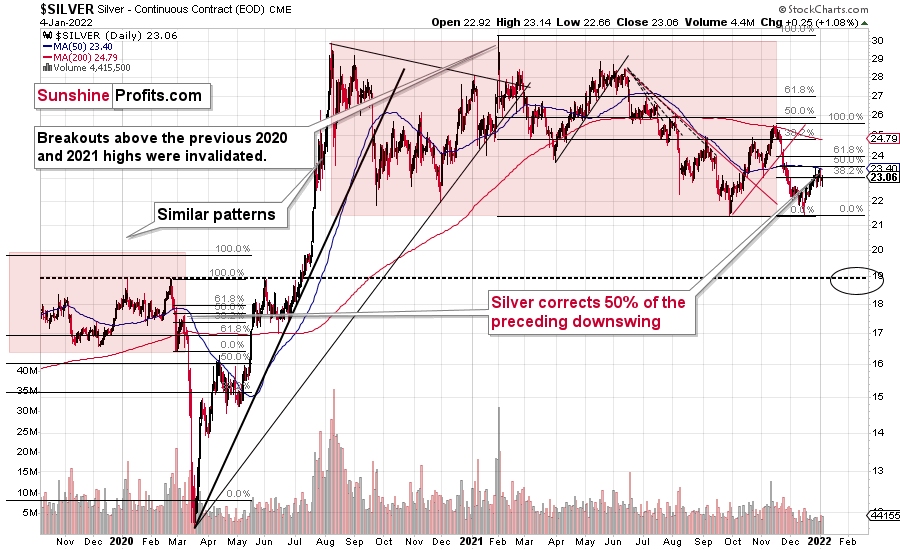
Gold miners erased a large part of their intraday gains before the closing bell, and the GDX ETF ended the day only 0.42% higher. For comparison, gold was up by 0.81% – about twice as much. Silver was up by 1.08%, so silver just outperformed gold on a very short-term basis, while gold stocks underperformed on a very short-term basis.
That’s what tends to happen at / around local tops.
Moving back to the GDX ETF chart, please note that the sell signal from the stochastic indicator is also visible there. Just like in the case of gold, this has been a very bearish omen for many months.
Consequently, very little changed yesterday and in today’s pre-market trading (gold is up by $5 so far – at the moment of writing these words), and the bearish outlook for the medium term remains bearish.
Having said that, let’s take a look at the markets from a more fundamental angle.
You Can Run but You Can’t Hide
While the PMs put on brave faces amid the recent surge in the U.S. 10-Year Treasury yield, their fundamental outlooks continue to deteriorate. To explain, while the Delta variant increased investors’ economic anxiety in August and September, I warned on Sep. 24 that the path to higher interest rates was still intact.
I wrote:
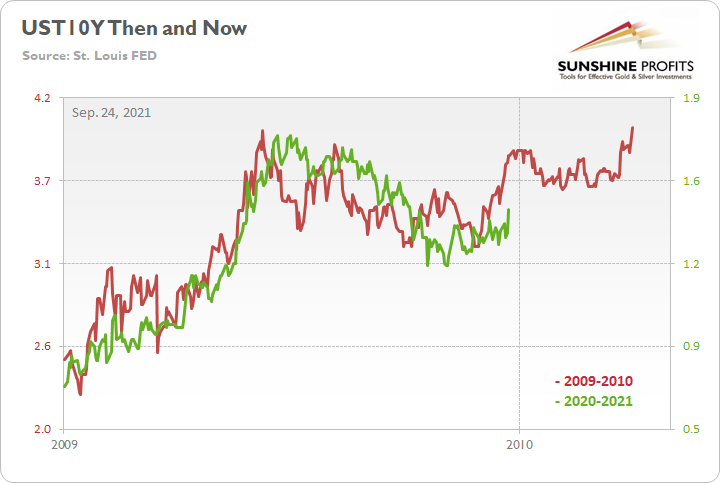
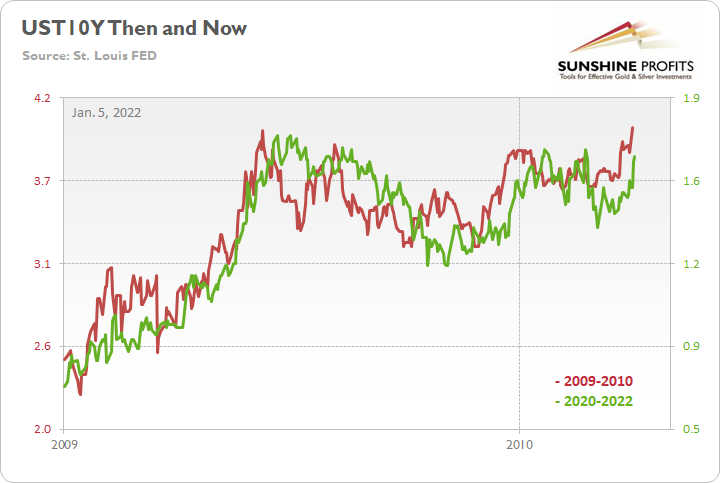
To explain, the red line above tracks the U.S. 10-Year Treasury yield’s rally off of the bottom in 2009-2010, while the green line above tracks the U.S. 10-Year Treasury yield’s current move. If you analyze the fits and starts, you can see that excessive optimism often gives way to excessive pessimism. However, after the dust settled in 2009, the U.S. 10-Year Treasury yield continued its uptrend and ultimately made a new high.
For context, the yield fell off a cliff in April 2010 before another sharp rally ensued in October 2010 (which recouped most of the losses). However, the important point is that the second cliff arrived roughly four months after the U.S. 10-Year Treasury yield recorded its second bottom. As a result, with the pace of the current economic recovery tracking well ahead of 2009, it will likely take a Black Swan event to keep the U.S. 10-Year Treasury yield from following a similar script.
To that point, while the Omicron variant helped delay the fireworks, the U.S. 10-Year Treasury yield is poised to complete its mission. With the Treasury benchmark ending the Jan. 4 session at 1.66%, more upside will likely materialize over the medium term.
Furthermore, while I warned throughout 2021 that higher U.S. Treasury yields would stifle the PMs' upward momentum, their 'flash crashes' often occur with a delay. For example, the PMs can ignore rising interest rates for a few days or a week. However, once fundamental pressure becomes too much to bear, the PMs often suffer sharp daily sell-offs that wipe out days or weeks of gains. As a result, don't be surprised if another one materializes once Omicron fears fade.
Furthermore, while the PMs have enjoyed Fed speakers' holiday quiet period, the fundamentals remain unchanged: the Fed is hawked up, and simmering inflation should result in higher interest rates in the coming months.
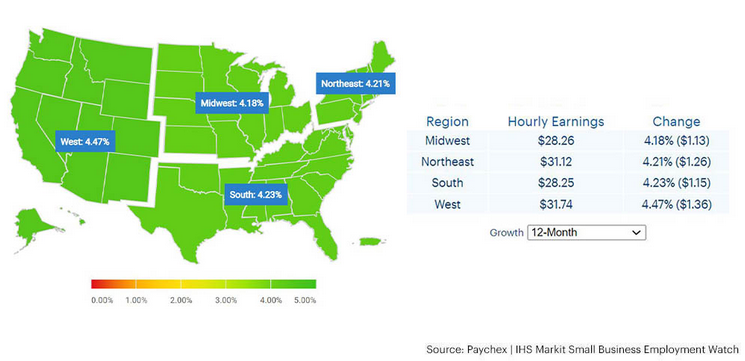
As evidence, Paychex and IHS Markit released their Small Business Employment Watch report on Jan. 4. After analyzing 350,000 small businesses with less than 50 employees, they revealed that "the December data shows hourly earnings growth improved to 4.27 percent, the highest level since reporting began ten years ago."
In addition, the Small Business Jobs Index increased to 100.94 in December, its highest level since August 2014. As a result, the U.S. labor market continues to strengthen, and the Fed is unlikely to reverse its hawkish policy plans anytime soon.
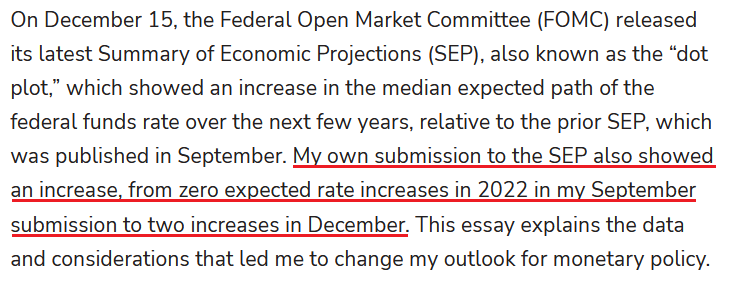
 To that point, Minneapolis Fed President Neel Kashkari – who is by far the most dovish Fed member of them all – wrote on Jan. 4: “while my baseline forecast remains that the high inflation consumers and businesses are currently experiencing will likely be transitory, I am putting more weight on the possibility that such transitory high inflation could nonetheless lead to an increase in long-term inflation expectations above our 2 percent target.”
As a result:
 Source: Minneapolis Fed
Thus, while the PMs didn’t notice, the man who preached the most monetary patience in 2021 now expects two rate hikes in 2022. As such, Kashkari’s material about-face highlights the inflationary anxiety within the Fed.
Continuing the theme, IHS Markit released its U.S. composite PMI on Jan. 3. While the headline index declined from 57.2 in November to 56.9 in December, U.S. economic output ended 2021 on a relatively high note. The report revealed:
“Supporting the upturn in activity was a quicker increase in new orders during December. The pace of expansion was the sharpest for five months, and largely driven by a faster rise in service sector new business. New order inflows to the manufacturing sector eased to the slowest since October 2020, however. Meanwhile, new export orders increased at the strongest pace since September.”
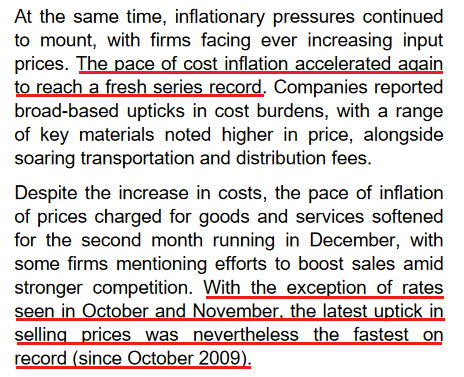
More importantly, though, inflationary pressures still remain:
 Source: IHS Markit
Likewise, the Institute for Supply Management (ISM) released its U.S. Manufacturing PMI on Jan. 4. While its Prices Index decreased from 82.4 in November to 68.2 in December, the report revealed that “raw materials prices increased for the 19th consecutive month, at a slower rate in December. This is the 16th month in a row that the index has been above 60.”
In addition, the ISM’s Employment Index “reported a fourth consecutive month of expansion” and that “an overwhelming majority of panelists indicate their companies are hiring or attempting to hire, as 85 percent of Employment Index comments were hiring focused.”
As a result, while it may seem like the PMs have a bullish bid under them, their fundamental prospects are fading. With the stars aligning for aggressive Fed policy in 2022, ignoring these realities will likely upend overzealous investors over the medium term.
For example, with inflation still rising – at a slower pace, though – it’s drifting further away from the Fed’s 2% annual target. Second, with the U.S. labor market, the main deterrent to an earlier tightening cycle, near-record job openings and strong hiring sentiment eliminate that concern.
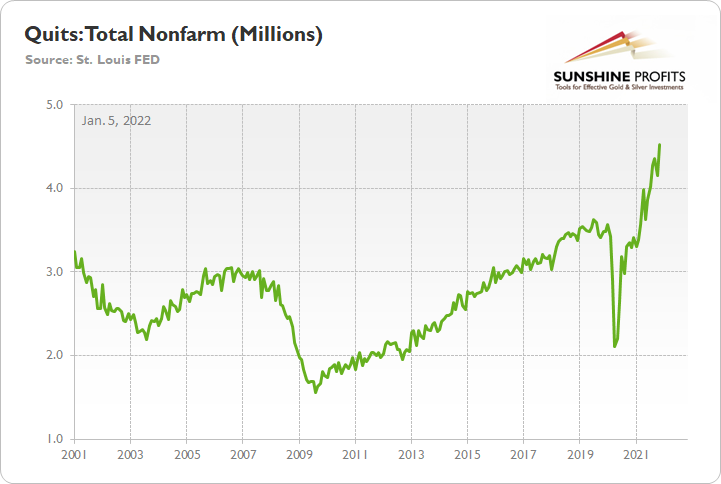
As evidence, the U.S. Bureau of Labor Statistics (BLS) released its Job Openings and Labor Turnover Survey (JOLTS) on Jan. 4. With more than 4.5 million Americans quitting their jobs in November – an all-time high – does it seem like they’re worried about their employment prospects?
Finally, while the U.S. 10-Year Treasury yield hovers roughly 10 basis points from its 2021 high (~1.75%), pandemic progress should elicit a move back toward 2%. Likewise, with higher long-term yields as the key to calming inflation, we’ll likely witness more upward pressure in the coming months.
“You only reduce inflationary pressure by slowing aggregate demand and that requires higher long-term rates,” David Kelly, chief global strategist at JPMorgan Asset Management, told Bloomberg on Jan. 4. “There will be no impact on curbing inflation if long-term rates are not pushed up. The Fed is quite capable of pushing up long-term rates if it decides to reduce the size of its balance sheet along with higher overnight rates.”
The bottom line? Investors have gotten so used to a dovish Fed that they assume Chairman Jerome Powell won’t follow through and raise interest rates. However, with rampant inflation, a hot labor market, and a resilient U.S. economy still in play, the PMs may find out the hard way that the Fed isn’t bluffing. As a result, their superficial strength will likely fade, and their price action on Jan. 4 mirrors the tepid confidence they displayed throughout 2021.
In conclusion, the PMs rallied on Jan. 4, though, nothing fundamental supported the moves. While 2021 was filled with defiant rallies that ultimately ended in disappointment, 2022 is shaping up like more of the same. Moreover, with the USD Index and the U.S. 10-Year Treasury yield rising in unison on Jan. 4, the two-headed monster is extremely bearish for the PMs. As a result, more downside will likely materialize over the medium term.
Overview of the Upcoming Part of the Decline
- It seems to me that while the corrective upswing might still continue, it might not be significant in case of junior mining stocks. After the corrective upswing is over, I think that gold will decline once again taking silver and mining stocks lower as well.
- It seems that the first stop for gold will be close to its previous 2021 lows, slightly below $1,700. Then it will likely correct a bit, but it’s unclear if I want to exit or reverse the current short position based on that – it depends on the number and the nature of the bullish indications that we get at that time.
- After the above-mentioned correction, we’re likely to see a powerful slide, perhaps close to the 2020 low ($1,450 - $1,500).
- If we see a situation where miners slide in a meaningful and volatile way while silver doesn’t (it just declines moderately), I plan to – once again – switch from short positions in miners to short positions in silver. At this time, it’s too early to say at what price levels this could take place, and if we get this kind of opportunity at all – perhaps with gold close to $1,600.
- I plan to exit all remaining short positions once gold shows substantial strength relative to the USD Index while the latter is still rallying. This may be the case with gold close to $1,350 - $1,400. I expect silver to fall the hardest in the final part of the move. This moment (when gold performs very strongly against the rallying USD and miners are strong relative to gold after its substantial decline) is likely to be the best entry point for long-term investments, in my view. This can also happen with gold close to $1,375, but at the moment it’s too early to say with certainty.
- As a confirmation for the above, I will use the (upcoming or perhaps we have already seen it?) top in the general stock market as the starting point for the three-month countdown. The reason is that after the 1929 top, gold miners declined for about three months after the general stock market started to slide. We also saw some confirmations of this theory based on the analogy to 2008. All in all, the precious metals sector is likely to bottom about three months after the general stock market tops.
- The above is based on the information available today, and it might change in the following days/weeks.
You will find my general overview of the outlook for gold on the chart below:
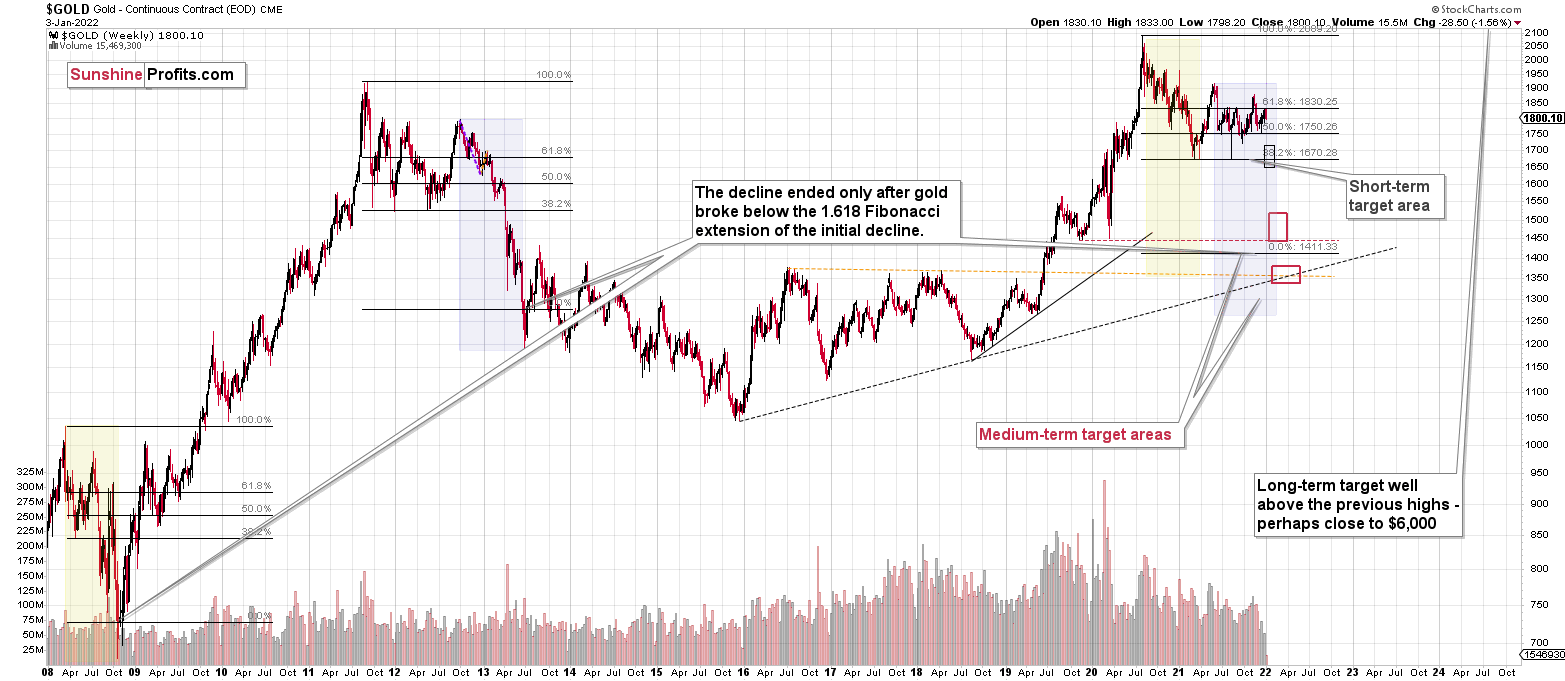
Please note that the above timing details are relatively broad and “for general overview only” – so that you know more or less what I think and how volatile I think the moves are likely to be – on an approximate basis. These time targets are not binding or clear enough for me to think that they should be used for purchasing options, warrants or similar instruments.
Summary
Summing up, it seems to me that while the corrective upswing might still continue, it might not be significant in the case of junior mining stocks. After the corrective upswing is over, I think that gold will decline once again, taking silver and mining stocks lower as well.
From the medium-term point of view, the key two long-term factors remain the analogy to 2013 in gold and the broad head and shoulders pattern in the HUI Index. They both suggest much lower prices ahead.
It seems that our profits from the short positions are going to become truly epic in the following months.
After the sell-off (that takes gold to about $1,350 - $1,500), I expect the precious metals to rally significantly. The final part of the decline might take as little as 1-5 weeks, so it's important to stay alert to any changes.
Most importantly, please stay healthy and safe. We made a lot of money last March and this March, and it seems that we’re about to make much more on the upcoming decline, but you have to be healthy to enjoy the results.
As always, we'll keep you - our subscribers - informed.
To summarize:
Trading capital (supplementary part of the portfolio; our opinion): Full speculative short positions (300% of the full position) in junior mining stocks are justified from the risk to reward point of view with the following binding exit profit-take price levels:
Mining stocks (price levels for the GDXJ ETF): binding profit-take exit price: $35.73; stop-loss: none (the volatility is too big to justify a stop-loss order in case of this particular trade)
Alternatively, if one seeks leverage, we’re providing the binding profit-take levels for the JDST (2x leveraged) and GDXD (3x leveraged – which is not suggested for most traders/investors due to the significant leverage). The binding profit-take level for the JDST: $16.18; stop-loss for the JDST: none (the volatility is too big to justify a SL order in case of this particular trade); binding profit-take level for the GDXD: $32.08; stop-loss for the GDXD: none (the volatility is too big to justify a SL order in case of this particular trade).
For-your-information targets (our opinion; we continue to think that mining stocks are the preferred way of taking advantage of the upcoming price move, but if for whatever reason one wants / has to use silver or gold for this trade, we are providing the details anyway.):
Silver futures downside profit-take exit price: $19.12
SLV profit-take exit price: $17.72
ZSL profit-take exit price: $41.38
Gold futures downside profit-take exit price: $1,683
HGD.TO – alternative (Canadian) inverse 2x leveraged gold stocks ETF – the upside profit-take exit price: $12.48
HZD.TO – alternative (Canadian) inverse 2x leveraged silver ETF – the upside profit-take exit price: $30.48
Long-term capital (core part of the portfolio; our opinion): No positions (in other words: cash
Insurance capital (core part of the portfolio; our opinion): Full position
Whether you already subscribed or not, we encourage you to find out how to make the most of our alerts and read our replies to the most common alert-and-gold-trading-related-questions.
Please note that we describe the situation for the day that the alert is posted in the trading section. In other words, if we are writing about a speculative position, it means that it is up-to-date on the day it was posted. We are also featuring the initial target prices to decide whether keeping a position on a given day is in tune with your approach (some moves are too small for medium-term traders, and some might appear too big for day-traders).
Additionally, you might want to read why our stop-loss orders are usually relatively far from the current price.
Please note that a full position doesn't mean using all of the capital for a given trade. You will find details on our thoughts on gold portfolio structuring in the Key Insights section on our website.
As a reminder - "initial target price" means exactly that - an "initial" one. It's not a price level at which we suggest closing positions. If this becomes the case (like it did in the previous trade), we will refer to these levels as levels of exit orders (exactly as we've done previously). Stop-loss levels, however, are naturally not "initial", but something that, in our opinion, might be entered as an order.
Since it is impossible to synchronize target prices and stop-loss levels for all the ETFs and ETNs with the main markets that we provide these levels for (gold, silver and mining stocks - the GDX ETF), the stop-loss levels and target prices for other ETNs and ETF (among other: UGL, GLL, AGQ, ZSL, NUGT, DUST, JNUG, JDST) are provided as supplementary, and not as "final". This means that if a stop-loss or a target level is reached for any of the "additional instruments" (GLL for instance), but not for the "main instrument" (gold in this case), we will view positions in both gold and GLL as still open and the stop-loss for GLL would have to be moved lower. On the other hand, if gold moves to a stop-loss level but GLL doesn't, then we will view both positions (in gold and GLL) as closed. In other words, since it's not possible to be 100% certain that each related instrument moves to a given level when the underlying instrument does, we can't provide levels that would be binding. The levels that we do provide are our best estimate of the levels that will correspond to the levels in the underlying assets, but it will be the underlying assets that one will need to focus on regarding the signs pointing to closing a given position or keeping it open. We might adjust the levels in the "additional instruments" without adjusting the levels in the "main instruments", which will simply mean that we have improved our estimation of these levels, not that we changed our outlook on the markets. We are already working on a tool that would update these levels daily for the most popular ETFs, ETNs and individual mining stocks.
Our preferred ways to invest in and to trade gold along with the reasoning can be found in the how to buy gold section. Furthermore, our preferred ETFs and ETNs can be found in our Gold & Silver ETF Ranking.
As a reminder, Gold & Silver Trading Alerts are posted before or on each trading day (we usually post them before the opening bell, but we don't promise doing that each day). If there's anything urgent, we will send you an additional small alert before posting the main one.
Thank you.
Przemyslaw Radomski, CFA
Founder, Editor-in-chief

