

Briefly: in our opinion, full (300% of the regular position size) speculative short positions in junior mining stocks are justified from the risk/reward point of view at the moment of publishing this Alert.
Yesterday’s session ended pretty much in tune with what I wrote in yesterday’s analysis. The intraday moves were partially invalidated, but overall, silver finished the day higher, while gold – lower. Thus, my point about silver’s intraday outperformance remains intact, and so does the point about its bearish implications. Let’s take a closer look at it.
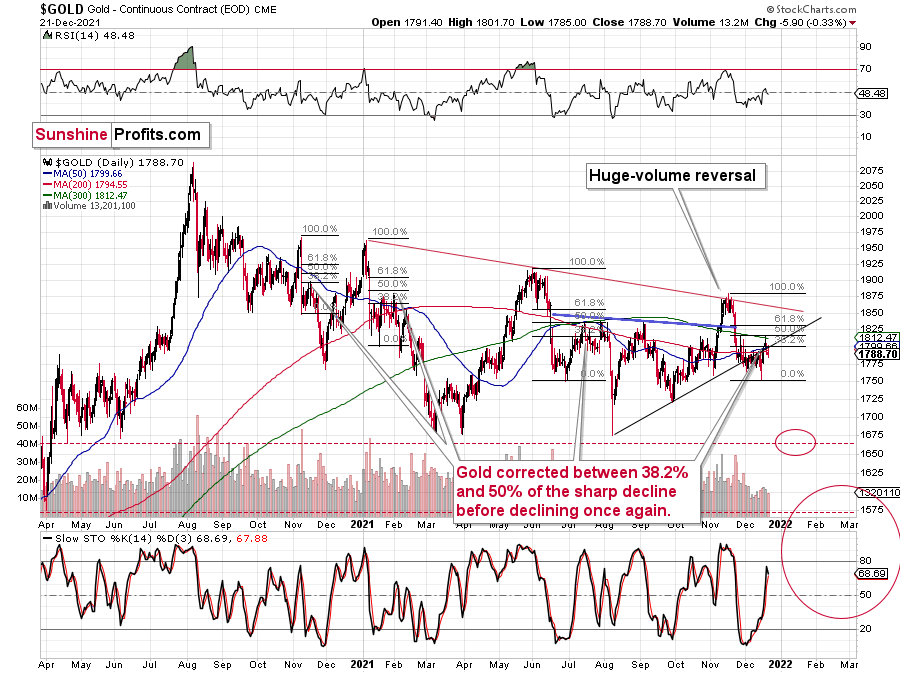
Gold ended the day about $6 lower and visibly below its rising resistance line. The implications continue to be very bearish, as the tiny attempt to break higher was invalidated, and gold corrected about 50% of the preceding decline, just like it did in mid-2021 and early-2021 before sliding once again.
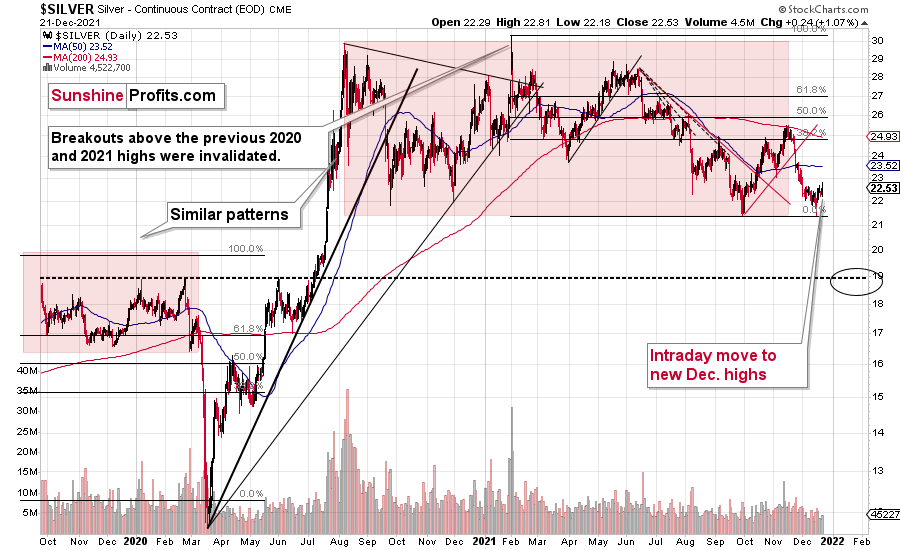
Silver ended the session higher after moving temporarily to new monthly highs. In other words, it outperformed gold on an immediate-term basis, and my yesterday’s comments on that remain up-to-date:
This is very interesting, because silver is showing strength and weakness at the same time. How is that possible – one might ask.
It’s the same as with trends or forecasts for silver. They can be bearish and bullish simultaneously, depending on the time frame that one focuses on. For example, I think that the very long-term outlook for silver is extremely bullish, but I also think that the medium-term trend is bearish. The short-term trend is also bearish, but the immediate-term trend is bullish. So, am I bullish or bearish on silver? Answering this without specifying the time frame is bound to create misunderstandings.
Getting back to silver’s relative performance, it’s been weak when taking into account the last couple of weeks – please note how little of the recent monthly decline silver has corrected compared to gold. Gold recently moved to its October highs, but silver topped a few dollars below its October high. What does it tell us? Silver is likely to fall hard, also compared to gold, probably in tune with the general stock market – similarly to what happened in 2008 and 2020. That’s the same kind of performance that we saw in the very early parts of the huge declines.
At the same time, silver is strong compared to gold on an immediate-term basis. This means that we’re likely at or close to a short-term top. Why? Because that’s what the precious metals market tends to do when it’s topping, and it’s one of the great gold trading tips to monitor the PM market for these situations. One could debate why this is really the case, and there are quite a few theories (the silver market is smaller, so more prone to sudden moves, etc.), but the point is that it simply works. Please note that some things – like the Pareto principle (a.k.a. the 20:80 rule) – can work and be very useful, even if it’s not clear why they work.
Consequently, it seems that the days of this short-term corrective upswing are either over or about to be over, and that the precious metals sector will return to its medium-term decline any day now.
“But what about mining stocks’ rally?” – one might ask.
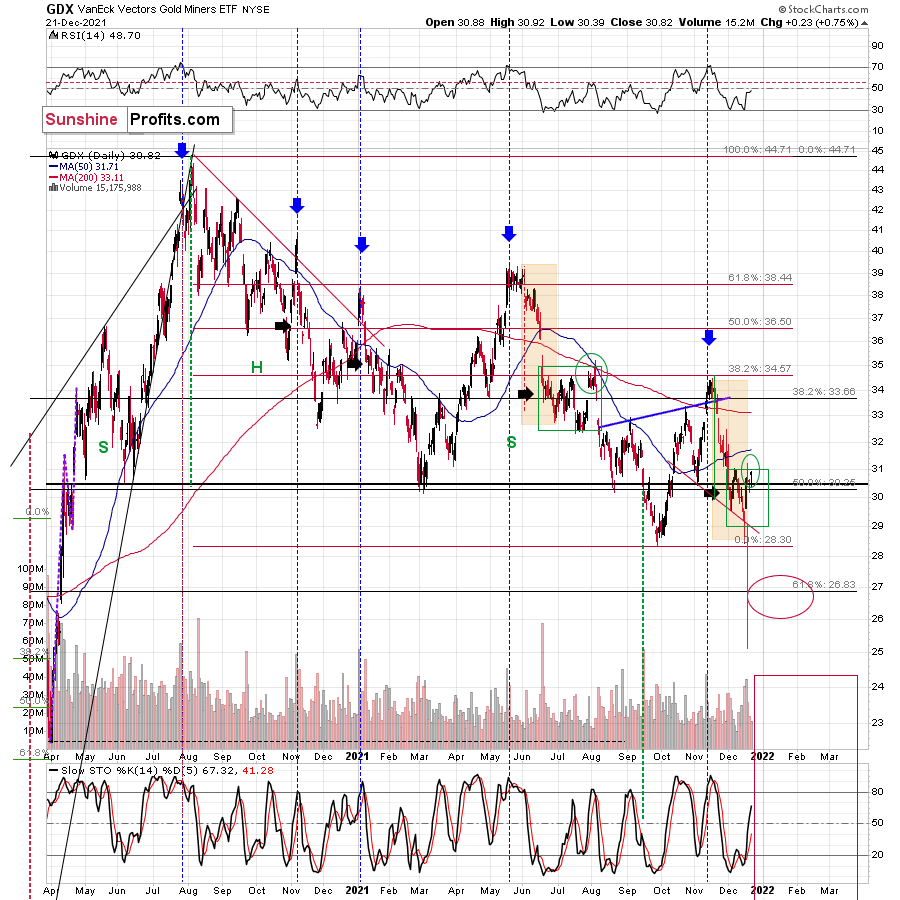
Well, a 0.75% (smaller than in the case of silver) move higher shouldn’t necessarily be called “a rally”, but let’s not go into semantics.
The important thing is that, unlike silver, mining stocks didn’t move to new intraday monthly highs and that they are behaving very much in tune with what they did in late July and early August. Several days ago, I marked that situation as similar to the current one.
If mining stocks are repeating their performance that preceded the declines, then why should this movement be considered as something bullish? The answer is: it shouldn’t.
And what’s happening in the USD Index?
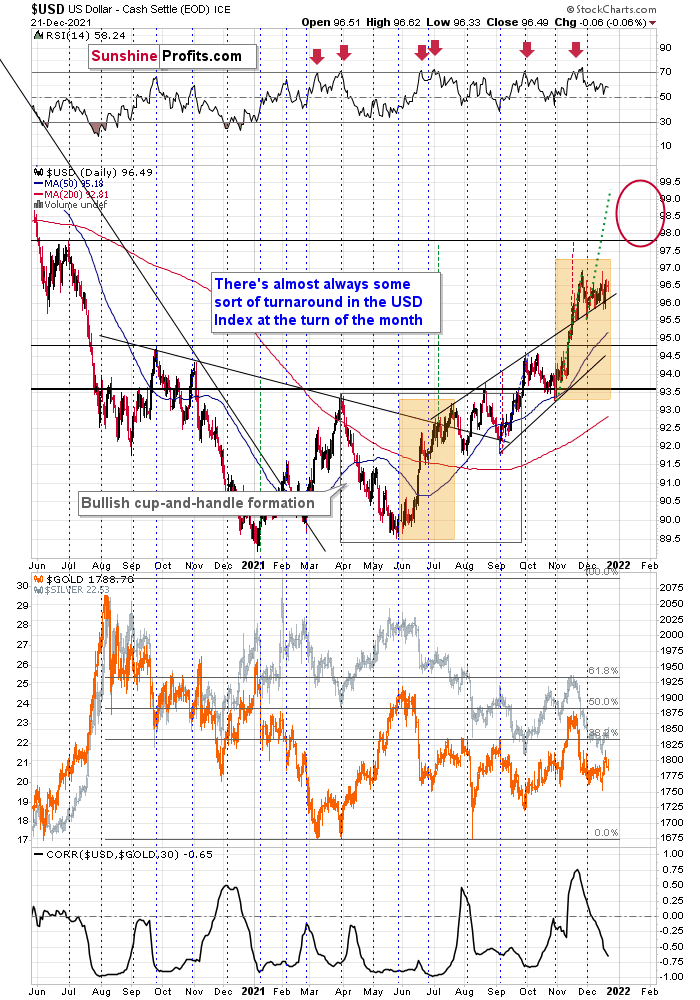
In short, not much. The USD Index is moving sideways, consolidating after a powerful short-term rally.
I previously wrote about the mid-2020 highs being the likely target for the next short-term upswing, but after seeing this consolidation taking place for so long, I’m no longer that certain. You see, consolidations cause the emotions to cool down, and people to accept a certain price range as “normal” instead of being “excessive”. Therefore, when things get moving (a new trend starts), the price can get to “new excessive” levels, thus becoming overbought once again, before topping.
The thing is that since the consolidation was so broad (from the short-term point of view), it seems that a rally of less than a single index point after the previous 2021 high might not be enough to make the situation “too excessive” once again.
One technique that aims to detect how high a price could go after a consolidation is to check how big the pre-consolidation rally was and then to expect it to repeat itself. As with most technical methods, there’s no clear logical explanation behind it, other than it’s based on emotionality, and that it’s been observed to work that way over and over again.
I applied the above-mentioned technique using green, dotted lines. It points to the next target being above 99. While it’s unclear if the USD Index will top at the above level or at the earlier target of about 98, I’m broadening the target area for the next USDX top.
This doesn’t change anything for gold, though, which is still likely to form a short-term bottom close to its previous 2021 lows.
Having said that, let’s take a look at the markets from a more fundamental angle.
Relative Strength
After another (likely) short squeeze helped propel the S&P 500 higher on Dec. 21, silver and mining stocks benefited from the bulls’ enthusiasm. However, immense relative strength of the USD Index was hidden beneath the surface.
To explain, the frenzy on Dec. 21 was broad-based: the ARK Innovated ETF jumped by 3.84%, Tesla jumped by 4.29%, Uber rallied by 5.72%, and crude rallied by 3.66%. As a result, investors bought anything that had a ticker symbol – whether it was the bubble basket (ARK and Tesla) or the cyclicals that have been hurt by the Omicron variant (Uber and crude).
Despite that, though, the USD Index barely flinched. In the past, risk-on sentiment occurred at the U.S. dollar’s expense. Moreover, the euro, commodity, and EM currencies often caught a bid. However, with the greenback’s recent rally built on a solid fundamental foundation, the S&P 500’s surge couldn’t knock the dollar off of its lofty perch.
Please see below:
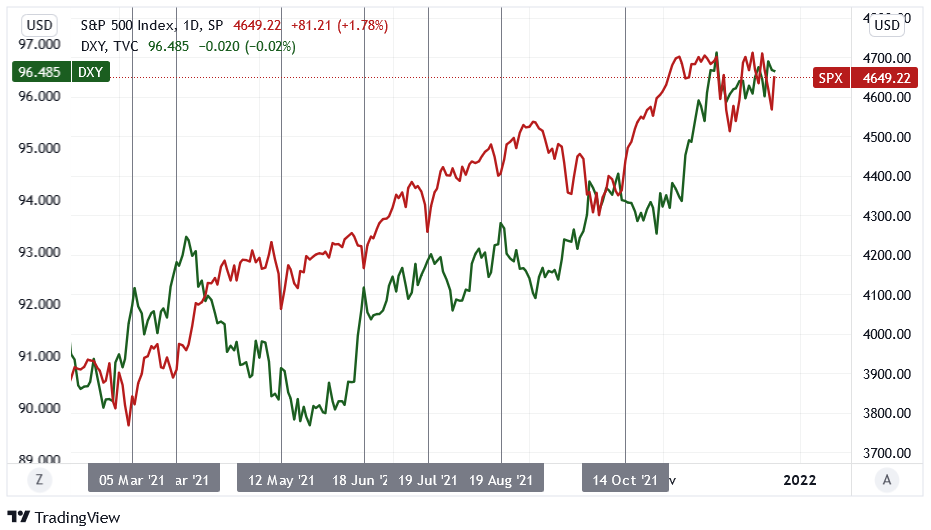
To explain, the green line above tracks the USD Index, while the red line tracks the S&P 500. If you analyze the intersections of the gray vertical lines, you can see that the S&P 500's daily surges (red line rises) often coincide with the USD Index's daily declines (green line falls).
Furthermore, while these short-term swings reversed once sentiment settled, it's essential to understand the importance of the then-and-now price action. To that point, if you analyze the right side of the chart, you can see that the USD Index completely ignored the S&P 500's rally on Dec. 21. As a result, the USD Index's relative strength signals that a renewed sense of confidence underpins the greenback.
In addition, while gold was the only precious metal to notice on Dec. 21, U.S. Treasury yields awoke from their slumber. For context, the Omicron variant's negativity has helped depress U.S. interest rates. However, with the U.S. 10-Year Treasury yield rallying without the S&P 500 on Dec. 20 and with the S&P 500 on Dec. 21, a resumption of its uptrend is fundamentally bearish for the PMs.
Please see below:
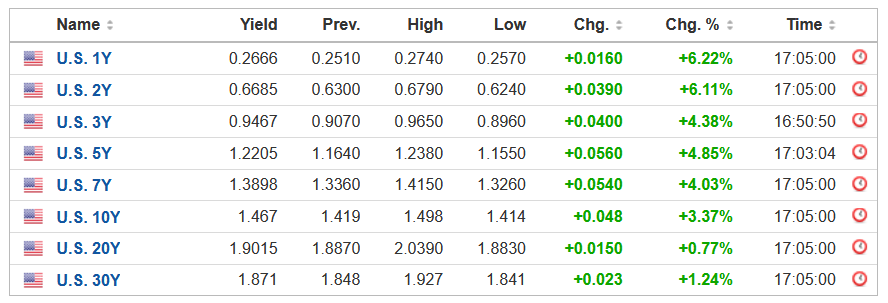 Source: Investing.com
To that point, Bloomberg reported on Dec. 21 that the U.S. Food and Drug Administration (FDA) is preparing to green-light Pfizer and Merck's COVID-19 pills. The article claimed that "an announcement may come as early as Wednesday, according to three of the people [that] asked not to be identified ahead of the authorization and cautioned that the plan could change."
For context, Pfizer's pill showed an 89% reduction in hospitalization for patients who received the medicine within three days of developing symptoms. Thus, if the drugs are formally approved, they could provide additional medical ammunition to help fight the pandemic.
More importantly, though, with milder symptoms present in each new variant and more treatment options available for those who want them, each outbreak's economic impact should decelerate. As a result, consumer mobility and economic growth should improve in the coming months, placing upward pressure on U.S. interest rates.
To that point, The Conference Board released its Leading Economic Index (LEI) on Dec. 21. After recording month-over-month (MoM) increases of 0.3% in September, 0.9% in October, and now, 1.1% in November, the U.S. economy remains on solid footing. The report revealed:
“The U.S. LEI rose sharply again in November, suggesting the current economic expansion will continue into the first half of 2022. Inflation and continuing supply chain disruptions, as well as a resurgence of COVID-19, pose risks to GDP growth in 2022. Still, the economic impact of these risks may be contained. The Conference Board forecasts real GDP growth to strengthen in Q4 2021 to about 6.5 percent (annualized rate), before moderating to a still healthy rate of 2.2 percent in Q1 2022.”
In addition, The Confidence Board revealed separately that they “forecast that the US economy will grow by 3.5 percent (year-over-year) in 2022 and 2.9 percent (year-over-year) in 2023.”
Please see below:
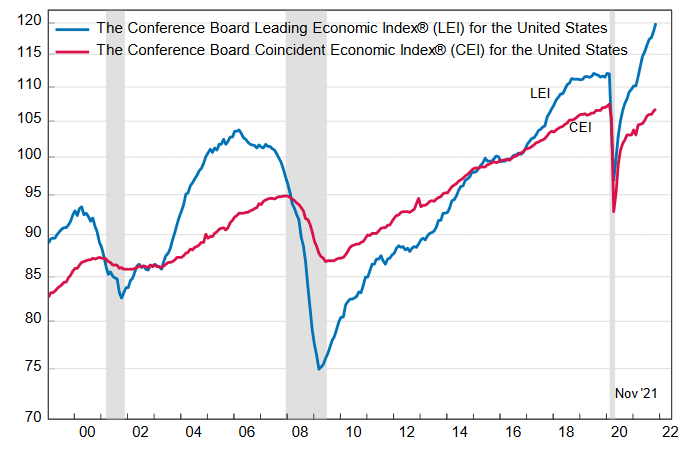 Source: The Confidence Board
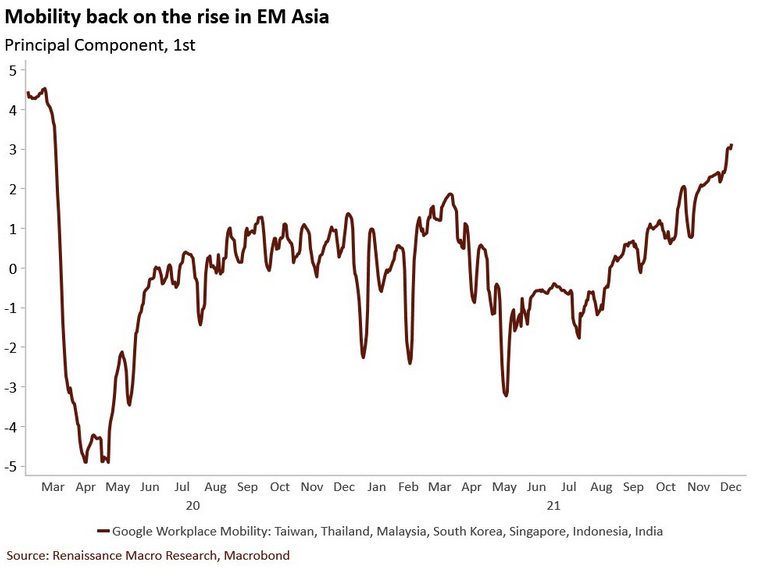
Also supporting the thesis, Asian countries have been hard-hit by coronavirus outbreaks, and for better or worse, regions often impose restrictions to reduce case counts. Moreover, when the Delta wave hit them before it reached the U.S., workplace mobility sank like a stone. However, with workplace mobility now on the rise, the development could uplift economic growth and alleviate some of the U.S. supply chain issues.
In a nutshell: the lower the economic impact of each coronavirus outbreak, the more pressure it puts on the Fed to tighten monetary policy. Thus, if Asia’s momentum is replicated in the U.S., the Fed’s foot should remain on the hawkish accelerator.
Please see below:
Speaking of a hawkish Fed, I’ve been warning for months that rent inflation would put upward pressure on the headline Consumer Price Index (CPI). With the Shelter CPI rising by 3.9% year-over-year (YoY) on Dec. 10 (a new 2021 high), the Fed’s inflationary margin for error is shrinking by the day.
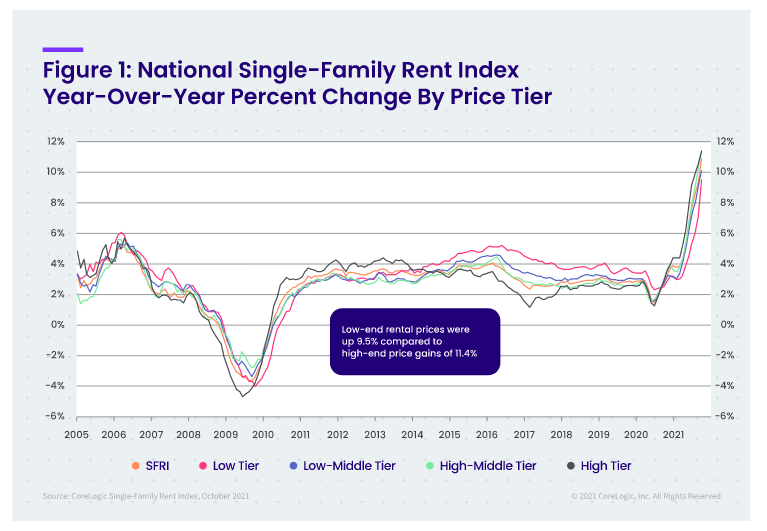
To that point, CoreLogic released its Single-Family Rent Index (SFRI) on Dec. 21. After “U.S. single-family rent growth increased 10.9% in October 2021”, it marked “the fastest year-over-year increase in over 16 years.”
The report revealed:
- Lower-priced units: rent inflation was 9.5% in October 2021 versus 2.8% in October 2020.
- Lower-middle priced units: rent inflation was 10.1% in October 2021 versus 2.8% in October 2020.
- Higher-middle priced units: rent inflation was 11.3% in October 2021 versus 3% in October 2020.
- Higher-priced units: rent inflation was 11.4% in October 2021 versus 3.5% in October 2020.
Please see below:
For context, Molly Boesel, principal economist at CoreLogic, said:
“Single-family rent growth hit its sixth consecutive record high in October 2021, mirroring record price increases in the for-sale housing market. Rent growth in October 2020 had already recovered from pre-pandemic lows and rent growth this October was more than three times that of a year earlier.”
The bottom line? The USD Index continues to demonstrate immense resilience. With inflation running hot and U.S. economic growth poised to re-accelerate in the coming months, the Fed’s tightening cycle should continue to uplift the U.S. dollar. Moreover, with U.S. Treasury yields slowly creeping higher, interest rates should mirror the greenback’s ascent over the medium term. With this fundamental cocktail extremely bearish for the PMs, a realization should help push the GDXJ ETF to new lows.
In conclusion, the PMs were mixed on Dec. 21, and gold was the daily underperformer. While the S&P 500 helped uplift the GDXJ ETF (which is often the case), hyper-growth technology stocks are no fans of rising interest rates. As a result, if the Omicron variant fades and the U.S. economy records a solid recovery, the bullish economic outcome is profoundly bearish for the NASDAQ Composite, and to a lesser extent, the S&P 500. With the PMs often upended by similar fundamental developments, a re-acceleration of U.S. economic growth will likely sour their performances as well.
Overview of the Upcoming Part of the Decline
- It seems to me that while the corrective upswing might still continue, it might not be significant in case of junior mining stocks. After the corrective upswing is over, I think that gold will decline once again taking silver and mining stocks lower as well.
- It seems that the first stop for gold will be close to its previous 2021 lows, slightly below $1,700. Then it will likely correct a bit, but it’s unclear if I want to exit or reverse the current short position based on that – it depends on the number and the nature of the bullish indications that we get at that time.
- After the above-mentioned correction, we’re likely to see a powerful slide, perhaps close to the 2020 low ($1,450 - $1,500).
- If we see a situation where miners slide in a meaningful and volatile way while silver doesn’t (it just declines moderately), I plan to – once again – switch from short positions in miners to short positions in silver. At this time, it’s too early to say at what price levels this could take place, and if we get this kind of opportunity at all – perhaps with gold close to $1,600.
- I plan to exit all remaining short positions once gold shows substantial strength relative to the USD Index while the latter is still rallying. This may be the case with gold close to $1,350 - $1,400. I expect silver to fall the hardest in the final part of the move. This moment (when gold performs very strongly against the rallying USD and miners are strong relative to gold after its substantial decline) is likely to be the best entry point for long-term investments, in my view. This can also happen with gold close to $1,375, but at the moment it’s too early to say with certainty. I expect the final bottom to take place near the end of the year, perhaps in mid-December. It is not set in stone that PMs have to bottom at that time. If not then, then early 2022 would become a likely time target.
- As a confirmation for the above, I will use the (upcoming or perhaps we have already seen it?) top in the general stock market as the starting point for the three-month countdown. The reason is that after the 1929 top, gold miners declined for about three months after the general stock market started to slide. We also saw some confirmations of this theory based on the analogy to 2008. All in all, the precious metals sector is likely to bottom about three months after the general stock market tops. The additional confirmation will come from the tapering schedule, as markets are likely to move on the rumor and reverse on the fact as they tend to do in general.
- The above is based on the information available today, and it might change in the following days/weeks.
You will find my general overview of the outlook for gold on the chart below:
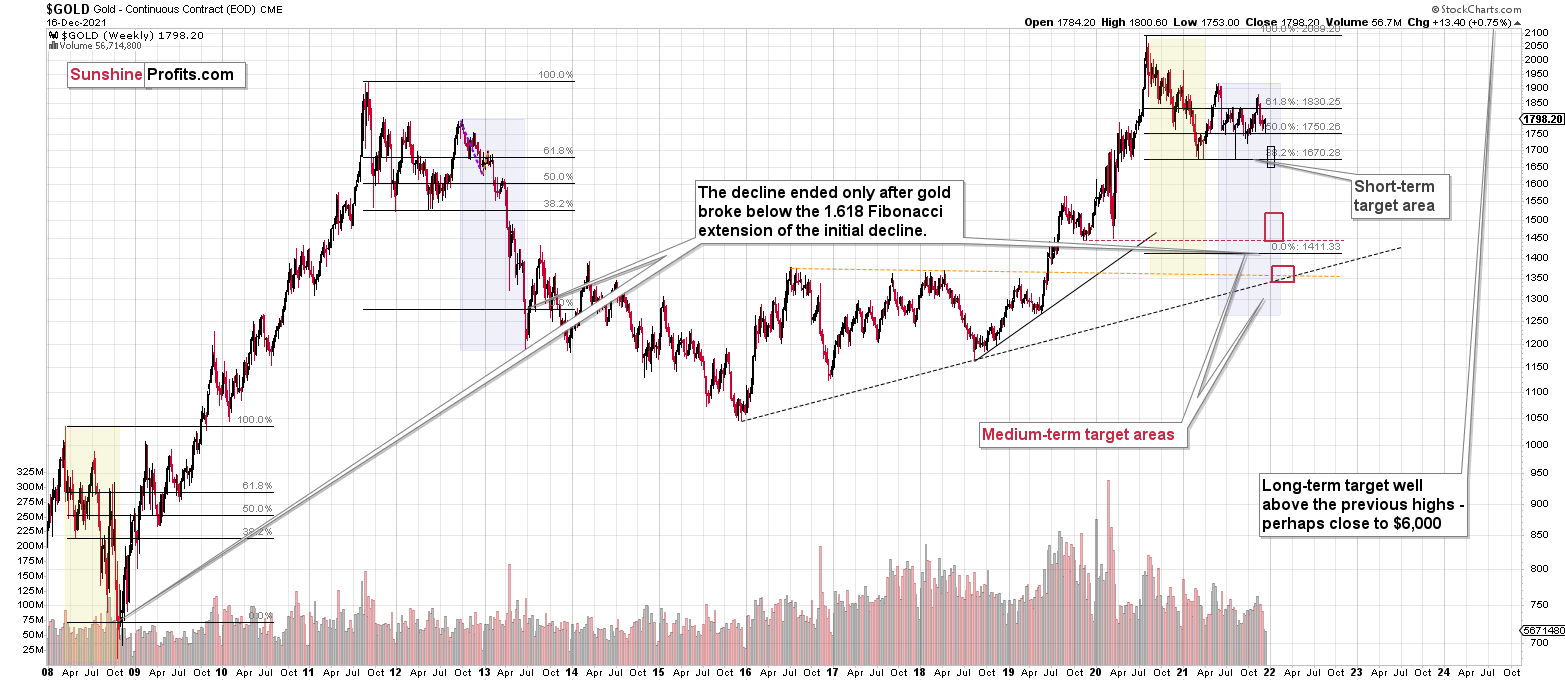
Please note that the above timing details are relatively broad and “for general overview only” – so that you know more or less what I think and how volatile I think the moves are likely to be – on an approximate basis. These time targets are not binding or clear enough for me to think that they should be used for purchasing options, warrants or similar instruments.
Leveraged ETFs – the Details
I’ve received a very interesting message discussing the specific trait of the popular leveraged ETFs. It’s based on the discussion of what it is that is actually being leveraged and what one can do about it.
The message was quite long, so I won’t quote it in its entirety, but I’ll address the key points in it. It starts with this comparison of recent performance. Let’s use this year’s up-to-date performance as a reference point.
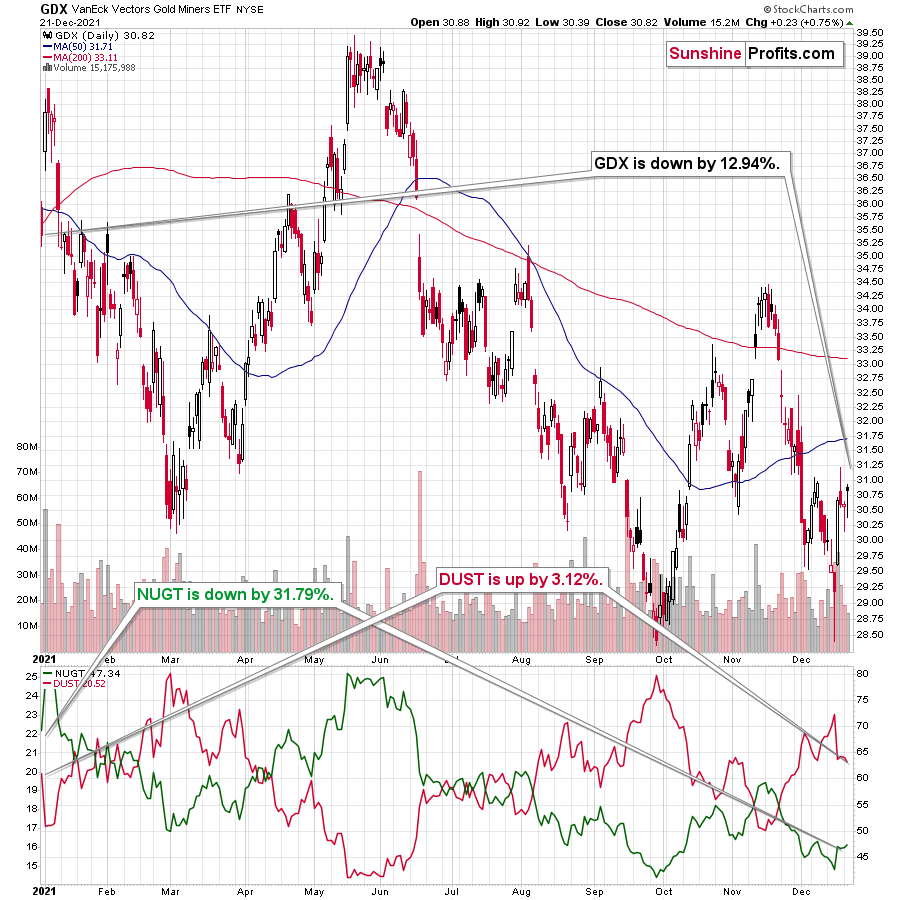
Briefly:
- GDX is down by 12.94% so far this year.
- NUGT is down by 31.79% so far this year.
- DUST is up by 3.12% so far this year.
It seems that the leveraged products are stealing people’s money! The possible losses on long positions were magnified (31.79 / 12.94 = 2.46) 2.46 times, but at the same time, the possible gains, thanks to correctly betting on lower GDX prices, were greatly diminished (3.12 / 12.94 = 0.24) about 4 times.
Why on Earth would anyone be using those products if they present so unfavorable returns?!
Let’s keep two things in mind.
One thing is that the leveraged is based on daily price moves and not on weekly, monthly, or yearly moves. This has profound implications, as what happens doesn’t just depend on where the price moves, but also on the way it gets there.
The second thing is that this year has been just moderately bearish so far. I mean, the decline that we’ve seen was visible, but it’s not that significant. Miners declined by less than 13%, and the decline that I’ve been describing (as my expectation) was supposed to take miners much lower – perhaps cutting their prices in half or more.
So, if something that I was writing about hasn’t happened yet, is it fair to judge what kind of proxy was good to bet on this move? It would be fine if NUGT’s and DUST’s (and JNUG’s and JDST’s) performances didn’t depend on the shape of the move, but they do.
Before providing you with another example, let me present you with an alternative idea.
Since NUGT performed so much worse than GDX (2.46x leverage year-to-date), then why not… simply short NUGT instead of going long DUST? (Or, in the case of junior miners, why not short the JNUG instead of going long the JDST?)
This way, one would be on the side that actually benefits from the day-to-day leverage and its implications.
- “Wait a minute. You’re telling me that you can actually do that? Can you can short the ETF that’s dedicated to magnifying gains from long positions?”
Yup.
- “I can’t believe it. Really?”
Yup.
- “Nah, there has to be some kind of catch!”
There is! You can do it, but you’re absolutely right that there’s a catch. A quite important one, if you really want to profit from a major, volatile price move.
Let’s take a look at what happened in 2020 during the volatile slide in the GDX.
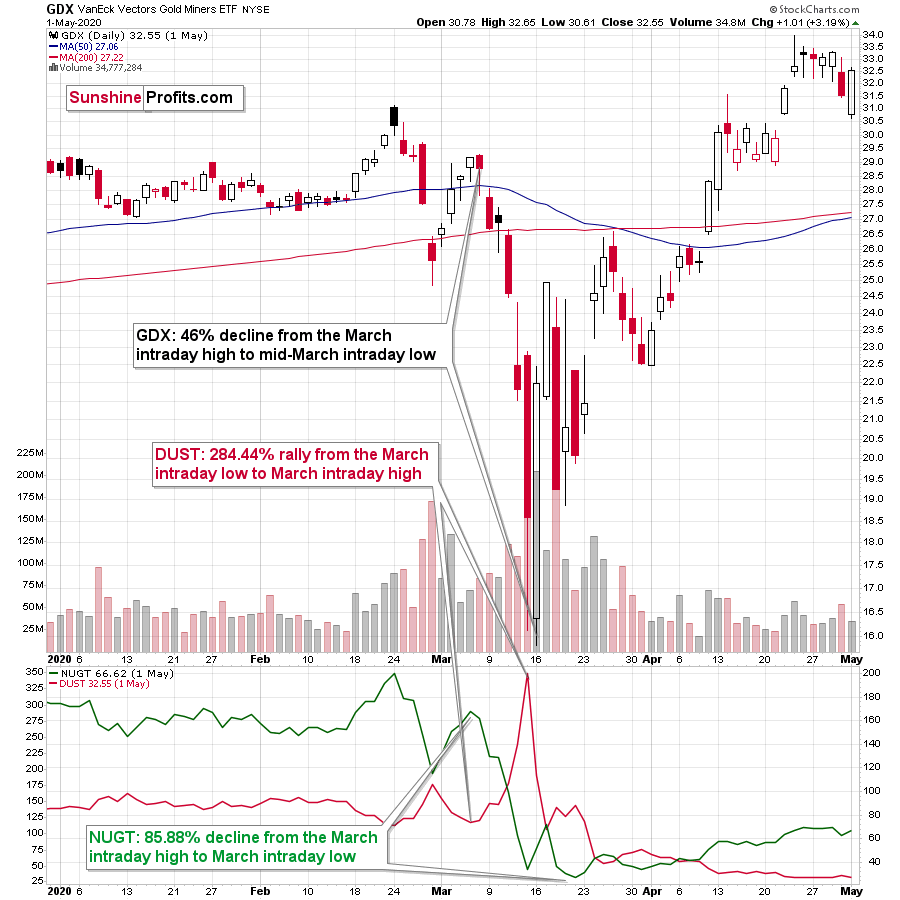
Briefly:
- GDX was down by 46% from its March intraday high to its March intraday low.
- NUGT was down by 85.88% from its March intraday high to its March intraday low.
- DUST was up by 284.44% from its March intraday low to its March intraday high.
In other words: NUGT provided about (85.88 / 46 = 1.87) 1.87 leverage, but DUST provided about (284.44 / 46 = 6.18) 6.18 leverage!
Putting aside the transaction costs, interest, taxes, etc., if one shorted the GDX ETF during the March slide, they would have gained about 46%. If they shorted NUGT, they would have gained about 86%, and if they bought DUST, they would have gained almost 300%.
By shorting GDXJ or NUGT (or GDX or JNUG), one is effectively capping the maximum profits on the trade at 100%. This doesn’t apply to a long position in DUST or JDST.
In the case of the junior mining stocks, GDXJ, JNUG, and JDST, the analogous numbers would have been:
- GDXJ – (hypothetical, but based on real data) gain from shorting: 52.72%
- JNUG – (hypothetical, but based on real data) gain from shorting: 95.11%
- JDST – (hypothetical, but based on real data) gain from a long position: 404.75%
So, in the case of the junior miners, the leverage gained on the March 2020 decline (if one entered and exited positions right at the price extremes), would have been (404.75 / 52.72 = 7.68) 7.68.
In general, the bigger and more volatile the move would be, the bigger the leverage would have become.
Would you prefer a 400% gain on the JDST-powered price move or a “fair” 2x leverage for the entire move that would yield 52.72% x 2 = 105.44% gains?
Even if the position was initially cut in half through time decay, one would still come out about twice as profitable than from the
One might think that the day-to-day leverage works against them, and that’s true most of the time. However, just because it’s true most of the time, it doesn’t mean that it’s the most important thing that should be considered (on the other hand, it shouldn’t be ignored, either). It’s difficult psychologically to see the price move in a rather steady manner, making one’s positions less than perfectly appealing in the case of the DUST or JDST. However, if the upcoming move is really likely to be very significant and volatile, it could be the case that a week or month of strong performance would make up for the temporary underperformance and then increase the gains several times over.
So, what’s the take-away here?
Be sure to understand how a given product’s leverage works before using it. In general, if the price moves are likely to be huge (preferably: epic) in the not-too-distant future, buying leveraged ETFs can provide handsome profits. However, if the price moves are likely to be rather normal, then buying leveraged ETFs might be useful only in the case of the short-term price moves. In the case of medium-term moves, if one seeks leverage, one might use either CFDs (if they are available, that is – that’s not something available in the U.S. or Canada, and it’s also unavailable in many other jurisdictions). Alternatively, one might consider shorting the leveraged ETF that magnifies the moves that are the opposite of what one expected (so, instead of going long GDX, or buying NUGT, one could short DUST). The latter approach still has some risks. For example, it would not work well if there was a huge (epic) move in the adverse direction.
I can’t tell you what you should do with your capital, as that depends on your preferences, ability and willingness to take risk, etc. I can only tell you what I think the market is going to do and why I think so. I can also tell you who I prefer to take advantage of the upcoming price moves. Right now, I think that the junior mining stocks are going to decline profoundly in the following weeks or months, and I’m long the JDST.
This doesn’t mean that it’s the best approach for you – but thanks to being informed (for example, based on my above explanation), you can take the decision that suits you the most.
Summary
Summing up, it seems to me that while we the corrective upswing might still continue, it might not be significant in case of junior mining stocks. After the corrective upswing is over, I think that gold will decline once again taking silver and mining stocks lower as well.
If the new Covid-19 variant makes the vaccine rather useless, we might be in for very wild price moves in most markets. In the case of the precious metals sector, the initial move should be to the downside, but at the same time, it makes the long-term outlook even more bullish.
From the medium-term point of view, the key two long-term factors remain the analogy to 2013 in gold and the broad head and shoulders pattern in the HUI Index. They both suggest much lower prices ahead.
It seems that our profits from the short positions are going to become truly epic in the following months.
After the sell-off (that takes gold to about $1,350 - $1,500), I expect the precious metals to rally significantly. The final part of the decline might take as little as 1-5 weeks, so it's important to stay alert to any changes.
Most importantly, please stay healthy and safe. We made a lot of money last March and this March, and it seems that we’re about to make much more on the upcoming decline, but you have to be healthy to enjoy the results.
As always, we'll keep you - our subscribers - informed.
YEAR-END PUBLICATION SCHEDULE:
- The analyses will continue to be published normally until Thursday, December 23, 2021.
- There will be no regular Gold & Silver Trading Alerts posted on Friday, Dec. 24, 2021 (the markets are closed in the U.S., so probably nothing important will happen on that day, anyway), and there will be no regular Gold & Silver Trading Alerts posted between Monday, Dec. 27, 2021 and Friday, Dec. 31, 2021.
- The regular analyses will be back on Monday, Jan. 3, 2022, and the first flagship Gold & Silver Trading Alert will be posted on Tuesday, Jan. 4, 2022.
- In other words, we are taking a break from the regular publication of Gold & Silver Trading Alerts between Christmas Eve and the end of the year.
It’s been a volatile year, and it seems that 2022 will be even more so. Consequently, it's a good idea to take this opportunity to recharge batteries. The nature of the service that we’re providing is extremely person-specific, as I (PR here) can’t just re-assign managing the trade that I entered based on my own analysis, my outlook, and my opinions, to someone else. I also can’t ignore the fact that in order to provide you with the highest quality service, periodic breaks from the regular schedule are necessary. I can’t even remember when I took a weekly break from the regular publication schedule. Probably a few years ago.
Still, the emphasis is on “regular”, since just because there will be no regular, daily analyses posted, it doesn’t mean that I’m going to stop monitoring the situation on the markets entirely. I think that the precious metals market is on the verge of a major move lower, and I’m keeping my trading position (which is – of course – aligned with what I’m describing in my Gold & Silver Trading Alerts) open. I will keep monitoring the markets, and if anything changes, I will send you a quick note, anyway. Consequently, despite the break from the regular schedule, I will keep you informed and up-to-date, to the extent that the market situation warrants it.
Thank you for understanding.
To summarize:
Trading capital (supplementary part of the portfolio; our opinion): Full speculative short positions (300% of the full position) in junior mining stocks are justified from the risk to reward point of view with the following binding exit profit-take price levels:
Mining stocks (price levels for the GDXJ ETF): binding profit-take exit price: $35.73; stop-loss: none (the volatility is too big to justify a stop-loss order in case of this particular trade)
Alternatively, if one seeks leverage, we’re providing the binding profit-take levels for the JDST (2x leveraged) and GDXD (3x leveraged – which is not suggested for most traders/investors due to the significant leverage). The binding profit-take level for the JDST: $16.18; stop-loss for the JDST: none (the volatility is too big to justify a SL order in case of this particular trade); binding profit-take level for the GDXD: $32.08; stop-loss for the GDXD: none (the volatility is too big to justify a SL order in case of this particular trade).
For-your-information targets (our opinion; we continue to think that mining stocks are the preferred way of taking advantage of the upcoming price move, but if for whatever reason one wants / has to use silver or gold for this trade, we are providing the details anyway.):
Silver futures downside profit-take exit price: $19.12
SLV profit-take exit price: $17.72
ZSL profit-take exit price: $41.38
Gold futures downside profit-take exit price: $1,683
HGD.TO – alternative (Canadian) inverse 2x leveraged gold stocks ETF – the upside profit-take exit price: $12.48
HZD.TO – alternative (Canadian) inverse 2x leveraged silver ETF – the upside profit-take exit price: $30.48
Long-term capital (core part of the portfolio; our opinion): No positions (in other words: cash
Insurance capital (core part of the portfolio; our opinion): Full position
Whether you already subscribed or not, we encourage you to find out how to make the most of our alerts and read our replies to the most common alert-and-gold-trading-related-questions.
Please note that we describe the situation for the day that the alert is posted in the trading section. In other words, if we are writing about a speculative position, it means that it is up-to-date on the day it was posted. We are also featuring the initial target prices to decide whether keeping a position on a given day is in tune with your approach (some moves are too small for medium-term traders, and some might appear too big for day-traders).
Additionally, you might want to read why our stop-loss orders are usually relatively far from the current price.
Please note that a full position doesn't mean using all of the capital for a given trade. You will find details on our thoughts on gold portfolio structuring in the Key Insights section on our website.
As a reminder - "initial target price" means exactly that - an "initial" one. It's not a price level at which we suggest closing positions. If this becomes the case (like it did in the previous trade), we will refer to these levels as levels of exit orders (exactly as we've done previously). Stop-loss levels, however, are naturally not "initial", but something that, in our opinion, might be entered as an order.
Since it is impossible to synchronize target prices and stop-loss levels for all the ETFs and ETNs with the main markets that we provide these levels for (gold, silver and mining stocks - the GDX ETF), the stop-loss levels and target prices for other ETNs and ETF (among other: UGL, GLL, AGQ, ZSL, NUGT, DUST, JNUG, JDST) are provided as supplementary, and not as "final". This means that if a stop-loss or a target level is reached for any of the "additional instruments" (GLL for instance), but not for the "main instrument" (gold in this case), we will view positions in both gold and GLL as still open and the stop-loss for GLL would have to be moved lower. On the other hand, if gold moves to a stop-loss level but GLL doesn't, then we will view both positions (in gold and GLL) as closed. In other words, since it's not possible to be 100% certain that each related instrument moves to a given level when the underlying instrument does, we can't provide levels that would be binding. The levels that we do provide are our best estimate of the levels that will correspond to the levels in the underlying assets, but it will be the underlying assets that one will need to focus on regarding the signs pointing to closing a given position or keeping it open. We might adjust the levels in the "additional instruments" without adjusting the levels in the "main instruments", which will simply mean that we have improved our estimation of these levels, not that we changed our outlook on the markets. We are already working on a tool that would update these levels daily for the most popular ETFs, ETNs and individual mining stocks.
Our preferred ways to invest in and to trade gold along with the reasoning can be found in the how to buy gold section. Furthermore, our preferred ETFs and ETNs can be found in our Gold & Silver ETF Ranking.
As a reminder, Gold & Silver Trading Alerts are posted before or on each trading day (we usually post them before the opening bell, but we don't promise doing that each day). If there's anything urgent, we will send you an additional small alert before posting the main one.
Thank you.
Przemyslaw Radomski, CFA
Founder, Editor-in-chief

