
tools spotlight

-
Fake It Till You Make It: Will Silver’s Motto Work on Gold?
January 19, 2022, 8:40 AMWhile the USD show is gaining applause, silver has decided to present its repertoire too. Was its rally just a magic trick or a good omen for gold?
Bond yields soared once again, just as I’ve been expecting them to for many months now. The reaction in some markets was as expected (the USD Index soared), but in some, it was perplexing. Gold moved lower a little, miners declined a bit more, and silver… rallied. Who’s faking it?
Well, perhaps nobody is. Let’s look at the yields’ movement first.
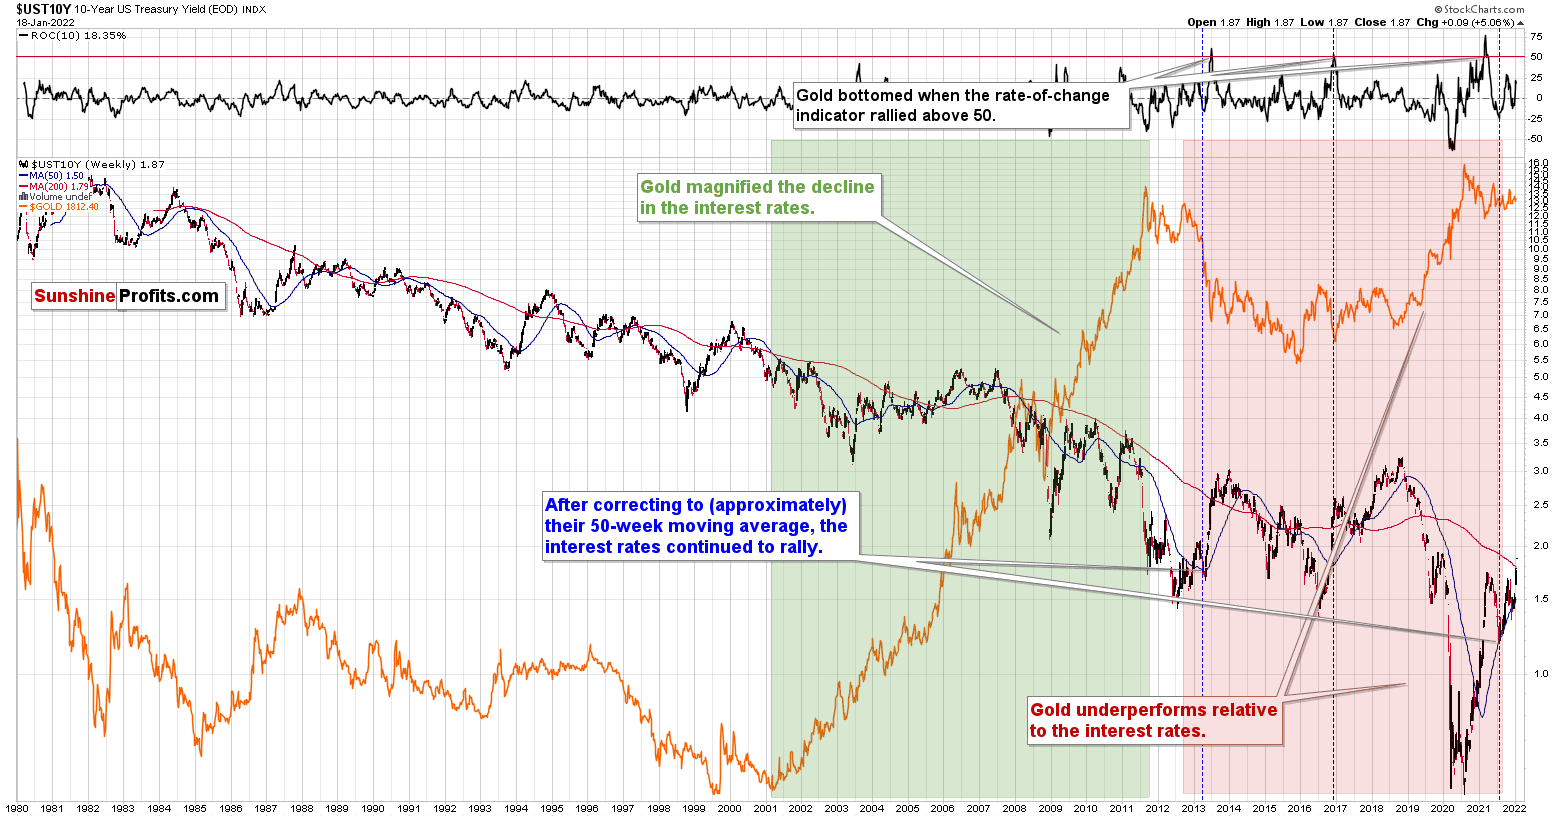
The 10-year bond yields have just moved to new yearly highs and are also above their 2021 highs. This happened just after they moved back to their 50-week moving average (marked in blue). For a long time, I’ve been writing that the 2013 performance is likely to be repeated also in this market, and that’s exactly what is taking place right now. Bond yields are doing what they did back then.
If history continues to rhyme, we can expect bond yields to rally further, the USD Index to gain, and we can predict gold at lower prices.
Speaking of the USD Index, let’s take a look at what it did yesterday.
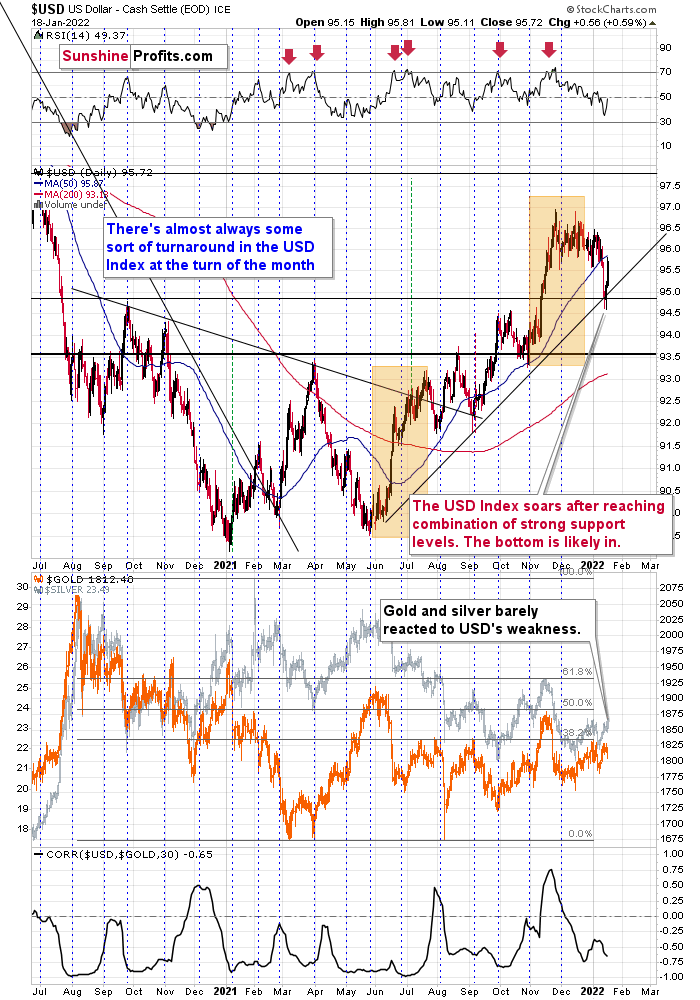
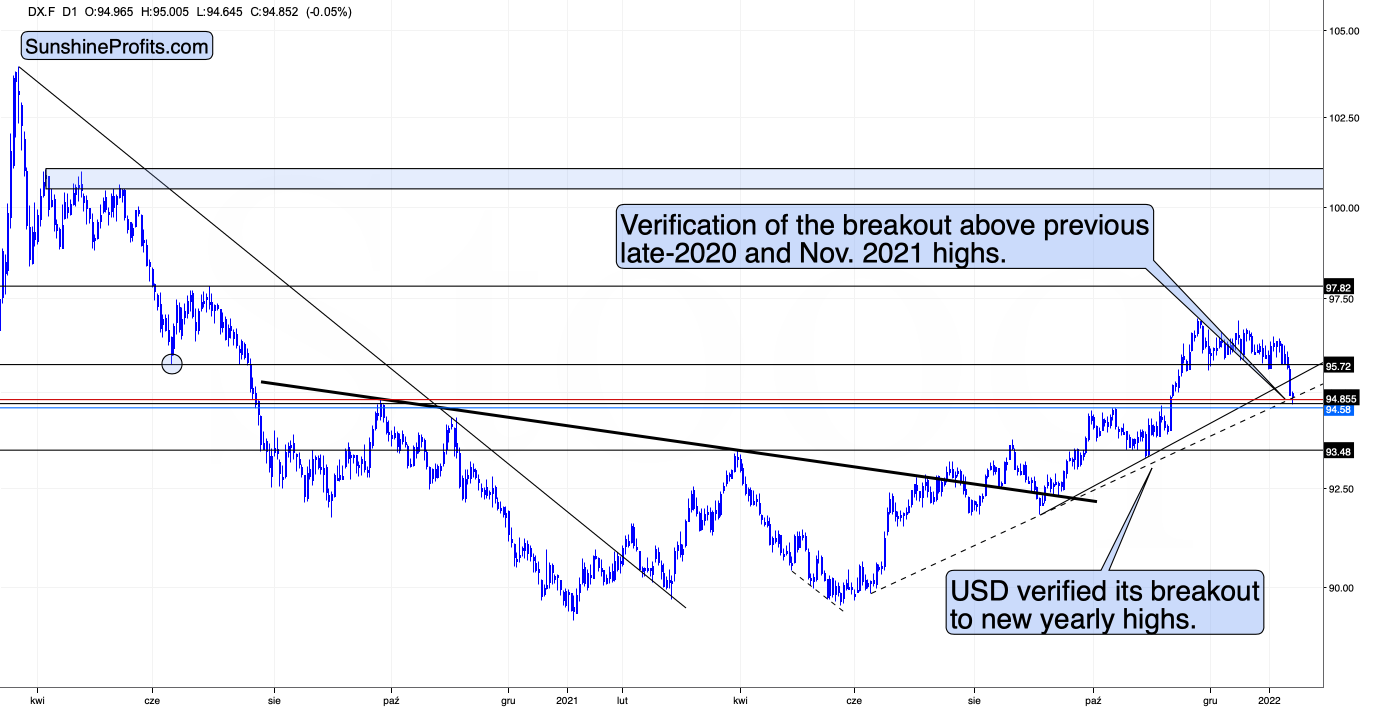
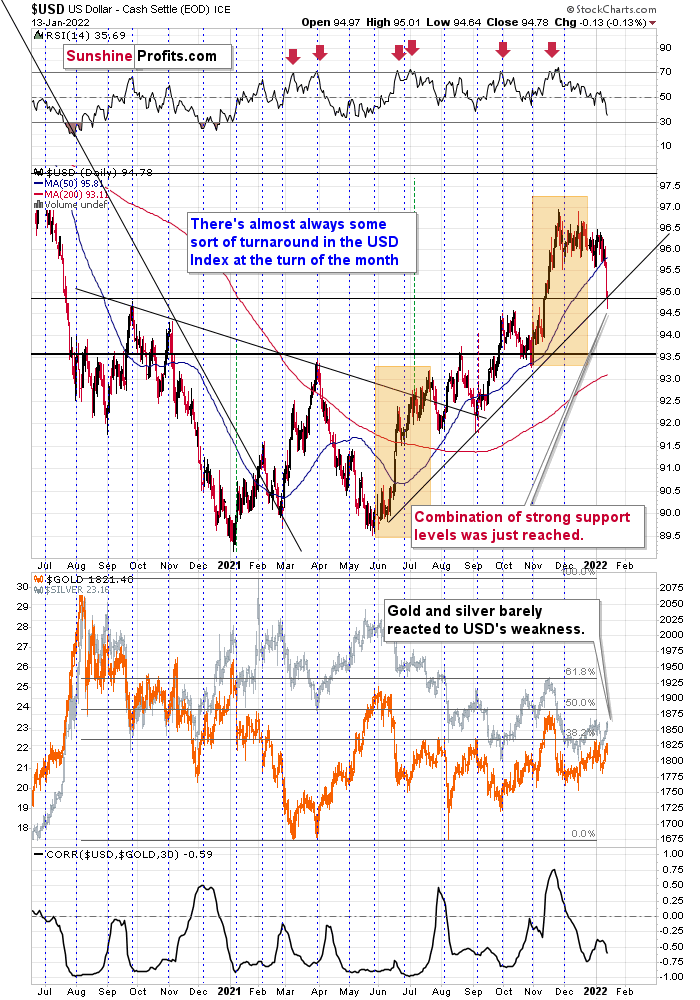
It soared over 0.5 index points, which was the largest daily increase so far this year. This happened after the USD Index moved to a combination of powerful support levels: the rising medium-term support line and the late-2020 high. The tiny attempts to move below those levels were quickly invalidated, and the USD Index was likely to rally back up; and so it did.
What’s next? The uptrend was not broken, so it’s likely to continue. In other words, the USD Index’s rally is likely to continue, and this, in turn, is likely to trigger declines across the precious metals sector.
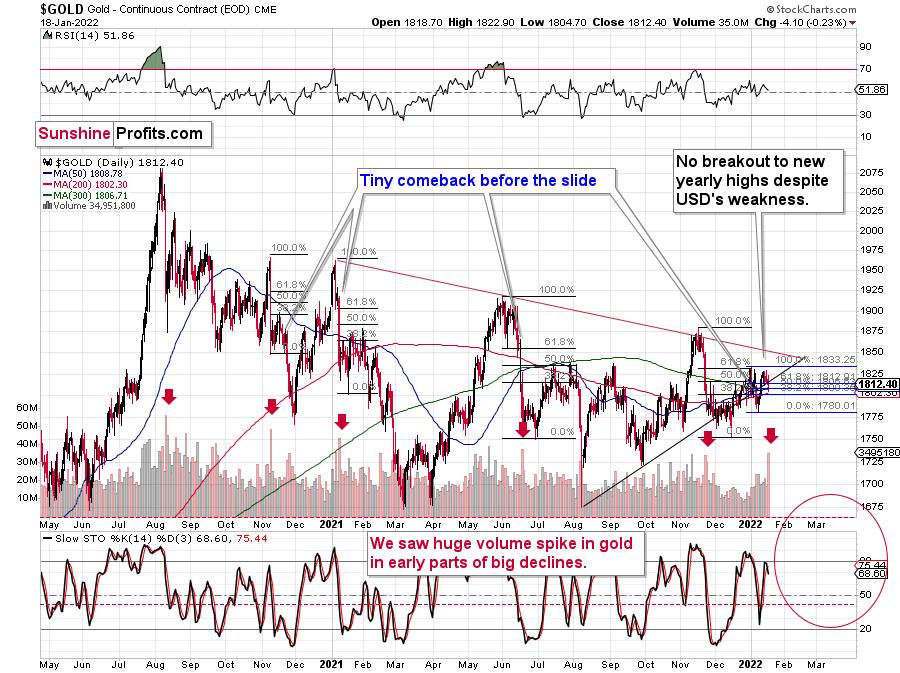
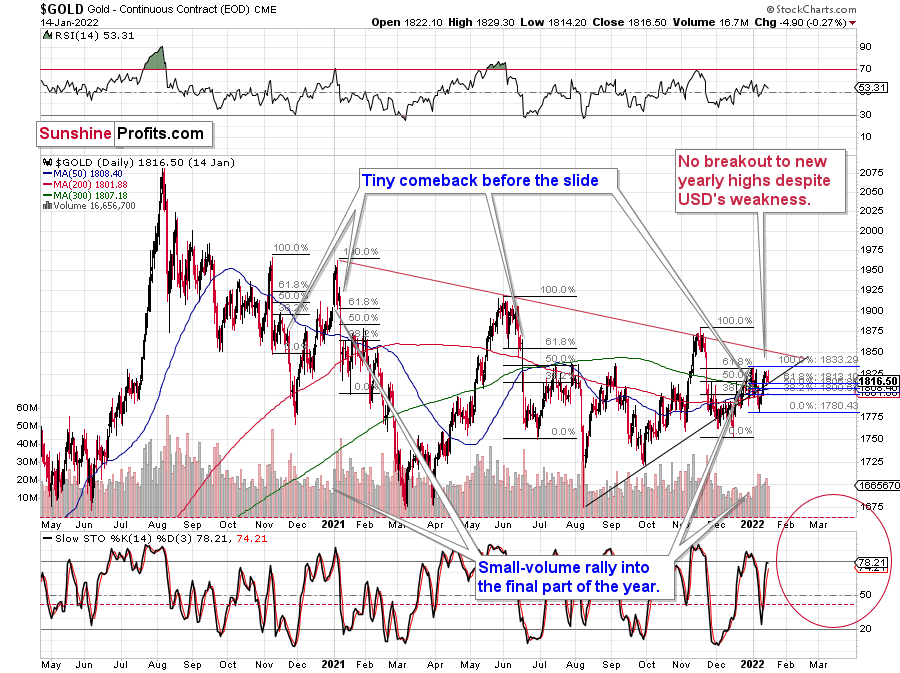
Gold didn’t react with a significant decline yesterday – just a moderate/small one – which some might view as bullish. I’d say that it’s rather neutral.
The rally above the 2021 highs in bond yields might have come as a shock to many investors, and they might not have been sure how to react or what to make of it. It might also have been the “buy the rumor, sell the fact” type of reaction. Either way, it seems to me that we’ll have to wait a few days and see how it plays out once the dust settles.
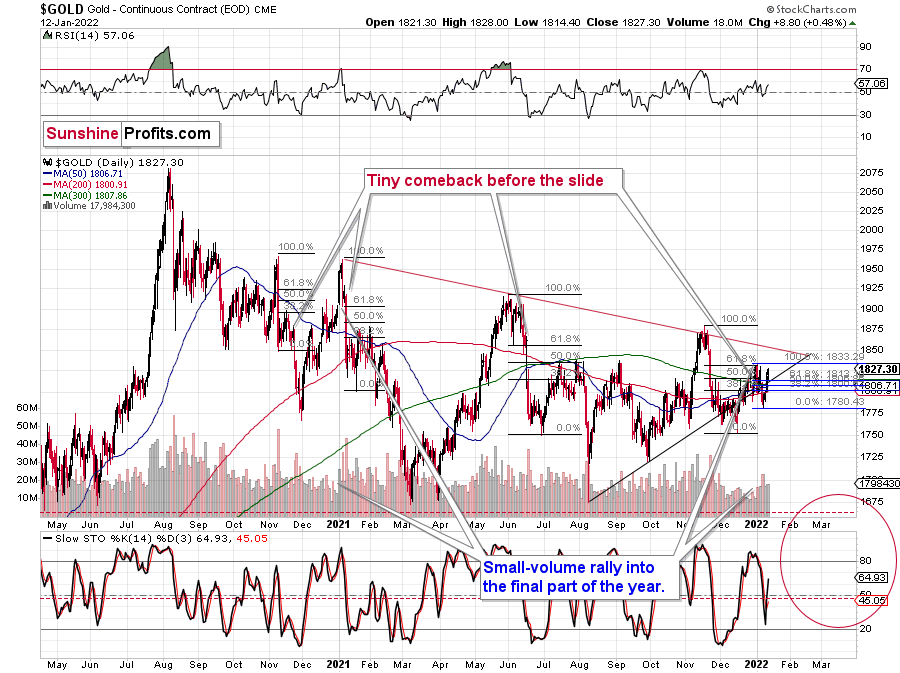
The volume that we saw yesterday was huge. After a period of relatively average volume, we saw this huge volume spike. I marked the previous cases with red arrows. In those cases, such volume accompanied gold’s sizable declines. This time, the volume spike accompanied a $4.10 decline, which might appear perplexing.
Fortunately, gold is not the only market that we can analyze, and – as it’s often the case – context provides us with details that help to make sense of what really happened. Let’s check the key supplemental factor – silver’s price action.
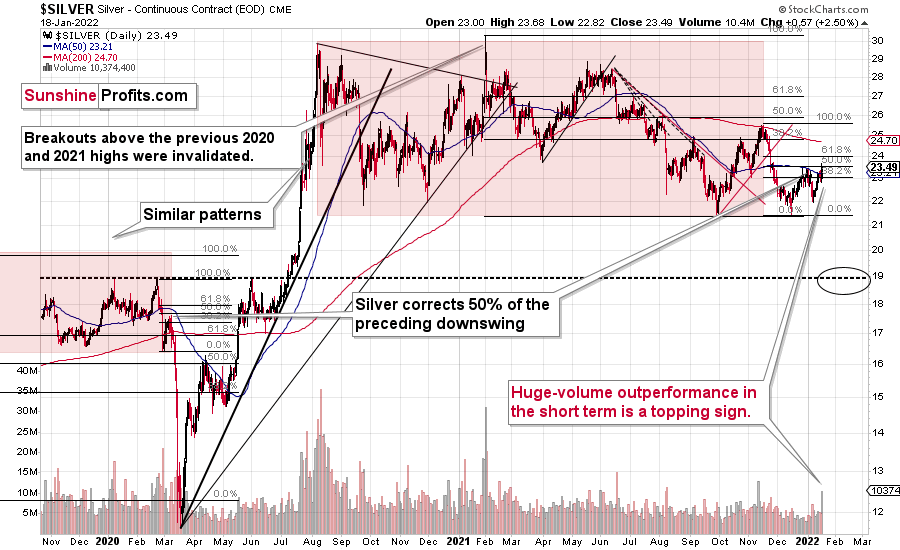
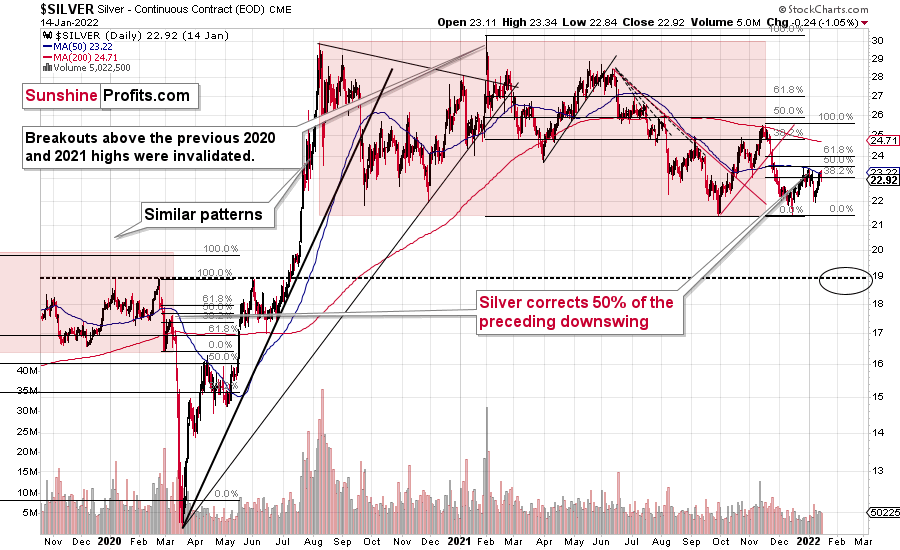
While gold declined a bit, silver soared over $0.5! The volume that accompanied this sizable daily upswing was the biggest that we’ve seen so far this year too. The latter provides additional confirmation of the importance of yesterday’s session.
What was it that happened yesterday that was so important?
Silver outperformed gold on a very short-term basis!
This is profoundly important, because that’s what has been accompanying gold’s, silver’s, and mining stocks’ tops for many years. Knowing to pay attention to even small signs of silver’s outperformance is one of the useful gold trading tips, and the extent of the outperformance is what determines the importance of the signal (and its bearishness). The extent was huge yesterday, so the implications are very bearish.
Yes, silver moved to new yearly highs as well, but silver is known for its fake breakouts (“fakeouts”), which usually happen without analogous moves in gold and mining stocks. Since neither gold nor miners moved to new yearly highs yesterday, it seems that silver “faked out” once again. Silver is up in today’s pre-market trading, and gold is up only slightly, but the latter is not even close to moving to new 2022 highs. The GDX ETF is actually down in today’s London trading (at the moment of writing these words).
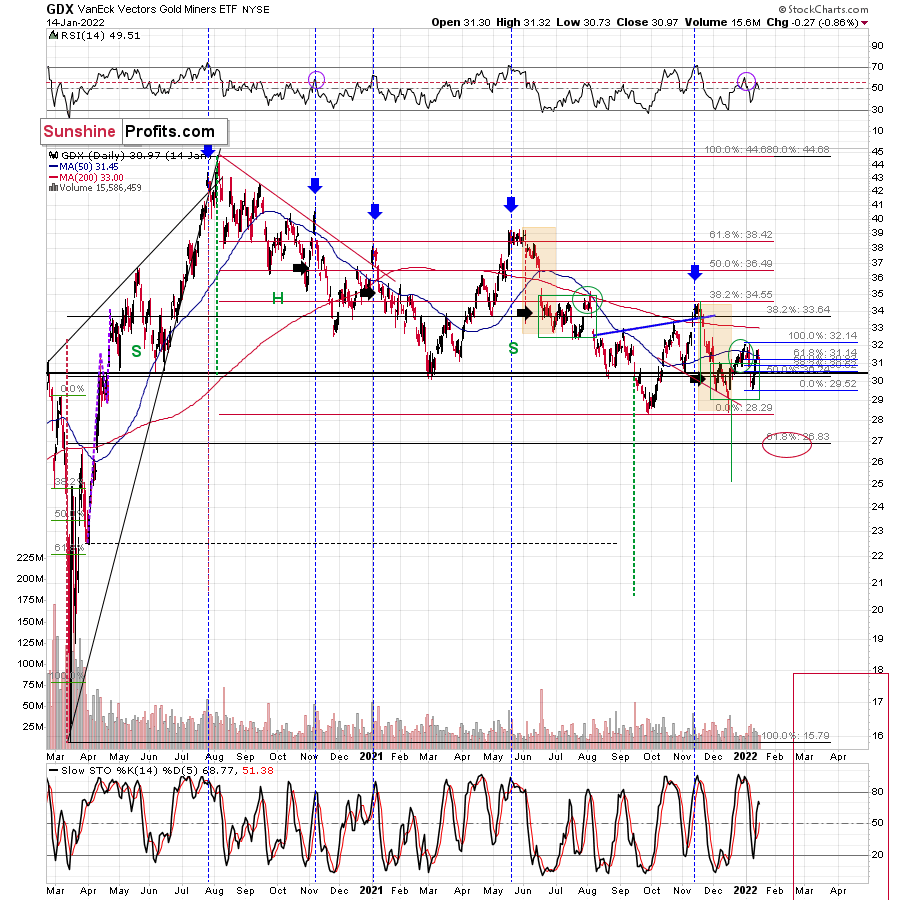
Speaking of mining stocks, let’s take a look at what happened in them yesterday.

In short, they declined – by over 1%, which is about five times more than gold. Since silver outperformed gold, while gold miners underperformed it, the implications for the precious metals sector are bearish.
Thank you for reading our free analysis today. Please note that the above is just a small fraction of the full analyses that our subscribers enjoy on a regular basis. They include multiple premium details such as the interim targets for gold and mining stocks that could be reached in the next few weeks. We invite you to subscribe now and read today’s issue right away.
Sincerely,
Przemyslaw Radomski, CFA
Founder, Editor-in-chief -
USDX Pulls the Strings - Gold Is Stuck in a Falling Elevator
January 18, 2022, 9:01 AMThe key development for precious metals investors this week happened neither in gold, silver, nor mining stocks – it came from the USDX.

The thing that happened was that the U.S. currency bounced off the combination of strong support levels, the late-2020 high, and the rising medium-term support line. In my previous analyses, I wrote the following:
While the USD has a slight cold and is sitting out this inning, the precious metals are enjoying some sun. But for how long before the tables turn?
While six Fed officials warned of forthcoming rate hikes and signaled that the March meeting could result in liftoff, the USD Index responded like they had announced another round of QE. What does it give?
Well, with the U.S. dollar stuck in consolidation mode after its recent sprint higher, gold, silver, and mining stocks have enjoyed the pullback. However, since the charts provide the most accurate clues regarding the future price action, the technicals signal that the USD Index’s weakness should be short-lived.
For example, while unfulfilled prophecies of the dollar’s demise in 2021 have been resurrected in 2022, the USD Index rallied off of expected support. After declining intraday on Jan. 13, the dollar basket reversed higher and ended the day with a bullish hammer candle. Moreover, the USD Index closed above its rising support line (the dashed line below) and its September 2020 high. As a result, the dollar found support near the levels that I outlined on Jan. 13. I wrote:
At the beginning of 2021, I wrote that the year was likely to be bullish for the USD Index, and my forecast for gold (and the rest of the precious metals sector) was bearish – against that of almost every one of my colleagues.
The USD Index ended 2021 about 6% higher, gold was down about 3.5%, silver was down almost 12%, the GDX ETF was down by about 9.5%, and the GDXJ ETF (proxy for junior mining stocks, my primary tool for shorting the precious metals sector in 2021 – I wasn’t shorting gold at any point in 2021) was down by about 21%.
What about this year? It’s a tough call to say how the entire year will go, but it seems to me that the USD Index will move higher, and we’ll see both in the PMs: a massive decline, and then a huge rally. It’s very likely to be a year to remember for anyone interested in trading gold, silver, and/or mining stocks and/or investing in them.
The USD Index declined to fresh 2022 lows – well below the previous January lows, and also below the December and late-November lows.
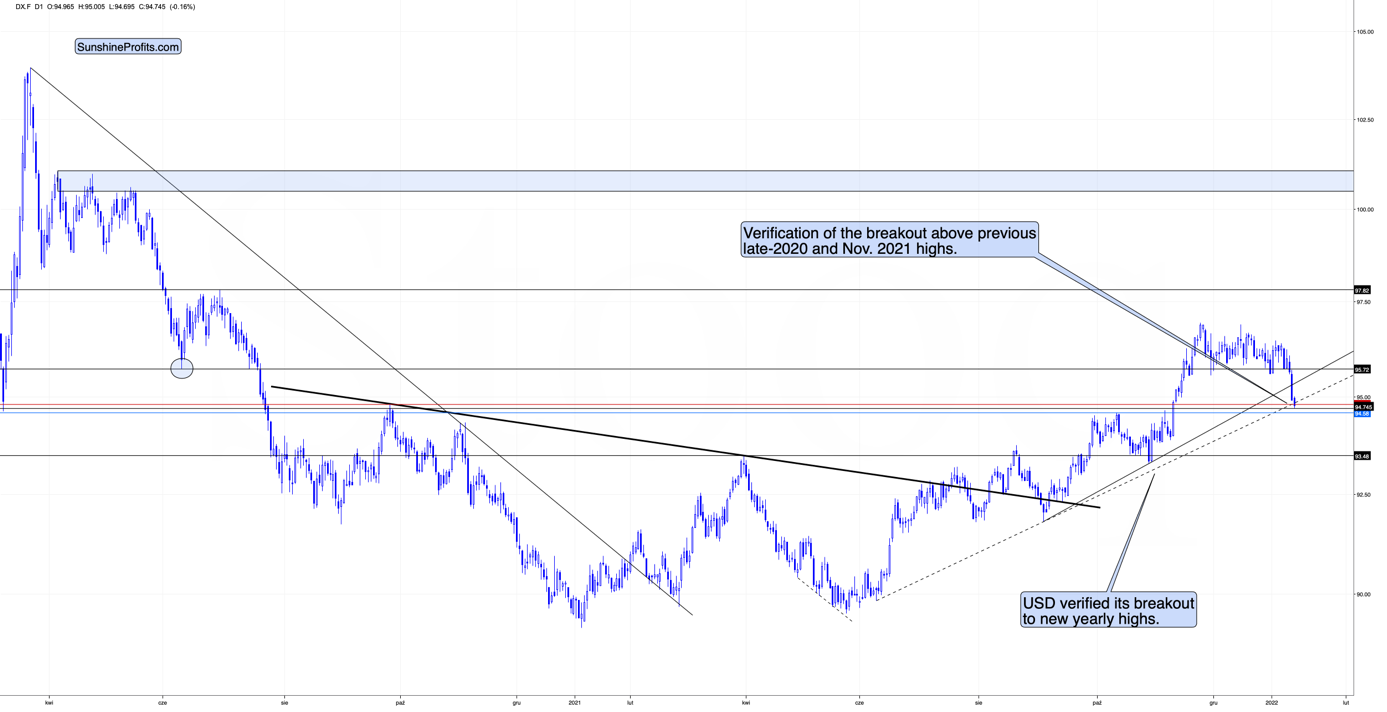
We see that the USD Index just (in overnight trading, so the move is not even close to being confirmed) moved a little below USDX’s rising support line based on the previous June and October 2021 lows. At the same time, the USDX is slightly below its late-2020 top and slightly above its November 2021 top.
In light of the situation on the long-term USDX chart, this combination of support levels is likely to trigger a rebound and the continuation of the medium-term rally.
Well, we saw exactly that – a rebound. Is this the end of the corrective downswing? That’s quite likely, and this scenario is supported not only by the short-term charts, but also by the USD Index’s long-term chart.

I previously described the above chart in the following way:
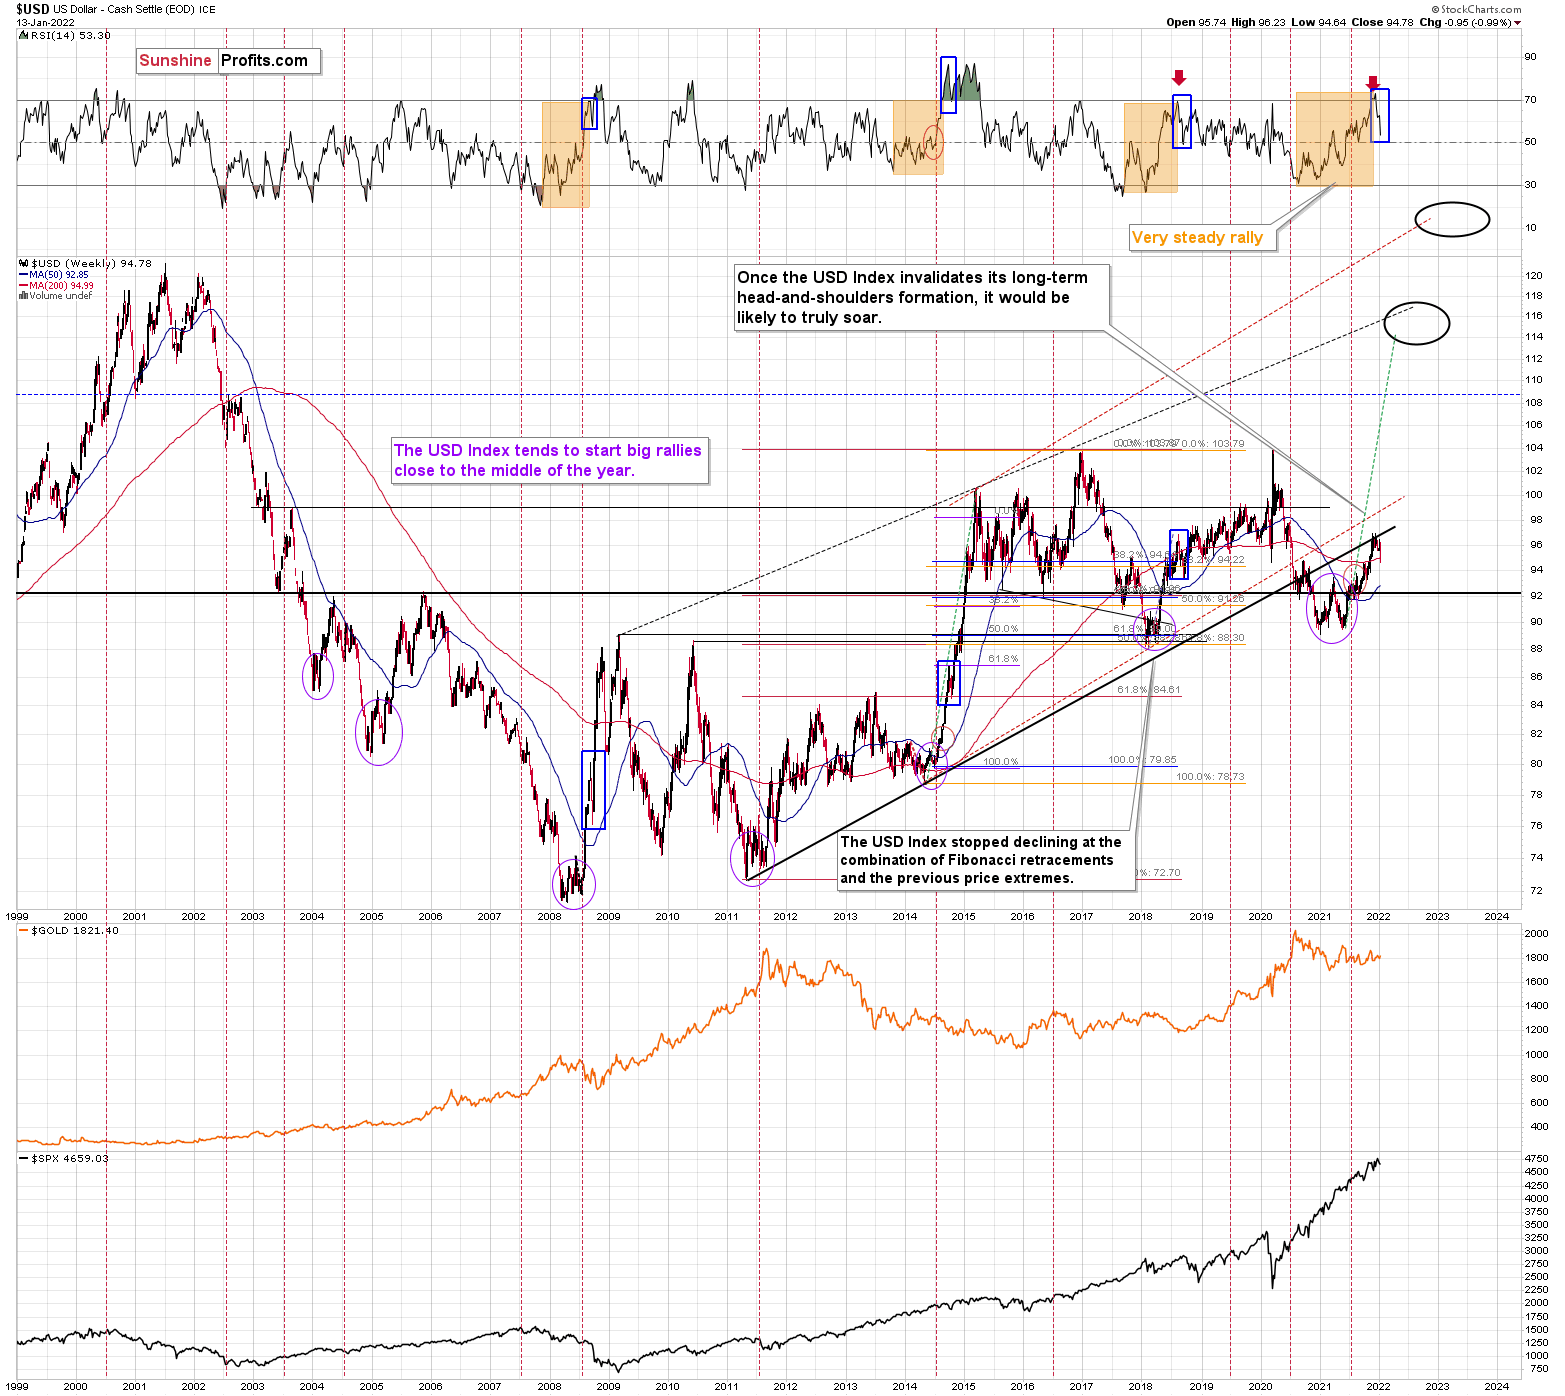
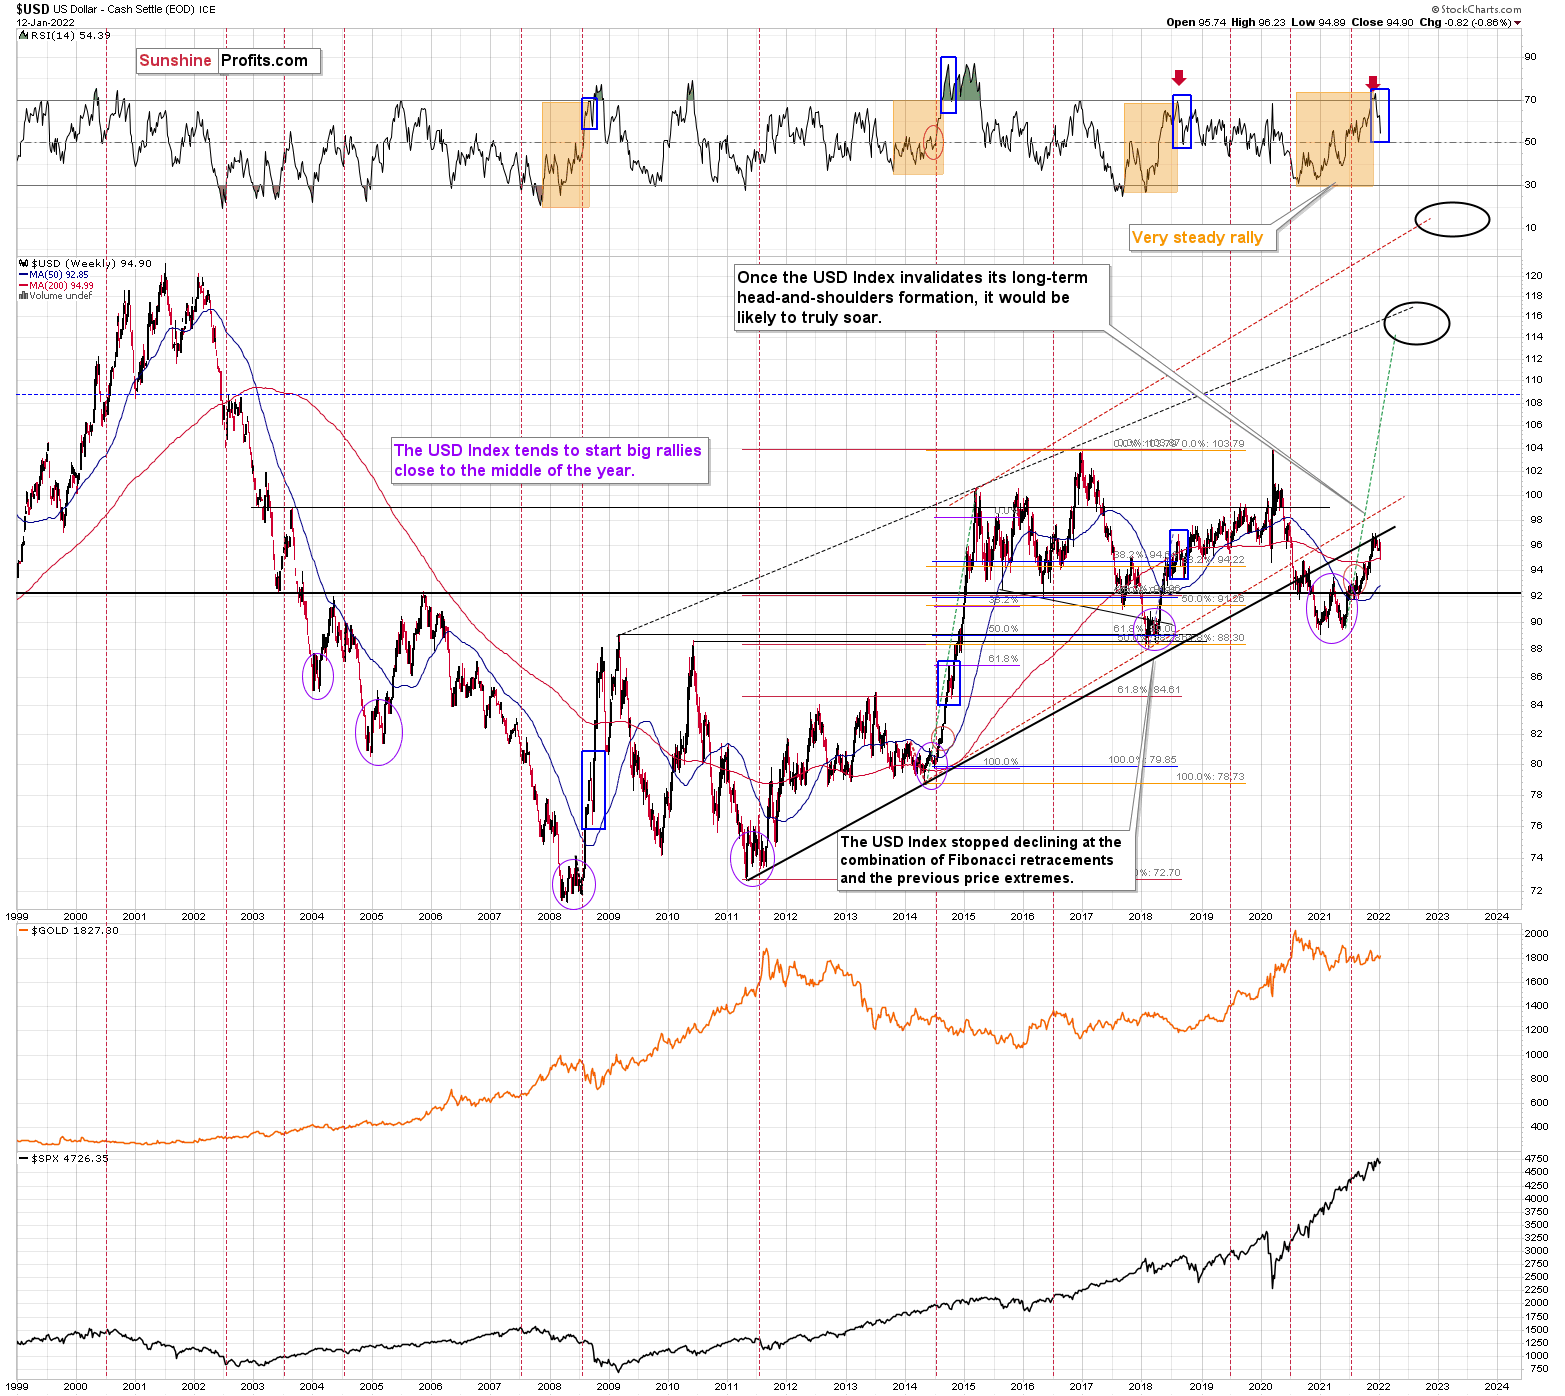
Moreover, if we zoom out and focus our attention on the USD Index’s weekly chart, an interesting pattern has developed. To explain, when the dollar basket’s weekly RSI (based on the weekly price changes) hit 70, I wrote the following:
Also, please note that the recent medium-term rally has been calmer than any major upswing witnessed over the last 20 years, where the USD Index’s RSI has hit 70. I marked the recent rally in the RSI with an orange rectangle, and I did the same with the second-least and third-least volatile of the medium-term upswings.
The sharp rallies in 2008 and 2014 were of much larger magnitudes. And in those historical analogies, the USD Index continued its surge for some time without suffering any material corrections.
As a result, the short-term outlook is more of a coin flip.
Consequently, the current [edit: previous] decline is not unexpected – it’s rather normal.
I marked additional situations on the chart below with orange rectangles – these were the recent cases when the RSI based on the USD Index moved from very low levels to or above 70. In all three previous cases, there was some corrective downswing after the initial part of the decline, but once it was over – and the RSI declined somewhat – the big rally returned and the USD Index moved to new highs.
I marked those declines in the RSI with blue rectangles, and I did the same thing for the current decline. As you can see, the size of the move lower is currently analogous to previous short-term corrections that were then followed by higher prices. This means that it’s quite likely over or very close to being over, and the medium-term rally can return any day now.
Indeed, the previous declines in the USD Index and the RSI correspond to what we saw recently. It seems that the verse is complete and that history has rhymed once again.
What is also important is that gold is responding to the USD’s strength.
Just as the USD Index rallied recently, gold declined after failing to rally to new yearly highs. In today’s pre-market trading, the USD Index is up by about 0.2, and gold is down by about $9. So, the odds are that if the USD Index continues its short-term rally (which is very likely), gold will respond by declining. The outlook for gold is thus bearish.
Silver, just like gold, didn’t move to new 2022 highs either. It bounced off its 50-day moving average, which proved to be important resistance once again. It seems that the silver forecast is bearish as silver appears ready to fall, just like gold is, especially now that we see weakness in the S&P 500 futures so far in today’s pre-market trading.
As a reminder, silver and mining stocks (especially junior mining stocks) are trading more in tune with the general stock market than gold does, so if the main stock indices fall, they will likely be affected to the greatest extent. Since it seems that the Fed has already made a fundamental U-turn regarding QE and interest rates, the situation is not looking good for the stock market.
Just like gold and silver, mining stocks failed to move to new 2022 highs, despite the fact that the USD Index recently moved to new 2022 lows. They too reacted to the USD’s small (so far) rally. The implications are bearish, as the USD Index is likely to continue to rally, triggering more declines across the precious metals sector.
Thank you for reading our free analysis today. Please note that the above is just a small fraction of the full analyses that our subscribers enjoy on a regular basis. They include multiple premium details such as the interim targets for gold and mining stocks that could be reached in the next few weeks. We invite you to subscribe now and read today’s issue right away.
Sincerely,
Przemyslaw Radomski, CFA
Founder, Editor-in-chief -
Dollar Bears Are Pushing Their Narrative. Will It Stick?
January 14, 2022, 9:22 AMWhile the USD has a slight cold and is sitting out this inning, the precious metals are enjoying some sun. But for how long before the tables turn?
While six Fed officials warned of forthcoming rate hikes and signaled that the March meeting could result in liftoff, the USD Index responded like they had announced another round of QE. What does it give?
Well, with the U.S. dollar stuck in consolidation mode after its recent sprint higher, gold, silver, and mining stocks have enjoyed the pullback. However, since the charts provide the most accurate clues regarding the future price action, the technicals signal that the USD Index’s weakness should be short-lived.
For example, while unfulfilled prophecies of the dollar’s demise in 2021 have been resurrected in 2022, the USD Index rallied off of expected support. After declining intraday on Jan. 13, the dollar basket reversed higher and ended the day with a bullish hammer candle. Moreover, the USD Index closed above its rising support line (the dashed line below) and its September 2020 high. As a result, the dollar found support near the levels that I outlined on Jan. 13. I wrote:
At the beginning of 2021, I wrote that the year was likely to be bullish for the USD Index, and my forecast for gold (and the rest of the precious metals sector) was bearish – against that of almost every one of my colleagues.
The USD Index ended 2021 about 6% higher, gold was down about 3.5%, silver was down almost 12%, the GDX ETF was down by about 9.5%, and the GDXJ ETF (proxy for junior mining stocks, my primary tool for shorting the precious metals sector in 2021 – I wasn’t shorting gold at any point in 2021) was down by about 21%.
What about this year? It’s a tough call to say how the entire year will go, but it seems to me that the USD Index will move higher, and we’ll see both in the PMs: a massive decline, and then a huge rally. It’s very likely to be a year to remember for anyone interested in trading gold, silver, and/or mining stocks and/or investing in them.
The USD Index declined to fresh 2022 lows – well below the previous January lows, and also below the December and late-November lows.
We see that the USD Index just (in overnight trading, so the move is not even close to being confirmed) moved a little below USDX’s rising support line based on the previous June and October 2021 lows. At the same time, the USDX is slightly below its late-2020 top and slightly above its November 2021 top.
In light of the situation on the long-term USDX chart, this combination of support levels is likely to trigger a rebound and the continuation of the medium-term rally.
Please see below:
The USD Index (USDX)
Moreover, if we zoom out and focus our attention on the USD Index’s weekly chart, an interesting pattern has developed. To explain, when the dollar basket’s weekly RSI (based on the weekly price changes) hit 70, I wrote the following:
Also, please note that the recent medium-term rally has been calmer than any major upswing witnessed over the last 20 years, where the USD Index’s RSI has hit 70. I marked the recent rally in the RSI with an orange rectangle, and I did the same with the second-least and third-least volatile of the medium-term upswings.
The sharp rallies in 2008 and 2014 were of much larger magnitudes. And in those historical analogies, the USD Index continued its surge for some time without suffering any material corrections.
As a result, the short-term outlook is more of a coin flip.
Consequently, the current decline is not unexpected – it’s rather normal.
I marked additional situations on the chart below with orange rectangles – these were the recent cases when the RSI based on the USD Index moved from very low levels to or above 70. In all three previous cases, there was some corrective downswing after the initial part of the decline, but once it was over – and the RSI declined somewhat – the big rally returned and the USD Index moved to new highs.
I marked those declines in the RSI with blue rectangles, and I did the same thing for the current decline. As you can see, the size of the move lower is currently analogous to previous short-term corrections that were then followed by higher prices. This means that it’s quite likely over or very close to being over, and the medium-term rally can return any day now.
Please see below:
Just as the USD Index took a breather before its massive rally in 2014, it seems that we saw the same recently. This means that predicting higher gold prices (or the ones of silver) here is likely not a good idea.
Continuing the theme, the eye in the sky doesn’t lie. And with the USDX’s long-term breakout clearly visible, the wind remains at the dollar’s back. Furthermore, dollar bears often miss the forest through the trees: with the USD Index’s long-term breakout gaining steam, the implications of the chart below are profound. And while very few analysts cite the material impact (when was the last time you saw the USDX chart starting in 1985 anywhere else?), the USD Index has been sending bullish signals for years.
Please see below:
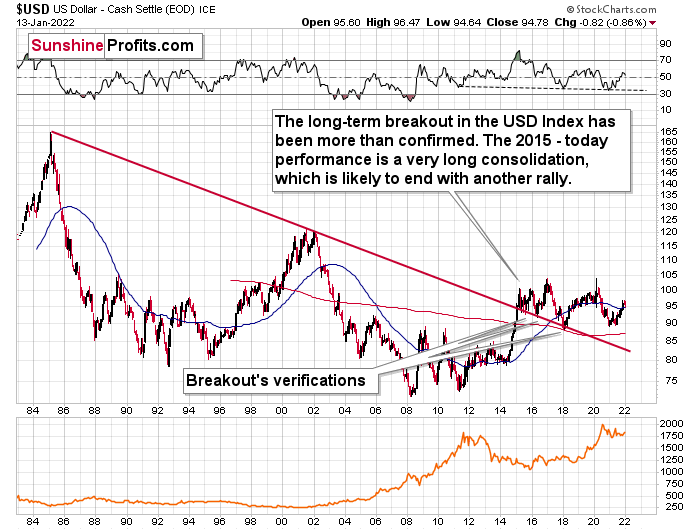
The bottom line?
With my initial 2021 target of 94.5 already hit, the ~98 - 101 target is likely to be reached over the medium term (and perhaps quite soon), mind, though: we’re not bullish on the greenback because of the U.S.’ absolute outperformance. It’s because the region is fundamentally outperforming the Eurozone, the EUR/USD accounts for nearly 58% of the movement of the USD Index, and the relative performance is what really matters.
In conclusion, 2022 looks a lot like 2021: dollar bears are out in full force and the ‘death of the dollar’ narrative has resurfaced once again. However, with the greenback’s 2021 ascent catching many investors by surprise, another re-enactment will likely materialize in 2022. Moreover, since gold, silver, and mining stocks often move inversely to the U.S. dollar, their 2022 performances may surprise for all of the wrong reasons. As such, while the dollar’s despondence is bullish for the precious metals, a reversal of fortunes will likely occur over the medium term. Given yesterday’s reversal in the USD Index, it’s likely also from the short-term point of view – we could see the reversal and the return of the USD’s rally and PMs’ decline any day or hour now.
Thank you for reading our free analysis today. Please note that the above is just a small fraction of the full analyses that our subscribers enjoy on a regular basis. They include multiple premium details such as the interim targets for gold and mining stocks that could be reached in the next few weeks. We invite you to subscribe now and read today’s issue right away.
Sincerely,
Przemyslaw Radomski, CFA
Founder, Editor-in-chief -
The USD Had a Slip-Up, but Gold Turned a Blind Eye to It
January 13, 2022, 8:47 AM“It’s my party and I’ll fall if I want to”, sang gold and kept its word. Although the dollar weakened, gold seemed reluctant to take advantage of it.
Now that was a big decline in the USD Index! What made gold yawn and why is it declining today? Because it doesn’t want to rally.
I’ve been writing this over and over again, and yet I’ll write it once more. Markets don’t move in a straight line up or down, and periodic corrections are natural. However, the way markets interact during those corrections tells us a lot about what’s likely to take place next, at least in the case of some markets.
The USD Index declined quite visibly yesterday and in today’s overnight trading.
The key questions are: so what, and if that was completely unexpected.
Starting with the latter, it wasn’t unexpected. It’s something in tune with gold’s long-term chart.
When the weekly RSI (based on the weekly price changes) for the USD Index hit 70, I wrote the following:
Also, please note that the recent medium-term rally has been calmer than any major upswing witnessed over the last 20 years, where the USD Index’s RSI has hit 70. I marked the recent rally in the RSI with an orange rectangle, and I did the same with the second-least and third-least volatile of the medium-term upswings.
The sharp rallies in 2008 and 2014 were of much larger magnitudes. And in those historical analogies, the USD Index continued its surge for some time without suffering any material corrections.
As a result, the short-term outlook is more of a coin flip.
Consequently, the current decline is not unexpected, it’s rather normal.
I marked additional situations on the above chart with orange rectangles – these were the recent cases when the RSI based on the USD Index moved from very low levels to or above 70. In all three previous cases, there was some corrective downswing after the initial part of the decline, but once it was over – and the RSI declined somewhat – the big rally returned and the USD Index moved to new highs.
I marked those declines in the RSI with blue rectangles, and I did the same thing for the current decline. As you can see, the size of the move lower is currently analogous to previous short-term corrections that were then followed by higher prices. This means that it’s quite likely over or very close to being over, and the medium-term rally can return any day now.
Moving back to USD’s short-term chart, we see that the USD Index just (in overnight trading, so the move is not even close to being confirmed) moved a little below USDX’s rising support line based on the previous June and October 2021 lows. At the same time, the USDX is slightly below its late-2020 top and slightly above its November 2021 top.
In light of the situation on the long-term USDX chart (as discussed above), this combination of support levels is likely to trigger a rebound and the continuation of the medium-term rally.
At the beginning of 2021, I wrote that the year was likely to be bullish for the USD Index, and my forecast for gold (and the rest of the precious metals sector) was bullish – against that of almost every one of my colleagues.
The USD Index ended 2021 about 6% higher, gold was down about 3.5%, silver was down almost 12%, the GDX ETF was down by about 9.5%, and the GDXJ ETF (proxy for junior mining stocks, my primary tool for shorting the precious metals sector in 2021 – I wasn’t shorting gold at any point in 2021) was down by about 21%.
What about this year? It’s a tough call to say how the entire year will go, but it seems to me that the USD Index will move higher, and we’ll see both in the PMs: a massive decline, and then a huge rally. It’s very likely to be a year to remember for anyone interested in trading gold, silver, and/or mining stocks and/or investing in them.
Let’s get back to the current situation.
The USD Index declined to fresh 2022 lows – well below the previous January lows, and also below the December and late-November lows. How did gold respond?
Gold rallied – but just by a mere $8.80. While gold got close to its early-January high, it didn’t manage to move above it. 2022 is still a down year for gold. Also, gold is clearly below its November 2021 highs, when it was trading close to $1,900.
Is gold showing strength here?
Absolutely not.
Gold is showing the opposite of strength. It’s weak and unwilling to react to the USD’s weakness. That’s exactly what I want to see as a bearish indication if I plan on entering a short position in the precious metals sector or when I’m timing an exit of a long position, or as a confirmation of a bearish narrative in general.
So, yes, of course I want to say that yesterday’s rally in gold was a bearish development. That’s the case, because gold should have rallied so much more, given what happened in the USD Index. Today’s overnight action makes the bearish case even clearer. The USDX is down a bit, but gold is down too, anyway. It simply doesn’t want to rally. Gold wants to decline instead.
Mining stocks and silver behaved similarly to gold yesterday – they didn’t move to, let alone above, their previous 2022 highs. Consequently, they confirm the indications for the gold vs. USD dynamic – they don’t point to something else.
Summing up, the outlook for silver, gold, and mining remains bearish for the medium term, and this week’s rally seems to be nothing more than a counter-trend breather.
Thank you for reading our free analysis today. Please note that the above is just a small fraction of the full analyses that our subscribers enjoy on a regular basis. They include multiple premium details such as the interim targets for gold and mining stocks that could be reached in the next few weeks. We invite you to subscribe now and read today’s issue right away.
Sincerely,
Przemyslaw Radomski, CFA
Founder, Editor-in-chief


Gold Investment News
Delivered To Your Inbox
Free Of Charge
Bonus: A week of free access to Gold & Silver StockPickers.
Gold Alerts
More-
Status
New 2024 Lows in Miners, New Highs in The USD Index
January 17, 2024, 12:19 PM -
Status
Soaring USD is SO Unsurprising – And SO Full of Implications
January 16, 2024, 8:40 AM -
Status
Rare Opportunity in Rare Earth Minerals?
January 15, 2024, 2:06 PM

