

-
Gold Investment Update: Let’s Talk Inflation, Is a “Soft Landing” Still Possible?
April 1, 2022, 7:49 AMWhile the general stock market tumbled on Mar. 31, the PMs still remain relatively elevated. However, this week brought about several developments that impair the PM's medium-term fundamental outlooks.
For example, inflation remains red-hot, as the latest corporate earnings calls show executives fretting about input and wage pressures. Moreover, when the only choices are raising prices or eroding their profit margins, it's a lose-lose situation for the financial markets.
On the one hand, absorbing the costs results in weak quarterly earnings, and investors often punish companies that underperform. On the other hand, raising prices further stokes inflation and increases the chance that the Fed's swift rate hike cycle will push the U.S. economy into recession. As a result, long-only investors face an extremely uncertain future, and the Fed's margin for error is extremely low.
Furthermore, the U.S. labor market remains on fire. With near all-time high JOLTS job openings hitting the wire this week, The Confidence Board's jobs are "plentiful" metric hitting an all-time high, and ADP's private payrolls also outperforming consensus expectations, the U.S. employment picture remains rosy. As a result, the Fed should light plenty of hawkish fireworks over the next few months.
Speaking of which, more Fed officials made the rounds this week. And with their hawkish rhetoric still steadfast, the S&P 500 and the PMs remain in fundamental denial.
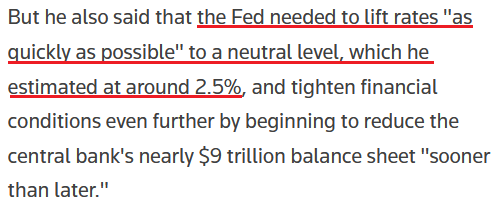
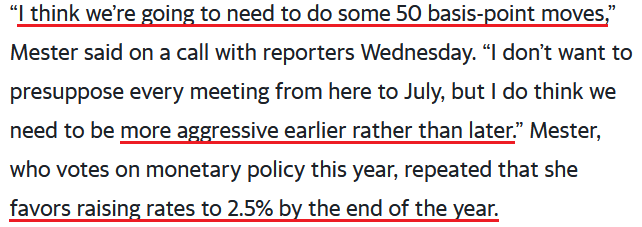
For example, Philadelphia Fed President Patrick Harker said on Mar. 29 that "I am open to sending a strong signal with a 50 basis point increase at the next meeting." Moreover, while he added that "I have penciled in seven… 25 basis point increases for this year," and more or less will depend on the path of inflation, a neutral rate of ~2.5% implies roughly 10 rate hikes over the next several months.
Please see below:
 Source: Reuters
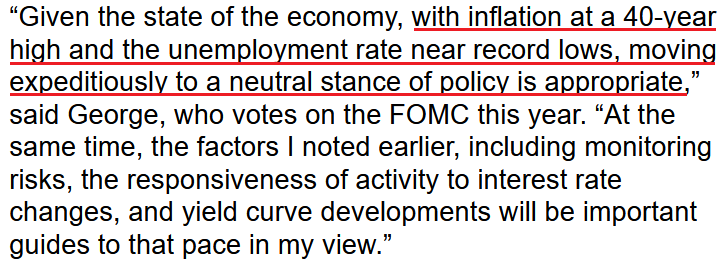
Likewise, Kansas City Fed President Esther George said on Mar. 30 that “The balance sheet will need to decline significantly,” as she cited the “distortive effects” the Fed’s nearly $9 trillion in holdings have on the financial markets. “The interaction of higher policy rates with a large balance sheet will need to be considered.”
Moreover, channeling her inner Jerome Powell, she also used the term “expeditiously” when describing the future path of interest rates.
Please see below:
 Source: Bloomberg
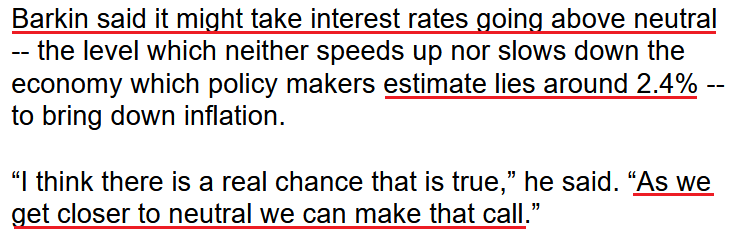
Making three of a kind, Richmond Fed President Thomas Barkin said on Mar. 30 that he’s “open to” a 50 basis point rate hike in May. Moreover, with his perception of neutral at 2.4% (roughly 10 rate hikes), he sounded quite committed to the path ahead.
Please see below:
 Source: Bloomberg
As a result, with Barkin’s assessment of “as we get closer to neutral we can make that call,” it’s important to remember that there is a considerable distance from 0.25% (one rate hike where we are now) to 2.4%. As such, while Fed officials make their points loud and clear, the fundamental ramifications of getting to neutral will likely have profound impacts on the S&P 500 and the PMs.
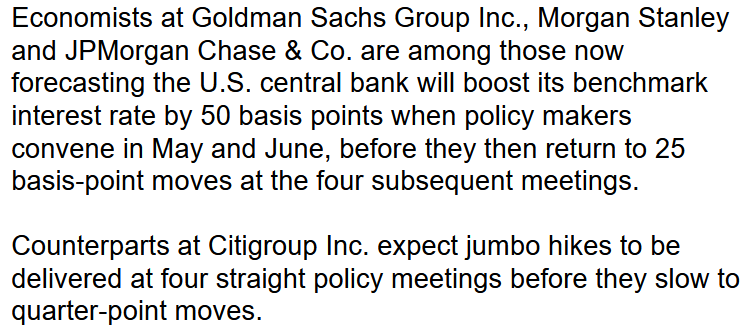
To that point, with Wall Street now aligned with our expectations for future Fed policy, investment banks have increased their rate hike estimates for the coming months.
Please see below:
 Source: Bloomberg
Moreover, while Bank of America has been in the hawkish camp for some time, Chief Global Economist Ethan Harris wrote that “The Fed has accepted that it’s behind the curve and will be emboldened by the resilience of the economy and the financial markets. The remaining question is whether it will be willing to impose serious pain on the economy to rein in inflation.”
Furthermore, while he added that the Fed could engineer a growth recession next year that brings inflation down to 2.6% and modestly pushes up unemployment, he cautioned, “that is at the optimistic end of outcomes. The main risks are to the downside.”
To that point, with U.S. Treasury yields already screaming at the Fed to tighten, inversions are popping up everywhere. And with the inflationary quagmire creating a lose-lose situation, the bond market highlights the anxiety that should be confronting the Fed.
Please see below:
 Source: Investing.com
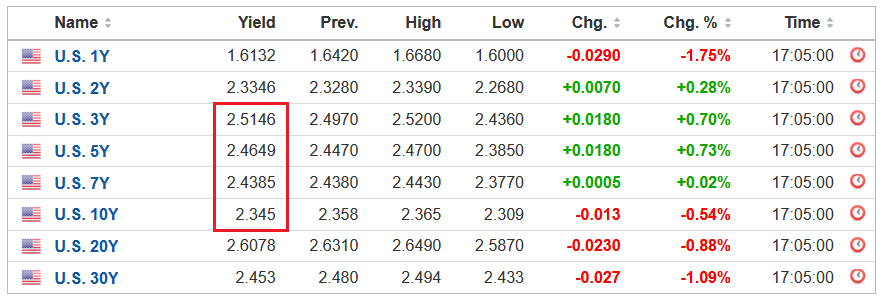
To explain, the red box above highlights how the U.S. 3-Year, 5-Year and 7-Year Treasury yields ended the Mar. 31 session higher than the U.S. 10-Year Treasury yield. As a result, those curves have inverted, which is the opposite of what the Fed wants.
Conversely, an upward sloping yield curve results in longer-dated maturities having higher interest rates. And this occurs because longer maturities have more duration risk, and therefore, investors should be compensated with higher yields.
However, with the three-year at ~2.51% and the 10-year at ~2.35%, the short-end of the curve is pricing in rampant rate hikes, while the medium to long-end of the curve is pricing in a material slowdown in growth. As a result, long-end bond investors are correctly (likely) predicting that the Fed’s expeditious rate hike cycle will scar the U.S. economy. Thus, the lose-lose situation should have drastic implications for risk assets over the medium term.
For your reference, the 10-2 spread is also close to inverting as well, with the U.S. 2-Year Treasury yield ending the Mar. 31 session at ~2.33%. However, please note that the ramifications don’t imply lower interest rates. In fact, the U.S. 10-Year Treasury yield often climbs when the Fed hikes interest rates. However, short-term interest rates may increase at a faster pace. To explain, I wrote on Jan. 19:
If the U.S. 10-Year Treasury yield declines in 2022, it will defy nearly 40 years of historical precedent.
Please see below:
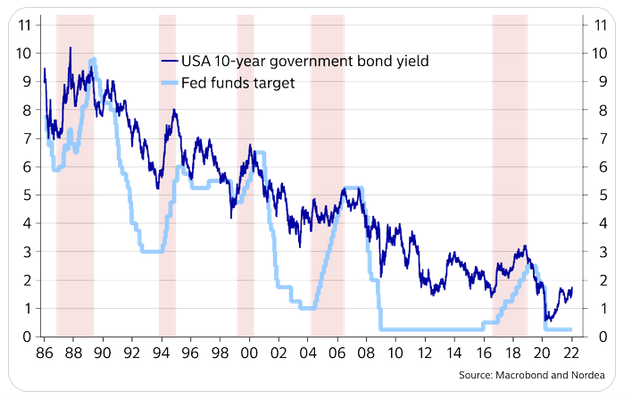
To explain, the dark blue line above tracks the U.S. 10-Year Treasury yield, while the light blue line above tracks the U.S. Federal Funds Rate. If you analyze the latter's ascents starting in 1987, 1993, 1999, 2004 and 2017, you can see that the U.S. 10-Year Treasury yield always rallies when the Fed increases the U.S. Federal Funds Rate.
Moreover, the U.S. 10-Year Treasury yield doesn't usually peak until after the Fed finishes its rate hike cycles. For example, if you focus your attention on the light blue line's highs, notice how the U.S. 10-Year Treasury yield keeps rising until the Fed stops hiking? And with a rate hike in March likely a done deal and Fed officials projecting anywhere from two to four rate hikes in 2022, is this time really different?
To that point, with the U.S. 2-Year Treasury yield rallying hard in 2022, history implies the Fed will play catch-up over the medium term.
Please see below:
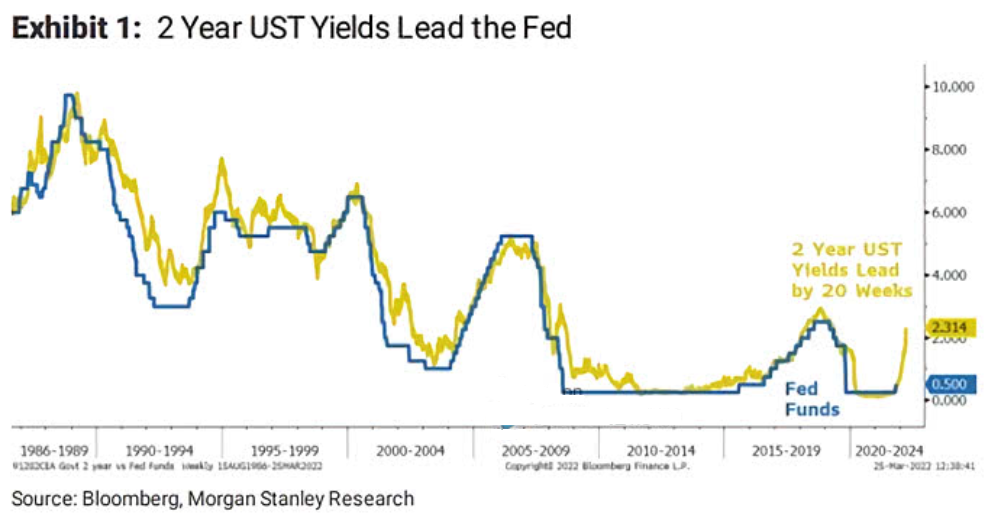
To explain, the gold line above tracks the U.S. 2-Year Treasury yield, while the blue line above tracks the U.S. federal funds rate. If you analyze the right side of the chart, you can see that the former has materially outperformed the latter.
However, Morgan Stanley found that the U.S. 2-Year Treasury yield often leads the U.S. federal funds rate by 20 weeks. As such, with the former already moving sharply higher, a dovish pivot by the Fed would also defy nearly 40 years of historical precedent.
Likewise, with U.S. economic data still on solid ground, the Fed should remain on autopilot for the foreseeable future. For example, while it’s a lagging indicator, and therefore less relevant, the U.S. Bureau of Economic Analysis (BEA) revealed on Mar. 30 that U.S. real GDP “increased at an annual rate of 6.9 percent in the fourth quarter of 2021.” For context, U.S. real GDP was running at roughly 2% pre-COVID-19.
Please see below:
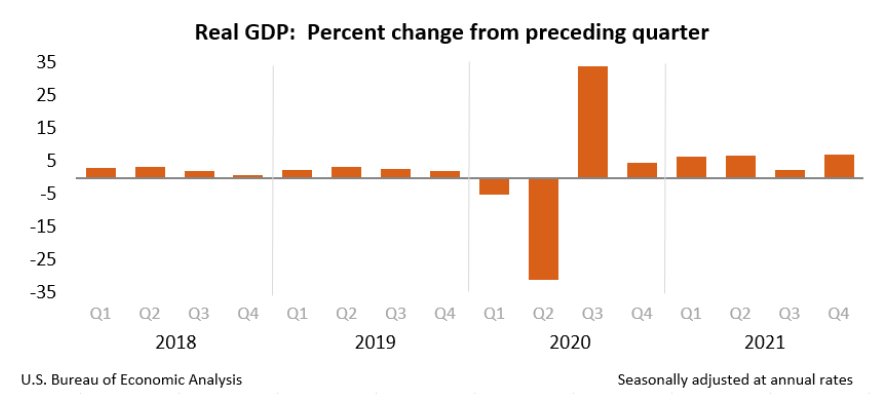
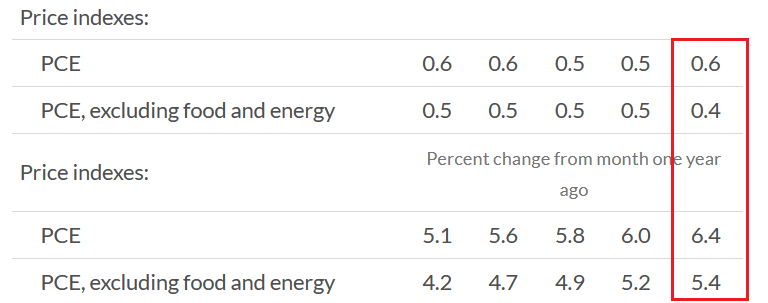
On top of that, the BEA revealed on Mar. 31 that the Personal Consumption Expenditures (PCE) Index (the Fed’s main inflation gauge) increased by a new 2022 high of 6.4% year-over-year (YoY). For context, the values at the top represent month-over-month (MoM) percentage changes, while the values at the bottom represent YoY percentage changes.
Please see below:
 Source: BEA
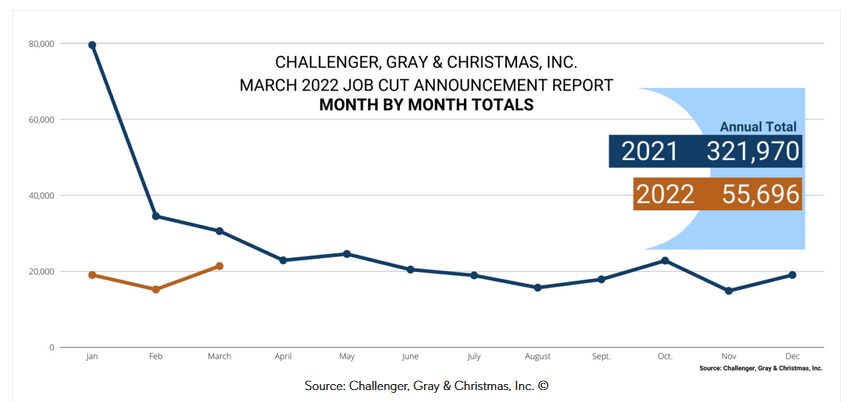
Finally, Challenger, Gray, and Christmas released their jobs cuts data on Mar. 31. In a nutshell: it tallies how many employees were fired in March. And while cuts increased by 40.3% MoM, they still declined by 30% YoY. As a result, the data does little to cool the red-hot U.S. labor market. For context, the report also stated:
“In the first quarter of 2022, employers announced 55,696 cuts, down 62% from the 144,686 cuts announced through the same period in 2021. It is the lowest quarterly total since the third quarter of 2021, when 52,560 cuts were recorded.”
Please see below:
The bottom line? While some investors think the Fed can engineer a “soft landing,” the data suggests otherwise. Moreover, with job openings, retail sales, and input and wage inflation tracking well ahead of their pre-pandemic trends, normalizing these metrics requires sharp declines. Thus, reducing annualized inflation from ~8% to 2% requires much more demand destruction than reducing it from 4% to 2%. As a result, investors underestimate the medium-term economic slowdown that will likely unfold during the Fed’s accelerated rate hike cycle.
What to Watch for Next Week
With another full slate of U.S. economic data releases next week, the most important are as follows:
- Apr. 4: The Confidence Board Employment Trends Index (ETI)
With the Fed still fixated on employment, the ETI is a leading indicator of the health of the U.S. labor market.
- Apr. 5: The Institute for Supply Management (ISM) and S&P Global services PMIs.
As a leading indicator of service sector activity, data from the ISM and S&P Global provides a window into the performance of the businesses hardest hit by the pandemic. Moreover, with the service sector poised to grab the inflation baton from manufacturing, it will be interesting to see how these companies respond to the pricing pressures.
All in all, economic data releases impact the PMs because they impact monetary policy. Moreover, if we continue to see higher employment and inflation, the Fed should keep its foot on the hawkish accelerator. And if that occurs, the outcome is profoundly bearish for the PMs.
Thank you for reading our free analysis today. Please note that the above is just a small fraction of the full analyses that our subscribers enjoy on a regular basis. They include multiple premium details such as the interim target for gold that could be reached in the next few weeks. We invite you to subscribe now and read today’s issue right away.
Sincerely,
Przemyslaw Radomski, CFA
Founder, Editor-in-chief -
Gold Investment Update: Never Underestimate a Hawk. Fed’s Moves May Strike Gold
March 25, 2022, 11:07 AMWhile the PMs remain elevated and optimism echoes, momentum investors have little use for medium-term technicals or fundamentals. However, with the Fed's hawkish agenda poised to collide with investors' over-positioning, the PMs should suffer mightily when the next bout of volatility erupts.
To explain, this week was filled with Fed officials urging investors to slow their roll. Whether it's Kashkari, Barkin, Waller, Bullard, Bostic, Daly or Powell, they all warned about substantial interest rate increases over the next several months.
Furthermore, with the chorus expanding later in the week, Cleveland Fed President Loretta Mester said on Mar. 23 that investors should prepare for several rate hikes and quantitative tightening (QT) in the coming months.
“We have told the markets that we would let them know what the balance sheet process would look like,” said Mester. “I think given the situation we’re in and the communications that Chair Powell has already made about the balance-sheet process, I don’t have concerns that that would be destabilizing.”
Moreover, Mester expects 10 rate hikes by the end of 2022 (2.5% = 10 hikes of 0.25%).
Please see below:
 Source: Bloomberg
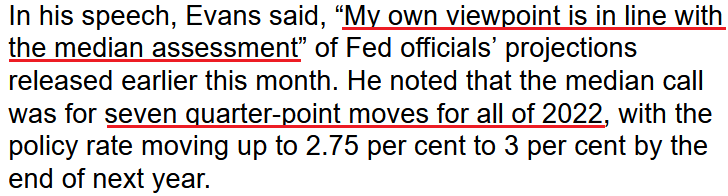
Singing a similar tune, Chicago Fed President Charles Evans said on Mar. 24: “We want to be careful, we want to be humble and nimble, and get to neutral before too long – maybe 50 helps, I’m open to that.”
Either way, he added: “I would be comfortable with each meeting increasing by a quarter point,” which implies six more rate hikes (seven in total) by the end of 2022.
Please see below:
 Source: Bloomberg
As a result, we’ve had nine Fed officials tell investors this week that seven to 12 rate hikes are coming over the next nine months. While the financial markets have taken the hawkish rhetoric in stride, history implies that the fundamental implications contrast with the sanguine sentiment. To explain, I wrote on Mar. 23:
When Fed officials dial up the hawkish rhetoric, their “messaging” is supposed to shift investors’ expectations. As such, the threat of raising interest rates is often as impactful as actually doing it. However, when investors don’t listen, the Fed has to turn the hawkish dial up even more. If history is any indication, a calamity eventually unfolds.
Please see below:
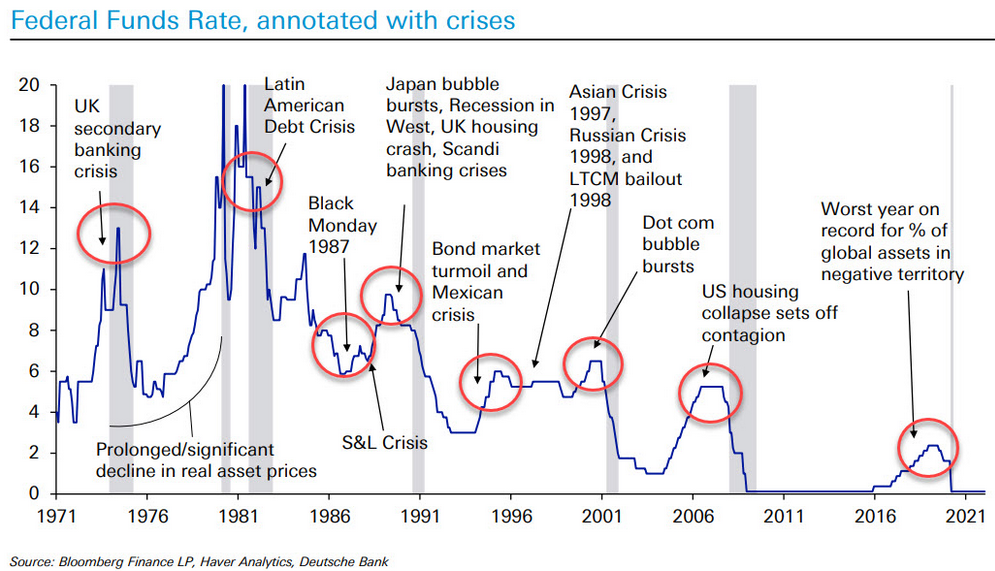
To explain, the blue line above tracks the U.S. federal funds rate, while the various circles and notations above track the global crises that erupted during the Fed’s rate hike cycles. As a result, standard tightening periods often result in immense volatility.
However, with investors refusing to let asset prices fall, they’re forcing the Fed to accelerate its rate hikes to achieve its desired outcome (calm inflation). As such, the next several months could be a rate hike cycle on steroids.
To that point, investors may take solace in the belief that the Fed won’t follow through on its hawkish promises. As such, why not buy the PMs and front-run the Fed’s dovish pivot? However, I’ve warned for months that the U.S. economy remains in solid health. As a result, the probability of a dovish 180 continues to dwindle. For context, new U.S. home sales dipped on Mar. 23, as higher interest rates reduced demand.
Please see below:
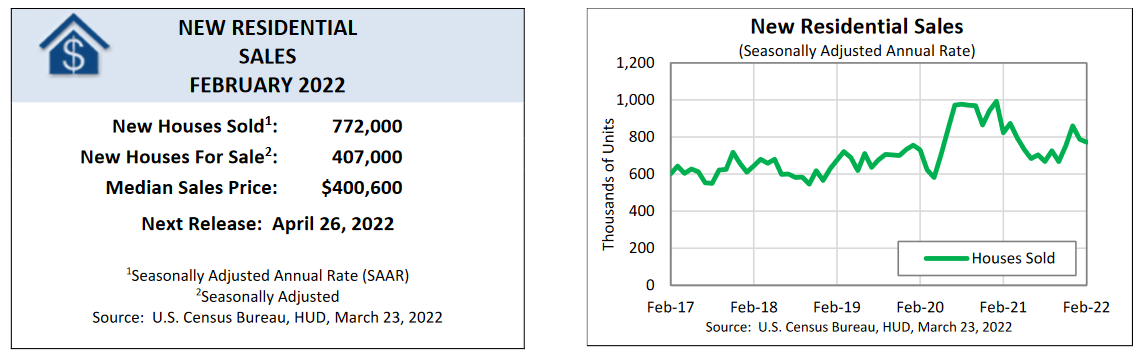
However, the average selling price of a U.S. home increased to an all-time high of $511,000 in February. As a result, shelter has never been more unfordable in the U.S., and lower-for-longer interest rates have been the primary driver of housing inflation.
Please see below:
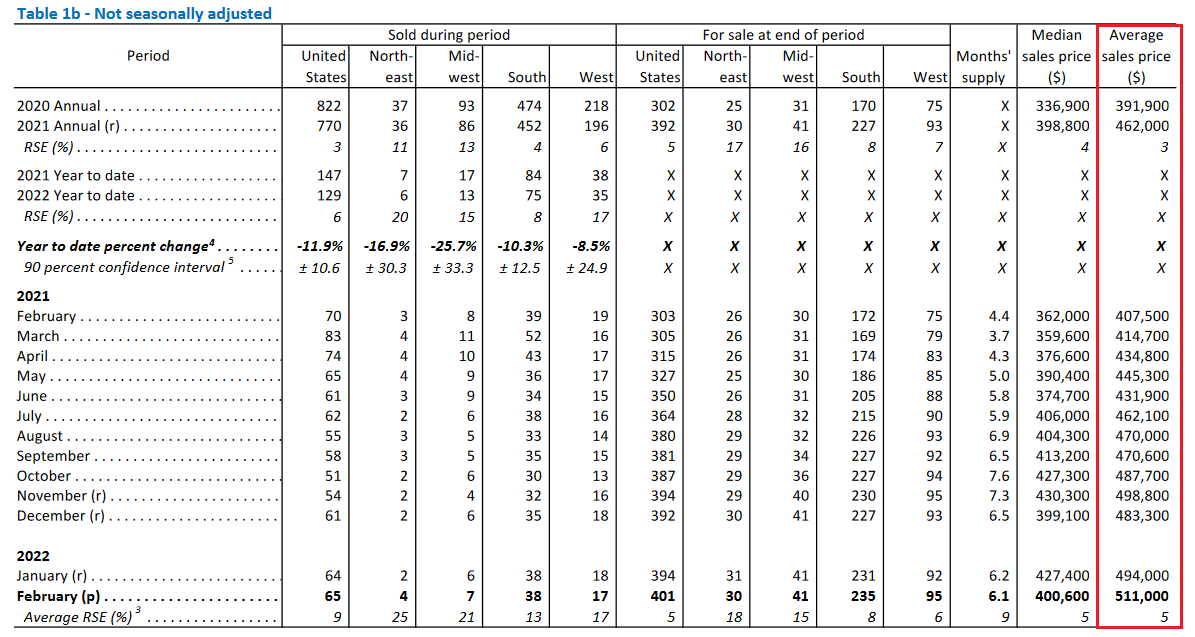 Source: U.S. Census Bureau
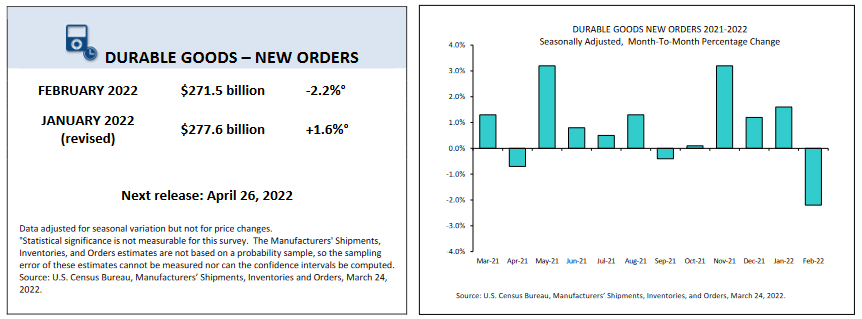
 Likewise, U.S. durable goods orders also slipped on Mar. 24. However, the decline followed four-consecutive months of gains.
Please see below:
More importantly, though, IHS Markit’s U.S. Composite PMI was the data point we waited for all week. For context, IHS Markit completed its merger with S&P Global, so the data goes by the latter’s name now. However, with the data acting as a leading indicator of U.S. economic activity, the results often predict the direction of future U.S. government data.
What was the verdict? Well, aligning with what I’ve been warning about for many months, S&P Global’s U.S. Composite PMI increased from 55.9 in February to 58.5 in March, as “manufacturers and service providers registered stronger upturns in activity, largely supported by pent-up demand and the easing of COVID-19 restrictions.”
Please see below:
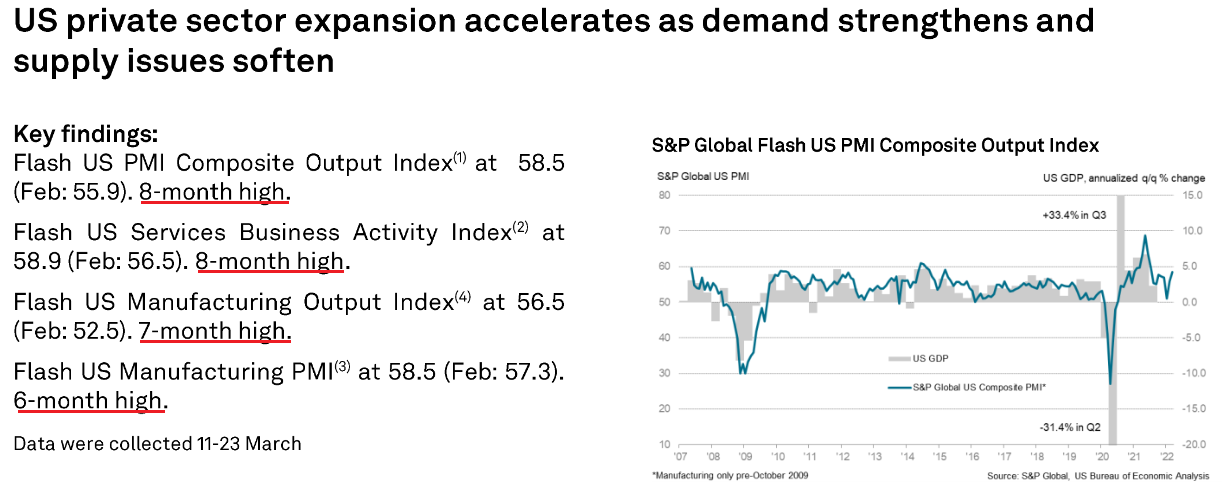
On top of that, the report revealed:
"March data showed a marked rise in new orders at businesses, as an upturn in client demand strengthened for the second month running to reach a nine-month high…. Alongside more favorable domestic demand conditions, new export orders rose at a quicker pace at the end of the first quarter."
In addition:
"The rate of overall job creation was the sharpest since April 2021, as manufacturers and service providers alike recorded steeper upturns in employment."
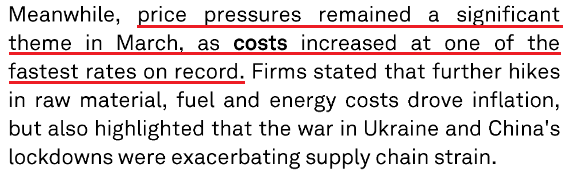
Moreover, with resilient demand colliding with rising commodity prices, the inflationary results still contrast with the Fed's goals.
Please see below:
 Source: S&P Global
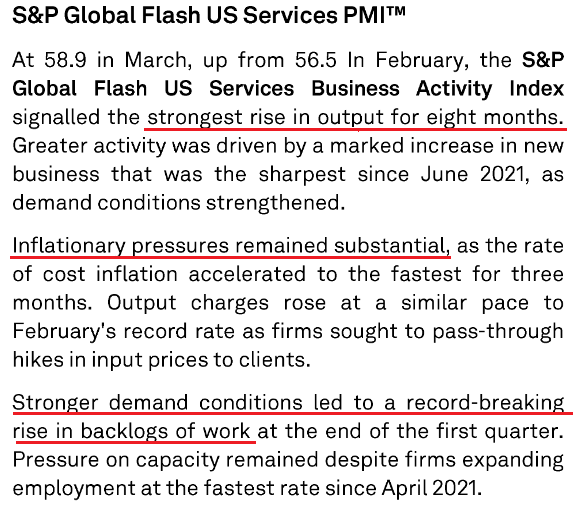
In addition, while the U.S. service sector has lagged manufacturing due to the restrictions imposed during the spread of the Delta and Omicron variants, many U.S. states have abandoned their COVID-19 policies. As a result, services are gaining momentum and have grabbed the inflationary baton.
Please see below:
 Source: S&P Global
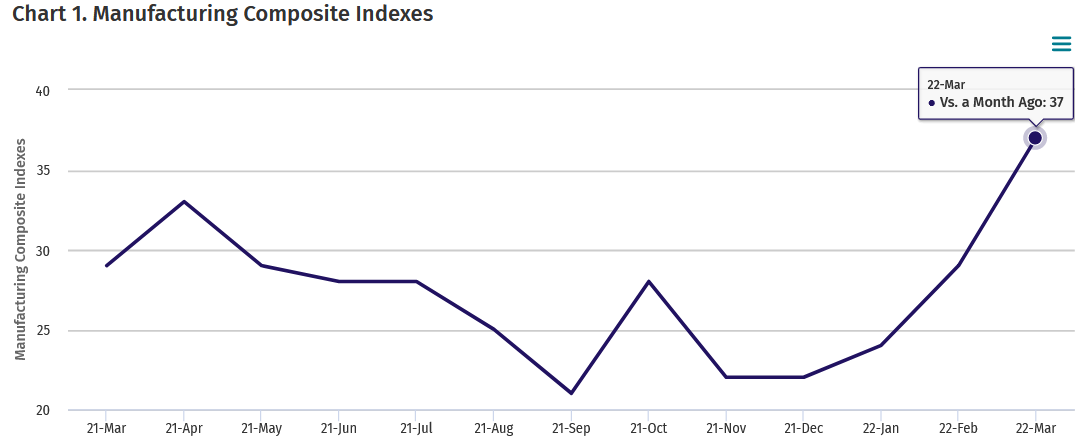
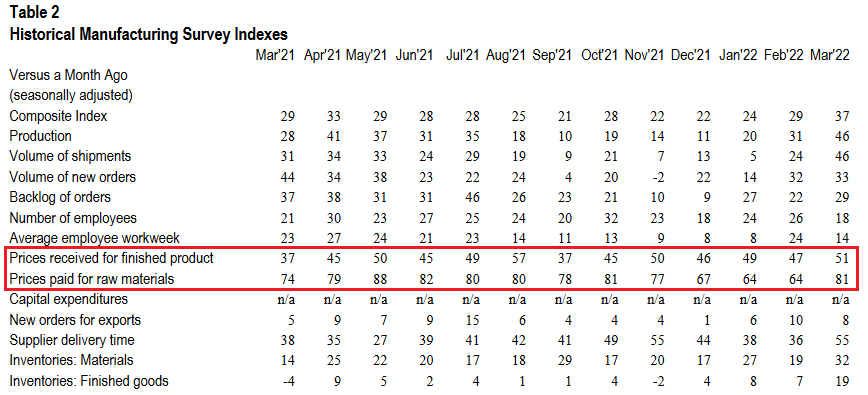
As a result, does this seem like an economic environment where the Fed will refrain from raising interest rates? As further evidence, the Kanas City Fed released its Tenth District Manufacturing Activity Survey on Mar. 24., and with the headline index increasing from 29 in February to 37 in March, the report revealed that “Tenth District manufacturing activity reported record high growth and expectations for future activity remained solid.”
Please see below:
 Source: KC Fed
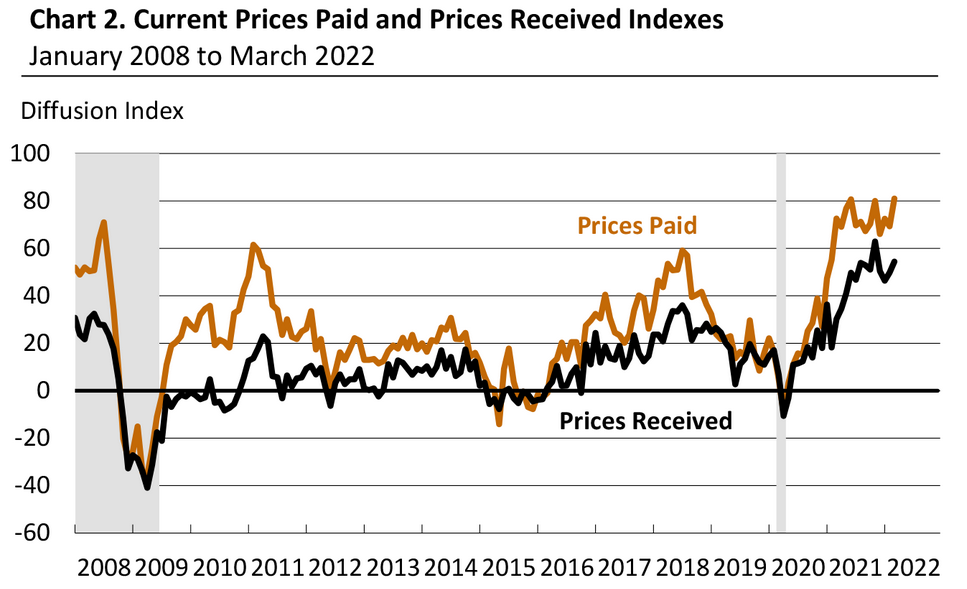
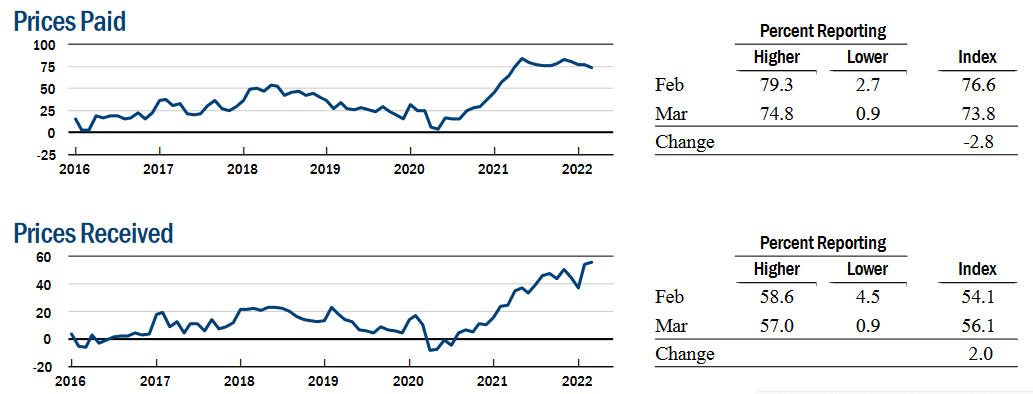
Moreover, the KC Fed’s prices paid index increased from 64 in February to 81 in March, while its prices received index increased from 47 to 51. As a result, inflation trends are not moving in the Fed’s desired direction.
Please see below:
 Source: KC Fed
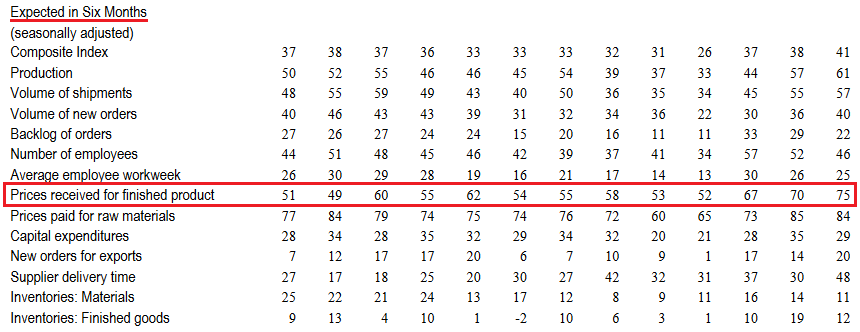
On top of that, not only did current inflationary pressures increase month-over-month (MoM) in March, but the KC Fed’s index of manufacturers’ six-month expectations for prices received increased to an all-time high of 75.
Please see below:
 Source: KC Fed
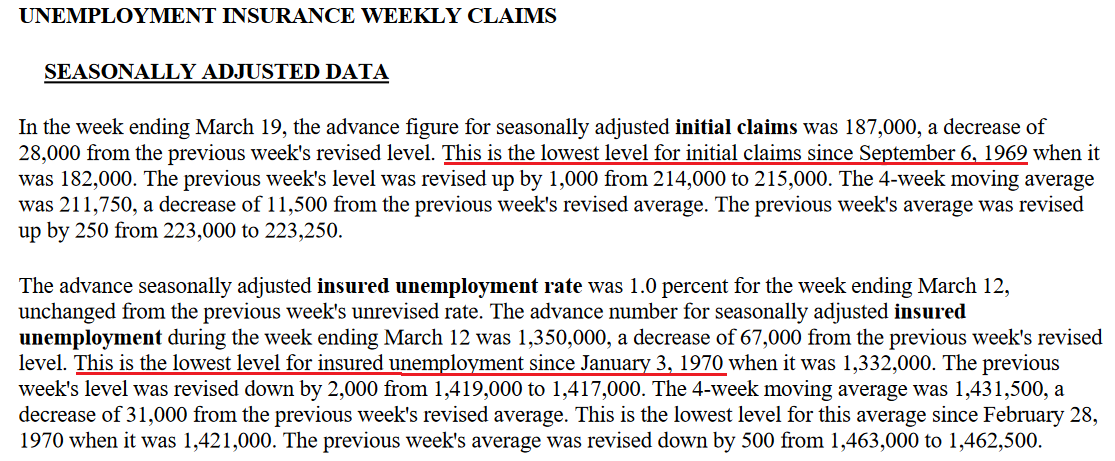
Finally, the U.S. Department of Labor (DOL) released its weekly unemployment data on Mar. 24. With initial unemployment claims hitting a new post-pandemic low of 187,000, the U.S. labor market also meets the Fed’s threshold to raise interest rates.
 Source: DOL
The bottom line? While some investors think that the Fed is all bark and no bite, the data suggests otherwise. With demand resilient, inflation abundant, unemployment falling, and Fed officials warning of coming rate hikes, the next several months should elicit plenty of hawkish fireworks.
Likewise, the data we received this week shows that inflation is still increasing MoM. Moreover, the PMI report from S&P Global shows that U.S. economic activity has also strengthened MoM. Furthermore, with the warm weather approaching, the summer months should increase consumer mobility and foster stronger economic growth relative to the winter periods. As such, the good news should continue to flow, and that’s bullish for hawkish Fed policy, the USD Index, and U.S. Treasury yields, and bearish for the PMs.
What to Watch for Next Week
With another full slate of U.S. economic data releases next week, the most important ones are as follows:
- Mar. 28: Dallas Fed manufacturing index
Like the data covered above, the Dallas Fed manufacturing index will let us know how output, employment, and inflation are behaving in Texas.
- Mar. 29: The Confidence Board consumer confidence, JOLT job openings, Dallas Fed services index
With interest rates on the rise and inflation still raging, it will be interesting to see how the dynamics have affected consumers' psyches as well as businesses' hiring expectations. Likewise, the data from the Dallas Fed will provide a window into the service sector recovery in Texas.
- Mar. 30: ADP employment, Q4 GDP
While ADP's data is often a poor predictor of U.S. nonfarm payrolls, it still provides valuable insights into private employers' hiring activity. In addition, Q4 GDP is a lagging indicator, and investors are forward-looking. As a result, the data isn't as impactful as the monthly surveys. However, it's still important to monitor.
- Mar. 31: PCE Index, Challenger job cuts, Chicago PMI
The PCE Index is the Fed's primary inflation gauge, so more hot prints will only increase officials' hawkish dispositions. Likewise, Challenger job cuts will let us know how many U.S. citizens have lost their jobs, while the Chicago PMI will let us know how output, employment, and inflation are behaving in Illinois.
- Apr. 1: U.S. nonfarm payrolls, ISM manufacturing PMI
Like the PCE Index, continued outperformance of U.S. nonfarm payrolls will only increase Fed officials' hawkish estimates. In addition, it will be interesting to see if ISM's manufacturing PMI confirms or contrasts with S&P Global's data outlined above.
All in all, economic data releases impact the PMs because they impact monetary policy. Moreover, if we continue to see higher employment and inflation, the Fed should keep its foot on the hawkish accelerator. If that occurs, the outcome is profoundly bearish for the PMs.
Thank you for reading our free analysis today. Please note that the above is just a small fraction of the full analyses that our subscribers enjoy on a regular basis. They include multiple premium details such as the interim target for gold that could be reached in the next few weeks. We invite you to subscribe now and read today’s issue right away.
Sincerely,
Przemyslaw Radomski, CFA
Founder, Editor-in-chief -
Gold Investment Update: Gold and Silver Turn a Deaf Ear to Fed’s Hawkish Threats
March 18, 2022, 11:24 AMWhile the week was full of drama, the Fed and the implications of its future monetary policy was the most important fundamental development to hit the newswire.
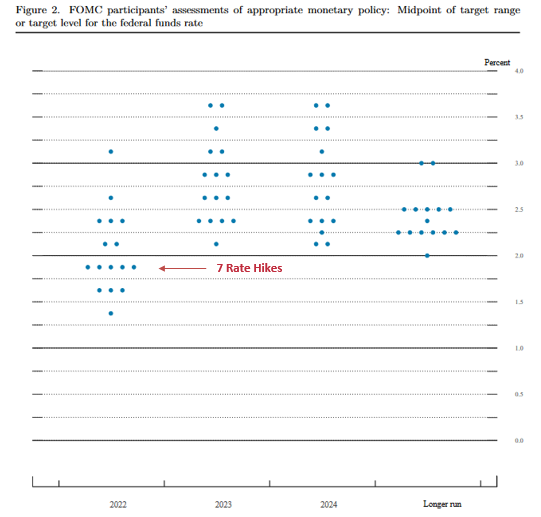
For example, the FOMC announced a 25 basis point rate hike on Mar. 16, and the median projection (the five dots below) is for six more rate hikes in 2022 (seven in total). Moreover, with six meetings left on the FOMC’s 2022 schedule, it implies consecutive rate hikes for the next several months.
Please see below:
 Source: U.S. Fed
Moreover, with FOMC officials’ median estimate increasing from three rate hikes in December to seven rate hikes in March, the hawkish ante has been upped with every new release of their Summary of Economic Projections (SEP).
However, while the developments are fundamentally bullish for the USD Index and U.S. Treasury yields, the PMs are behaving as if none of that matters. Moreover, with the Russia-Ukraine conflict distracting gold, silver, and mining stocks from domestic fundamental realities, their recent strength is a function of momentum, not medium-term technicals or fundamentals.
To explain, I spent a lot of time covering the S&P Goldman Sachs Commodity Index (S&P GSCI) this week and noted that it could act as the fundamental canary in the coal mine.
For context, the S&P GSCI contains 24 commodities from all sectors: six energy products, five industrial metals, eight agricultural products, three livestock products, and two precious metals. However, energy accounts for roughly 54% of the index’s movement.
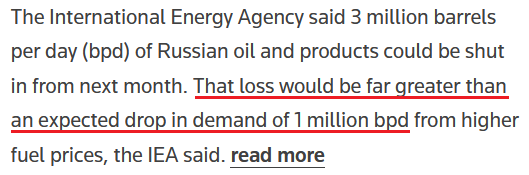
Furthermore, with the index rising and falling sharply in a matter of days, the PMs have been along for the ride. However, with the International Energy Agency (IEA) lighting a fire under crude on Mar. 17, it released a report outlining the potential shortfall of Russian oil in April. It stated:
“The prospect of large-scale disruptions to Russian oil production is threatening to create a global oil supply shock. We estimate that from April, 3 mb/d of Russian oil output could be shut in as sanctions take hold and buyers shun exports. OPEC+ is, for now, sticking to its agreement to increase supply by modest monthly amounts. Only Saudi Arabia and the UAE hold substantial spare capacity that could immediately help to offset a Russian shortfall.”
With financial markets all about expectations, the potential for a shortfall sent WTI 6.95% higher on Mar. 17.
Please see below:
 Source: Reuters
Moreover, since energy accounts for roughly 54% of the S&P GSCI’s movement and momentum begets momentum, the PMs are borrowing optimism and ignoring fundamentals. However, the short-term phenomena will likely result in sharp drawdowns over the medium term.
Please see below:
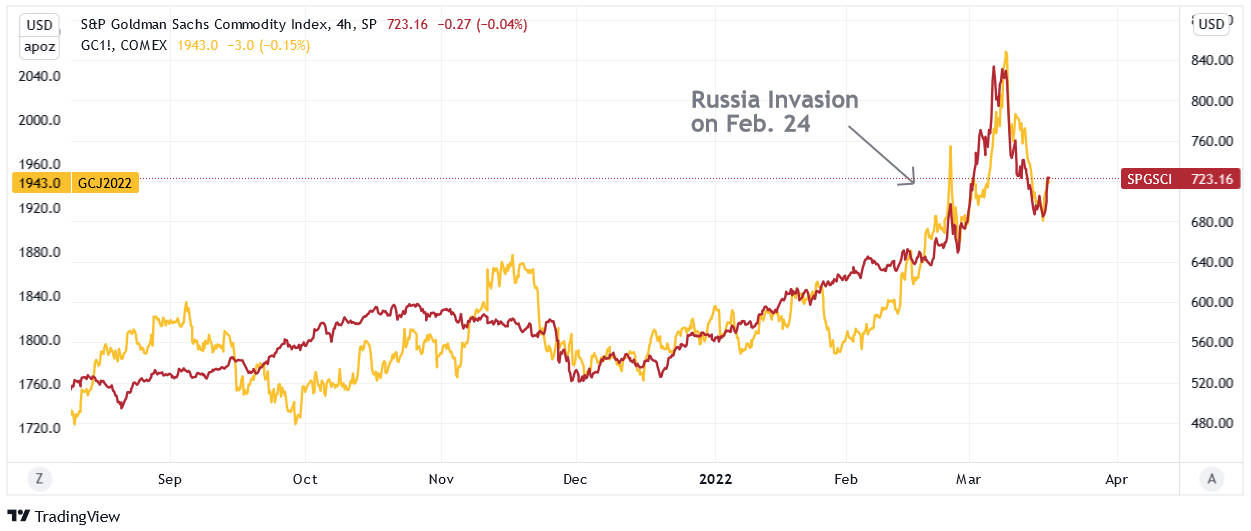
To explain, the red line above tracks the four-hour movement of the S&P GSCI, while the gold line above tracks the gold futures price. If you analyze their behavior before Russia invaded Ukraine, you can see little to no connection.
However, if you focus your attention on the price action since the Feb. 24 invasion, you can see that it’s become all one trade. Moreover, the weak fundamental outlook that caused gold to underperform the S&P GSCI in early 2022 has only intensified since the Fed meeting. However, despite that, momentum investors are following the trend and rallies in crude are sparking rallies in the metals.
As a result, the PMs’ rallies on Mar. 17 were more about momentum. However, with their medium-term fundamentals heading in the opposite directions, sharp drawdowns should materialize once the ‘all-for-one’ trade unwinds.
To that point, while the PMs may assume that the Fed won’t follow through on its hawkish forecast, the reality is that the U.S. economic outlook is bullish for hawkish Fed policy.
To explain, I wrote on Mar. 9:
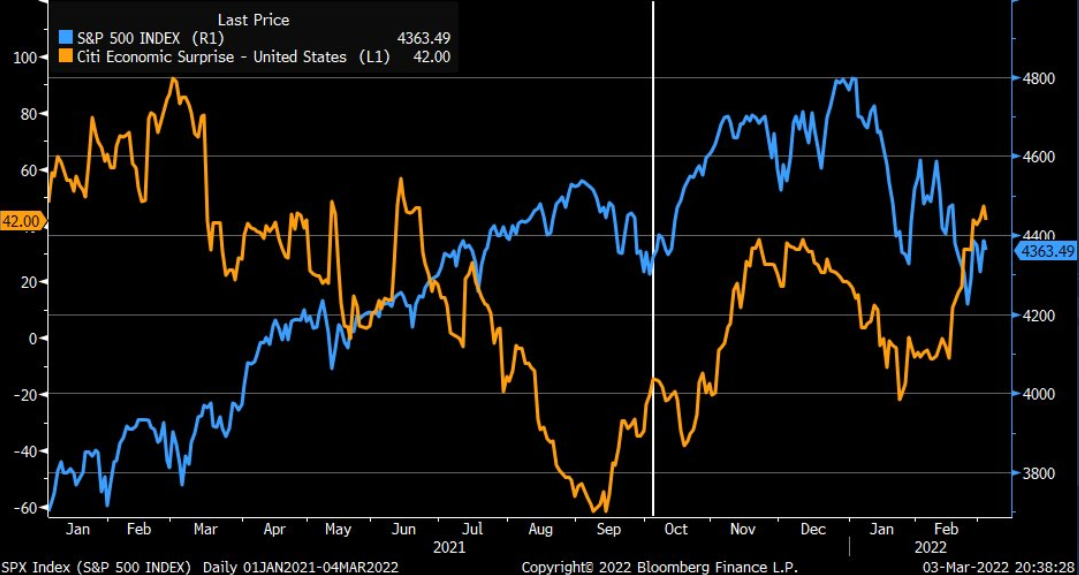
The blue line above tracks the S&P 500, while the orange line above tracks Citigroup’s Economic Surprise Index. For context, a surprise occurs when an economic data point outperforms economists’ consensus estimate.
If you analyze the right side of the chart, you can see that the orange line bottomed in January and has been moving higher ever since. As a result, the U.S. economy remains in a healthy position, and as long as this is the case, it keeps the pressure on the Fed to raise interest rates at its next several monetary policy meetings.
To that point, with more data released on Mar. 17, the outperformances continued.
Please see below:
 Source: Investing.com
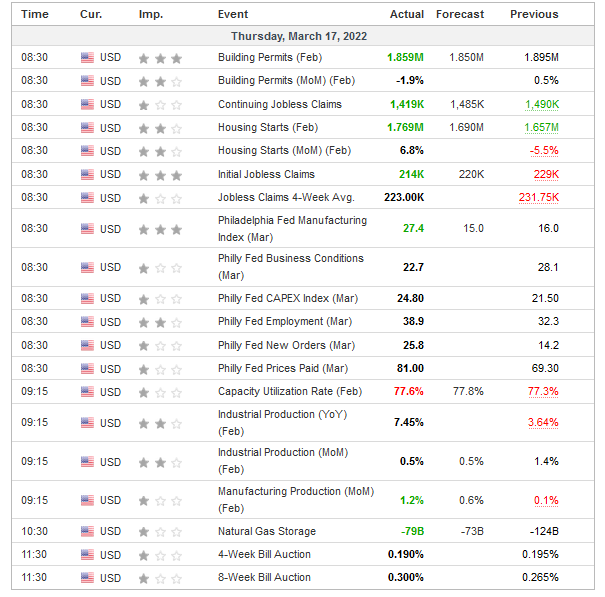
 The U.S. Economy Condition
To explain, building permits, housing starts, manufacturing production, initial and continuing jobless claims, and the Philadelphia Fed’s manufacturing index all outperformed expectations on Mar. 17. As a result, they add upward momentum to Citigroup’s Economic Surprise Index. Moreover, with the Fed’s hawkish disposition dependent on the health of the U.S. economy, Thursday’s data only enhances the prospects of more rate increases.
For example, I wrote on Mar. 17: Powell noted during his press conference that there are ~1.7 job openings for every unemployed U.S. citizen. He added that “all signs are that this is a strong economy, one that will be able to flourish in the face of less accommodative monetary policy.”
Moreover, with continuing jobless claims hitting a new post-pandemic low on Mar. 17, the Fed’s maximum employment mandate remains on the hawkish side of the spectrum.
Please see below:
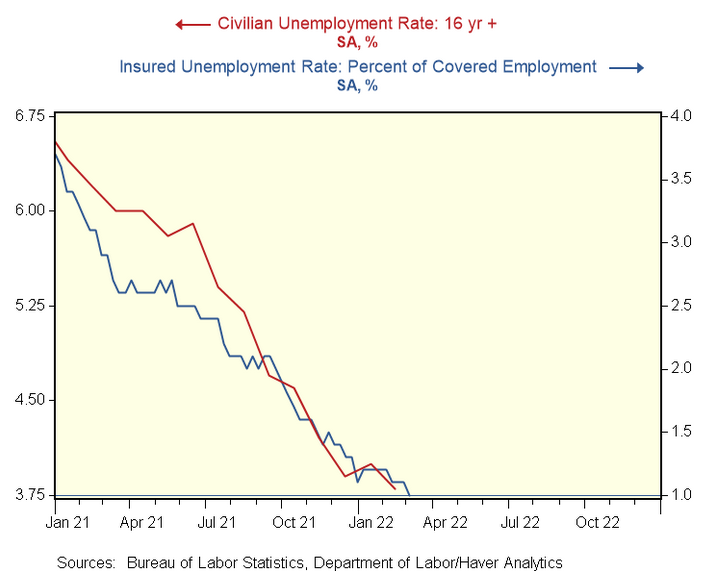
To explain, the red line above tracks the civilian unemployment rate, while the blue line above tracks the insured unemployment rate. For context, the latter calculates the number of U.S. citizens collecting unemployment as a percentage of the U.S. labor force. Moreover, the metric dropping to 1% on Mar. 17 highlights how U.S. labor market strength should keep the Fed’s foot on the hawkish accelerator.
Second, I also noted on Mar. 17 that the critical development is Powell’s view of the U.S. economy. In a nutshell: if Powell believes the U.S. economy is in a healthy position, then he’ll raise interest rates until he no longer thinks that’s the case. With his remarks on Mar. 17 signaling more hawkish policy to come, the PMs should suffer the consequences over the medium term.
Please see below:
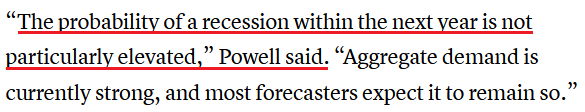 Source: CNBC
In addition, I noted above that U.S. housing starts outperformed expectations on Mar. 17. With the metric hitting a new 2022 high of 1.769 million, the data supports Powell’s assertion that the U.S. economy is nowhere near a recession.
Please see below:
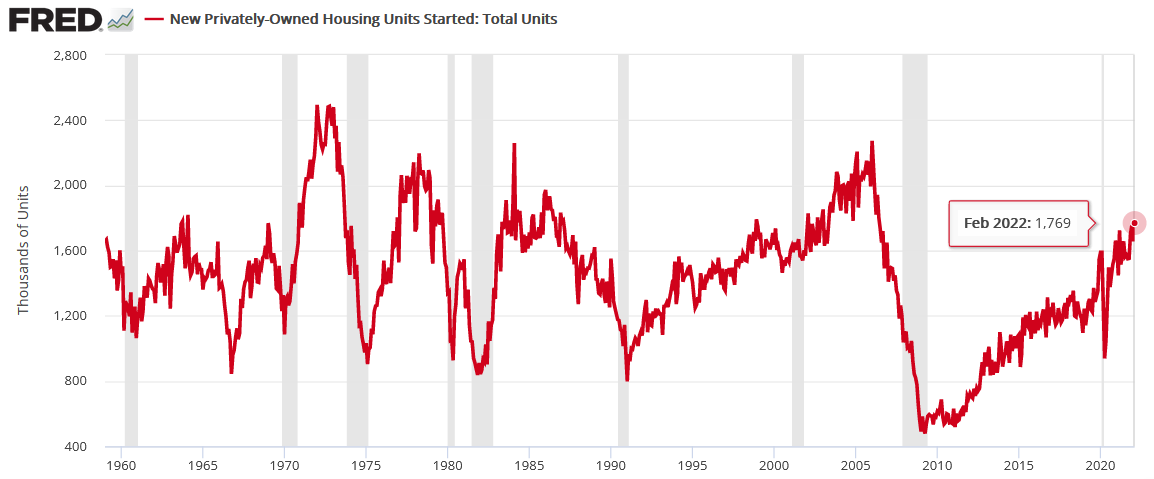
To explain, the red line above tracks U.S. housing starts, while the gray bars above track U.S. recessions. If you analyze the connection, notice how U.S. housing starts always peak and decline in advance of U.S. recessions. Moreover, the relationship has been present since before 1960. As a result, with U.S. housing starts hitting a new post-pandemic high on Mar. 17, it adds more fuel to the Fed’s hawkish fire.
On top of that, while inflation remains extremely problematic, the latest survey data shows that pricing pressures are still headed in the wrong direction. For example, I noted above how the Philadelphia Fed’s manufacturing index outperformed expectations on Mar. 17. Well, the report also stated that “price increases become more widespread:”
“The prices paid index climbed 12 points to 81.0, its highest reading since June 1979. More than 87 percent of the firms reported increases in input prices, while 6 percent reported decreases; 7 percent of the firms reported no change. The current prices received index increased 5 points to 54.4. Nearly 57 percent of the firms reported increases in prices received for their own goods this month, 2 percent reported decreases, and 38 percent reported no change.”
Please see below:
 Source: Philadelphia Fed
Similarly, the New York Fed’s Empire State Manufacturing Index was released on Mar. 15. The report revealed:
“The prices paid index edged down three points to 73.8, while the prices received index rose two points to a record high of 56.1, signaling ongoing substantial increases in both input prices and selling prices.”
Please see below:
 Source: New York Fed
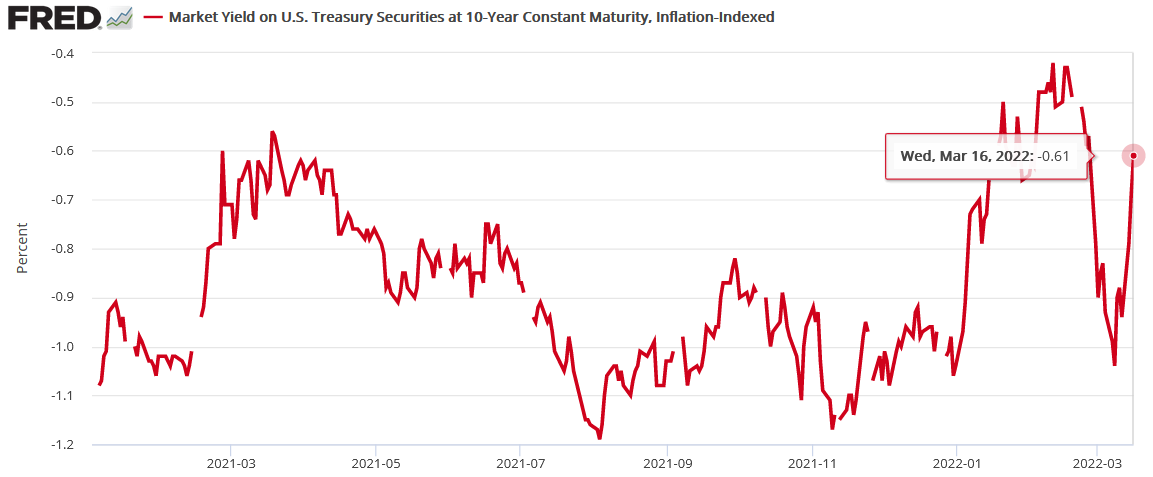
Finally, while the Russia-Ukraine conflict resulted in a safe-haven bid for U.S. Treasuries, that gambit has already unraveled. In the process, the sharp decline in the U.S. 10-Year real yield has also reversed, and with even higher real yields required to calm inflation, the PMs will likely regret dismissing all of these fundamental warning signs.
The bottom line? While it was an eventful week on the fundamental front, the realized data only strengthened the PMs' bearish thesis. For months I've been warning that surging inflation and a resilient U.S. economy would elicit a hawkish shift from the Fed. Moreover, with each monetary policy meeting and each SEP release, the Fed continues to increase its hawkish directives. As a result, while the PMs seem inclined to ignore these developments right now, history implies that the tranquility won't last.
What to Watch for Next Week
With another full slate of U.S. economic data releases next week, the most important ones are as follows:
- Mar. 22: Richmond Fed manufacturing and services indexes
With output and inflation metrics providing insight into the state of play in March, it will be interesting to see if the data mirrors the results from the New York and Philadelphia Fed’s manufacturing surveys.
- Mar. 23: New home sales
With housing starts and building permits outperforming expectations on Mar. 17, new home sales will tell us how consumers are reacting to U.S. mortgage rates that have increased sharply amid the rise in U.S. Treasury yields.
- Mar. 24: Durable goods orders, ISM and IHS Markit PMIs, the KC Fed manufacturing index
More comprehensive than the regional surveys (like New York, Richmond, Philadelphia, KC, etc.), the ISM and IHS Markit PMIs cover the entire U.S. As a result, the readings on output, employment, and inflation are the most important data points of the week.
- Mar. 25: Michigan consumer sentiment, pending home sales
Like in prior months, it will be interesting to see how consumers respond to higher oil prices, higher mortgage rates and the overall inflationary environment. In addition, pending home sales will piggyback on the implications of the other housing data.
All in all, economic data releases impact the PMs because they impact monetary policy. Moreover, if we continue to see outperformance alongside higher employment and inflation, the Fed will need to push up real yields to reduce demand and calm the pricing pressures. If that occurs, the outcome is profoundly bearish for the PMs.
Thank you for reading our free analysis today. Please note that the above is just a small fraction of the full analyses that our subscribers enjoy on a regular basis. They include multiple premium details such as the interim target for gold that could be reached in the next few weeks. We invite you to subscribe now and read today’s issue right away.
Sincerely,
Przemyslaw Radomski, CFA
Founder, Editor-in-chief -
Gold Investment Update: Collapse of Miners Ahead – What Else Can History Tell Us?
March 11, 2022, 10:09 AMAvailable to premium subscribers only.
Thank you for reading our free analysis today. Please note that the above is just a small fraction of the full analyses that our subscribers enjoy on a regular basis. They include multiple premium details such as the interim target for gold that could be reached in the next few weeks. We invite you to subscribe now and read today’s issue right away.
Sincerely,
Przemyslaw Radomski, CFA
Founder, Editor-in-chief -
Gold Investment Update: Gold Fails Its All-Time Highs Rally
March 10, 2022, 9:33 AMSo much for gold’s move above $2,000. Congratulations on avoiding the mania – it was not easy. The volume readings show that many people were caught up in the “inevitable rally” in gold. You, however, kept focused on what’s most important in the medium term, and over this time frame, this approach is likely to prove most beneficial.
As gold tried to rally to new all-time highs, I sent out an intraday Gold & Silver Trading Alert, and in it, I emphasized the likely temporary nature of this move. I wrote the following:
Yes, the situation in Ukraine is critical.
However, the two key drivers of gold price continue to point to lower gold prices, and at the same time we know that geopolitical-event-based rallies don’t last and very likely to be reversed.
These two key drivers are:
- real interest rates
- the USD Index
The USD Index is already soaring, and real interest rates are likely to increase as the nominal interest rates are about to increase – and given the recent rally in prices they might increase more than most investors expect them to.
Consequently, while – given today’s rally – it might seem like there’s no stopping gold, silver, and mining stocks, please keep the above in mind. This rally is likely to be reversed, and when it reverses, junior gold miners are likely to decline in an epic manner. And lead to epic profits in case of those, who were able not to follow the mania during the parabolic upswing.
The above remains up-to-date.
Let’s check what changed on the charts based on yesterday’s profound decline.
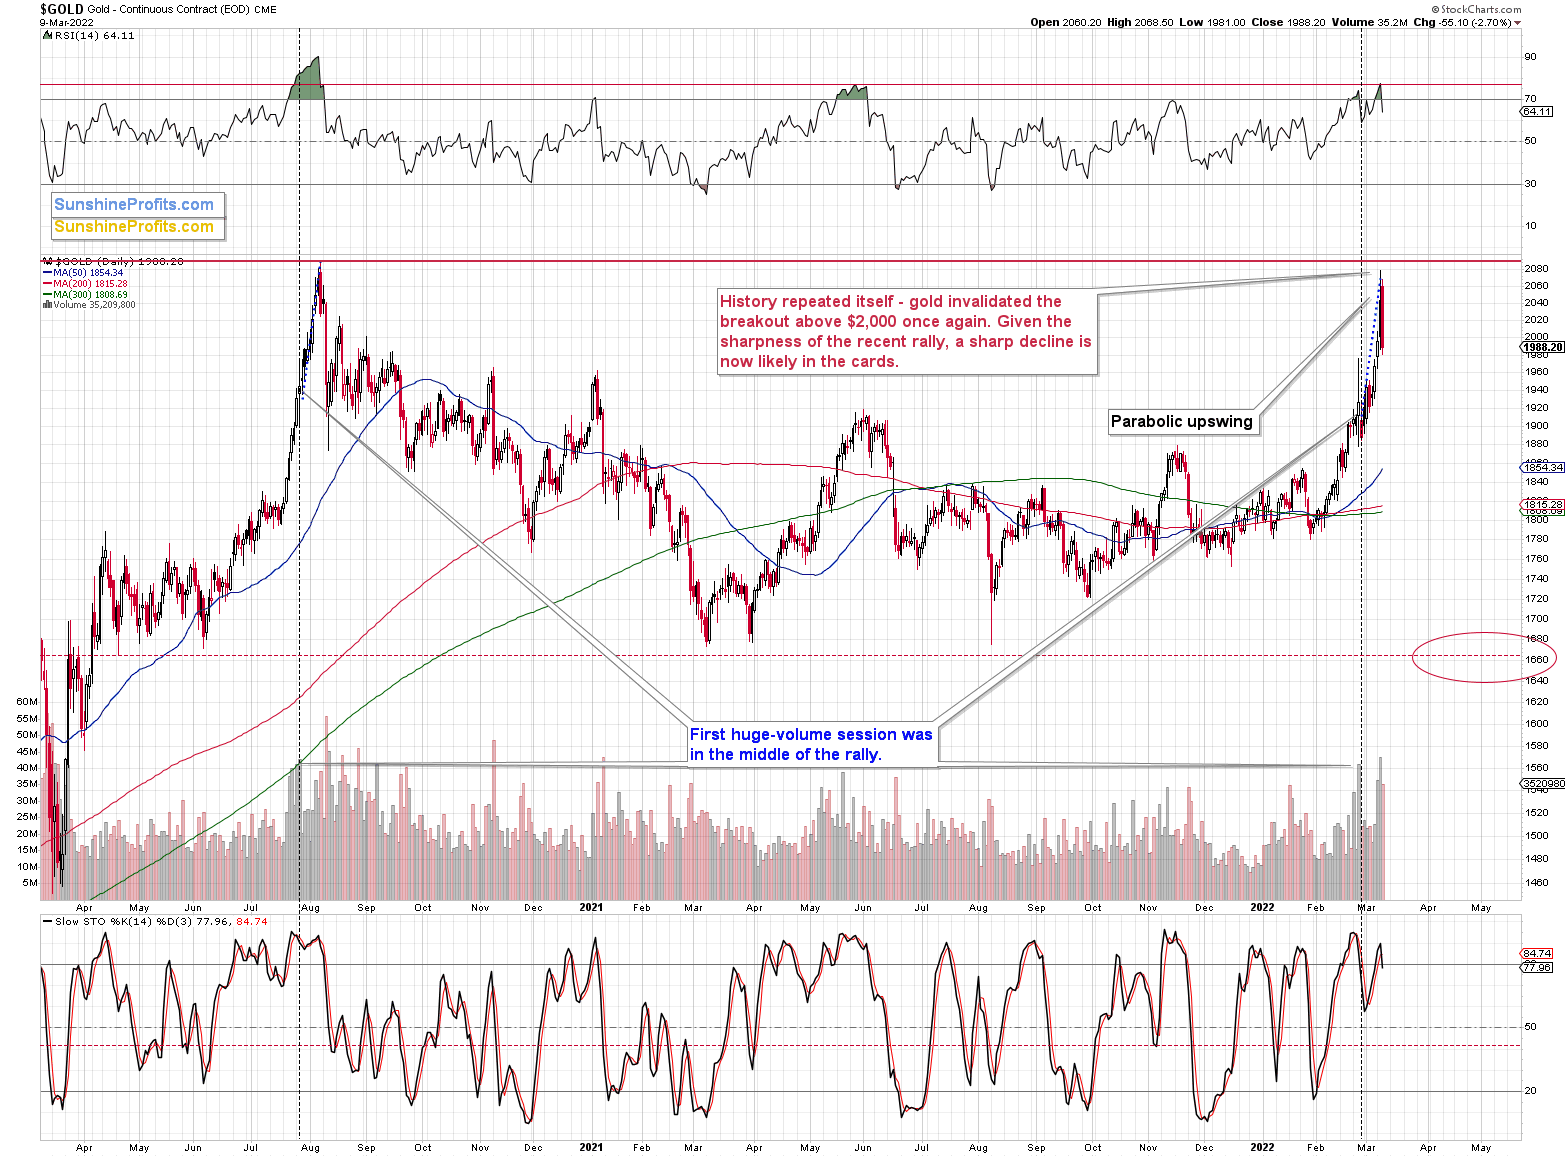
When I wrote yesterday’s analysis, gold was trading at about $2,020, and I wrote that, given the last few days’ volatility, it could be below $2,000 in a few hours. That’s exactly what happened next.
Taking a step back, please note that the previous breakouts above $2,000 were all invalidated sooner rather than later.
Gold tried to break above $2,000 several times:
- twice in August 2020;
- twice in September 2020 (once moving above it, once moving just near this level);
- once in November 2020 (moving near this level);
- once in January 2021 (moving near this level);
- once in February 2022 (moving near this level).
These attempts failed in each of the 7 cases mentioned above.
Yesterday, gold failed its eighth attempt. History rhymed, as it often does. Let’s keep in mind the specific similarity to the 2020 top that I described yesterday:
Gold topped at a similar price to its 2020 top, while the sharpest part of the rally started at about $1,800 (just like in 2020), and the entire rally started in the middle of the year at about $1,670.
In fact, even the moment where gold traded on huge volume for the first time during those rallies is similar. I marked that with blue dotted lines. We saw huge volume more or less in the middle of the final (sharpest) part of the upswing. The history tends to rhyme, and since it seems that the tensions have finally peaked (as I wrote in the opening part of today’s analysis) the same is quite likely for the gold price.
Gold’s big-volume reversal on Tuesday added to the decline’s credibility, making its continuation likely.
The dramatic sell signal was even clearer in the case of mining stocks; and yesterday’s invalidations of breakouts are just as telling.
Yesterday, I commented on miners’ reversal in the following way:
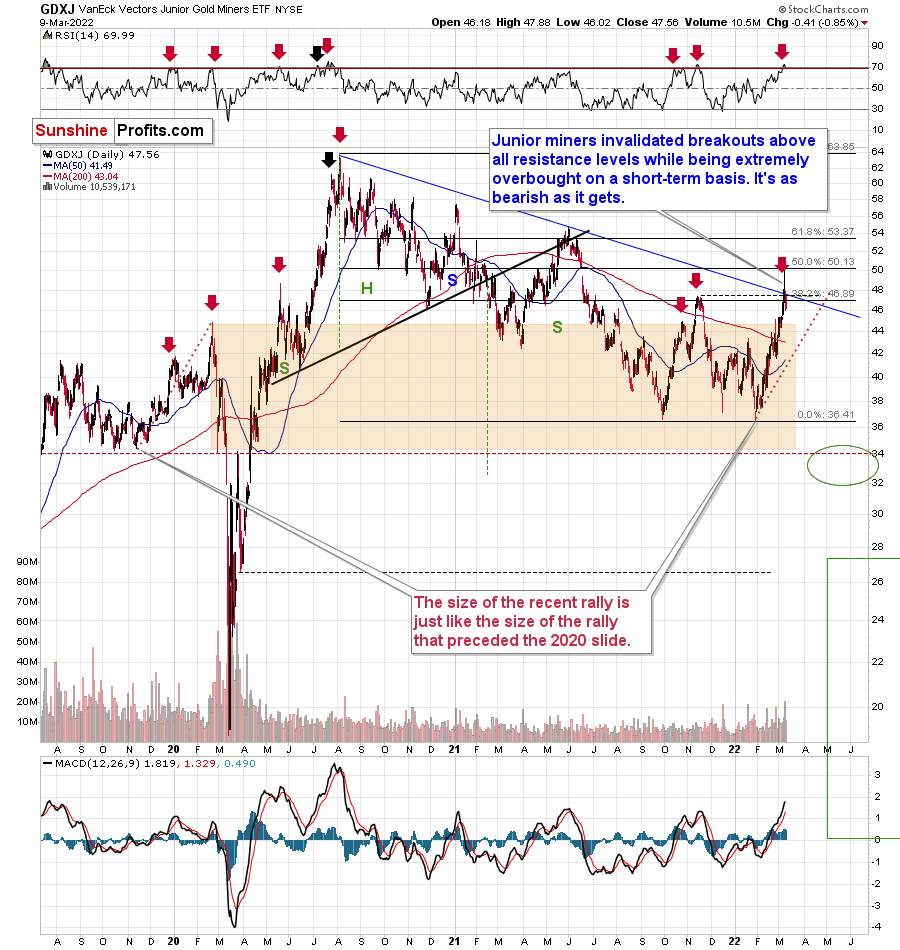
While the junior miners (GDXJ ETF) closed higher yesterday, they were up only slightly. At one point of the session, the GDXJ was up from its previous close by 5.74%. However, it ended only 0.86% higher. Therefore, almost the entire daily rally in junior miners was invalidated.
Yesterday’s session was therefore a profound daily reversal – in candlestick pattern terms, it was a “shooting star reversal”. These patterns should be confirmed by high volume, and yesterday’s volume in the GDXJ was the highest volume not only this year, but it was actually highest volume that we’ve seen in this ETF since mid-2020. The top is most likely in.
If I didn’t have my short position in the GDXJ ETF that’s already significant (and in tune with how significant I want it to be), I would have entered or added to this position now.
(Of course, the above is not an investment advice, nor am I saying that should increase your position, but that’s exactly what my opinion is at the moment based on what we just saw.)
The above bearish signal turned into an extremely bearish one because of GDXJ’s invalidations of previous (small, but still) breakouts. Junior miners just closed visibly below their:
- 38.2% Fibonacci retracement level;
- declining (blue) resistance line;
- late-2021 top.
Invalidations of breakouts are bearish as they show that a given market’s strength was not real and that sellers were able to overwhelm the buyers.
While mining stocks underperformed gold in a rather extreme manner on Tuesday, silver outperformed it on the same day. This was a bearish indication, and indeed, it was followed by lower prices.
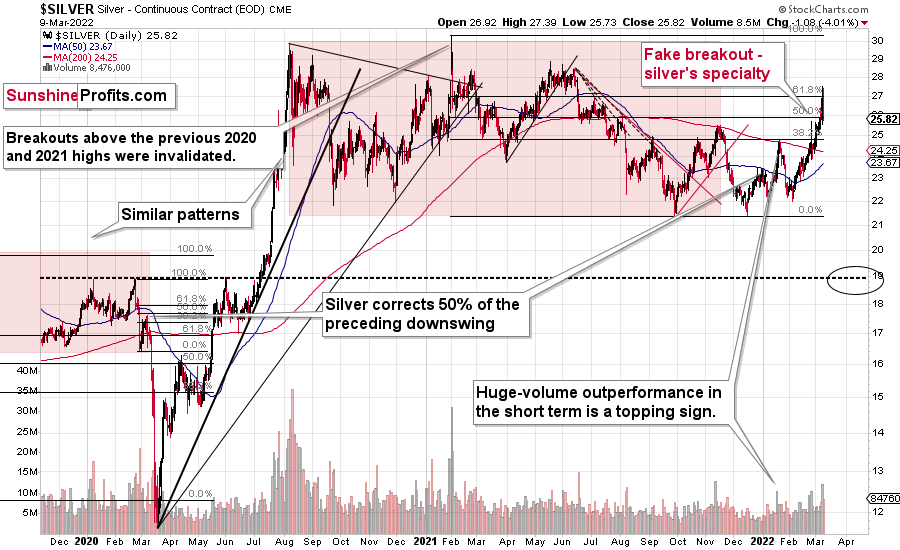
On Tuesday, the GDXJ ETF was up by less than 1%, gold was up by 2.37%, and silver was up by 4.57%. Silver’s outperformance and miners’ underperformance is what we tend to see right at the tops. That’s exactly what it was – a top. Silver declined profoundly, and the attempt to break above its 61.8% Fibonacci retracement level will soon be just a distant (in terms of price) memory.
On a medium-term basis, silver was simply weak relative to gold, but we saw short-term outperformance. In short, that was and continues to be bearish.
How high could silver go before declining? Given all that I wrote above, I think that silver’s top is already in. However, if it isn’t, I don’t think it would manage to move above $30.
All in all, it seems that due to the technical resistance in gold and mining stocks, the sizable – but likely temporary (like other geopolitical-event-based ones) – rally is likely to be reversed shortly. Then, as the situation in the general stock market deteriorates, junior miners will likely plunge in a spectacular manner.
Thank you for reading our free analysis today. Please note that the above is just a small fraction of the full analyses that our subscribers enjoy on a regular basis. They include multiple premium details such as the interim target for gold that could be reached in the next few weeks. We invite you to subscribe now and read today’s issue right away.
Sincerely,
Przemyslaw Radomski, CFA
Founder, Editor-in-chief


Gold Alerts
More-
Status
New 2024 Lows in Miners, New Highs in The USD Index
January 17, 2024, 12:19 PM -
Status
Soaring USD is SO Unsurprising – And SO Full of Implications
January 16, 2024, 8:40 AM -
Status
Rare Opportunity in Rare Earth Minerals?
January 15, 2024, 2:06 PM
Dear Sunshine Profits,


