

-
Gold Investment Update: Is It Now Left to Wait for a Huge Slide in the Gold Market?
August 15, 2022, 8:29 AMAvailable to premium subscribers only.
Thank you for reading our free analysis today. Please note that the above is just a small fraction of the full analyses that our subscribers enjoy on a regular basis. They include multiple premium details such as the interim target for gold that could be reached in the next few weeks. We invite you to subscribe now and read today’s issue right away.
Sincerely,
Przemyslaw Radomski, CFA
Founder, Editor-in-chief -
Gold Investment Update: Why Is the USDX Weak Lately and Gold Not Responding to It?
August 12, 2022, 9:08 AMThe PMs continued their relative underperformances on Aug. 11, as gold fell by 0.36%, silver by 1.89%, the GDX ETF by 1.88% and the GDXJ ETF by 2.15%. Moreover, since the drawdowns occurred alongside the USD Index’s 0.08% slide, the PMs’ inability to rally when the U.S. dollar is weak highlights their technical and fundamental fragility.
500 Narratives
With the S&P 500 in rally mode, short-covering morphed into momentum bids, which have now morphed into FOMO. Moreover, with the bulls brimming with confidence and inflation showing its first signs of slowing, investors are tripping over themselves to position for a dovish pivot.
Please see below:
 Source: CNBC
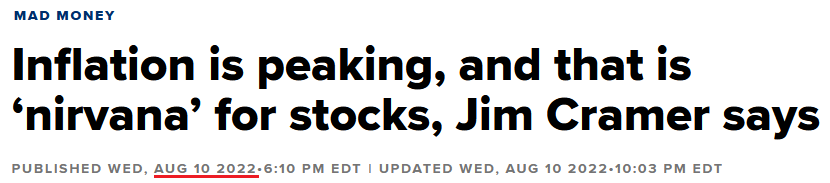
To that point, CNBC’s Jim Cramer said:
“Peak inflation is nirvana for stocks, especially for out-of-favor stocks, like fast-growing tech plays or the financials or the consumer discretionary names. That means you can buy everything from Microsoft to Wells Fargo to Target.”
He added:
“Some companies will absolutely be hurt by the upcoming recession, but others will see their stocks soar because they’re worth more in an environment where inflation is at last possibly under control,”
Thus, while ‘soaring stocks’ are not part of historical recessions, the narrative is another example of making it up as you go along.
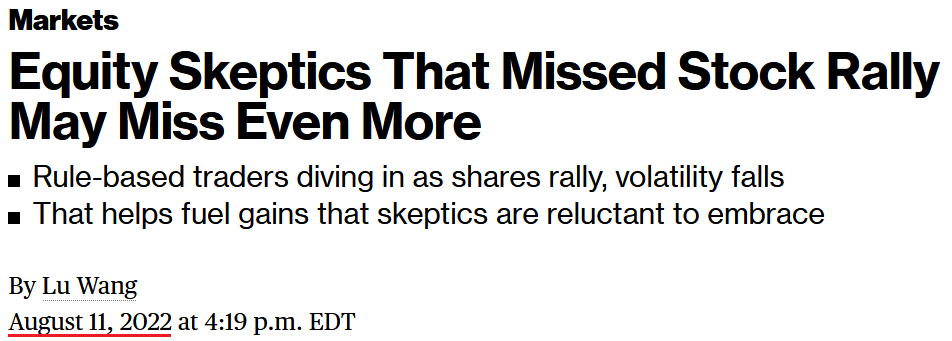
Second, the algorithmic funds – which shift their positions based on realized volatility – have increased their stock holdings as the Cboe Volatility Index (VIX) declined. In addition, with FOMO seeping into the mindsets of hedge funds and long-only managers, you better get on board before you “miss even more.”
Please see below:
 Source: Bloomberg
Third, with investor sentiment doing a complete 180 from June, the chorus calling for 3,000 on the S&P 500 is now calling for new highs. For example, some believe that eclipsing 4,232 (which the S&P 500 did intraday on Aug. 11) signals the end of the bear market. CFRA Chief Investment Strategist Sam Stovall said:
“This remains a bear market rally until we close above the 4,232 level on the S&P. After that, history reminds us that no bear market ever recovered 50% of its decline only to set an even lower low. It would be an early signal that the bear is behind us.”
However, while investors cite erroneous reasons for why the S&P 500 is destined for new all-time highs, “history reminds us” that ‘never’ is also present from a fundamental perspective.
To explain, I’ve noted on numerous occasions that reducing inflation to the Fed’s 2% annual target will require much more economic pain than the consensus realizes. I wrote on May 26:
If you analyze the chart below, you can see that the U.S. federal funds rate (FFR) (the green line) nearly always rises above the year-over-year (YoY) percentage change in the headline Consumer Price Index (the red line) to curb inflation. Therefore, investors are kidding themselves if they think the Fed is about to re-write history.
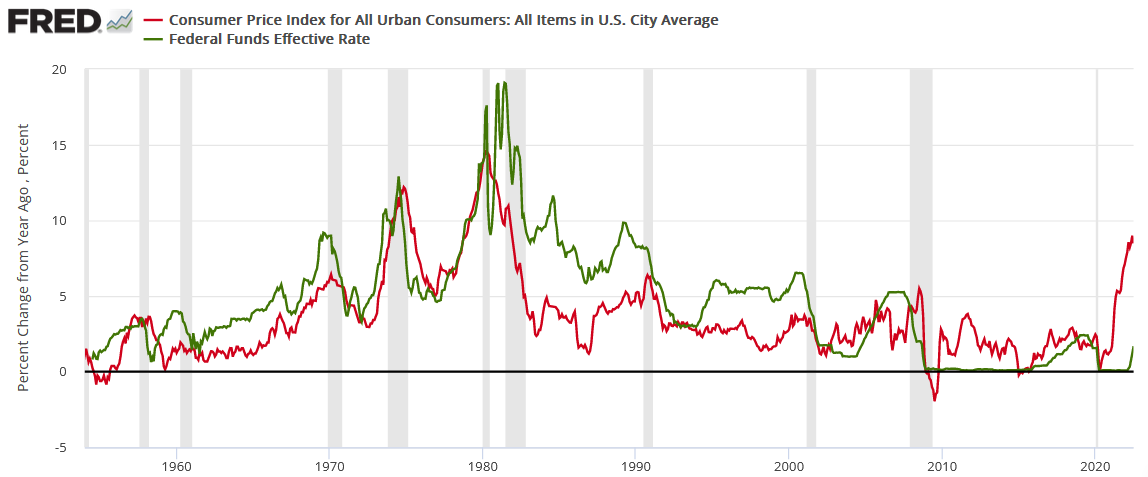
To be specific, the FFR has either eclipsed the YoY headline CPI or come within ~50 basis points of its peak in every inflation battle since 1954. Therefore, please see the unprecedented gap on the right side of the chart. With the YoY headline CPI peaking (for now) at 9.1% and the FFR at 2.5% (the high end of the Fed's 2.25% to 2.5% range), the difference is 6.6%.
As a result, history implies the FFR needs to hit at least 8.6% (which marks ~50 basis points below the current CPI peak). Moreover, while we don't expect the FFR to hit this level, the purpose is to show just how laughable a 3% FFR and 9%+ inflation is from a historical perspective. In reality, a 4.5%+ FFR is much more realistic, and the prospect is far from priced in.
In addition, notice how every inflation spike leads to a higher FFR and then a recession (the gray bars). As such, do you really think this time is different?
Thus, while the bulls unveil several narratives for why the S&P 500 is on the fast track to 5,000, the reality is that inflation is much more problematic than they realize. Also, if you celebrated every substantial inflation peak since 1954, you were left holding the bag when the recession hit soon after.
On top of that, the Fed will double quantitative tightening (QT) to $95 billion per month in September. Therefore, if QE is bullish, what is QT?
Please see below:
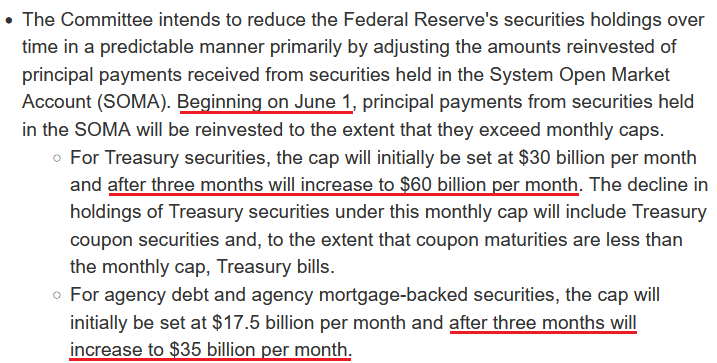 Source: U.S. Fed
As further evidence, none of the current cross-asset metrics signal a bear market low.
Please see below:
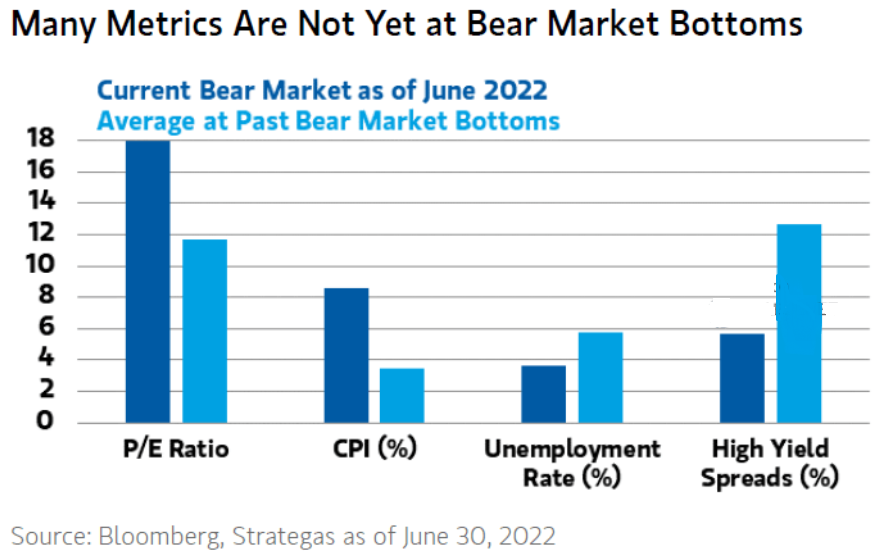
To explain, Morgan Stanley’s data is as of Jun. 30 (the dark blue bars), but the averages (the light blue bars) are the most important. As you can see, the average bear market doesn’t end with a P/E above 17, a CPI at 8%+, high yield spreads at 4.33% and an unemployment rate at 3.5%.
To that point, the U.S. unemployment rate hit a new 2022 low of 3.5% in July. However, the metric always bottoms before a recession.
Please see below:
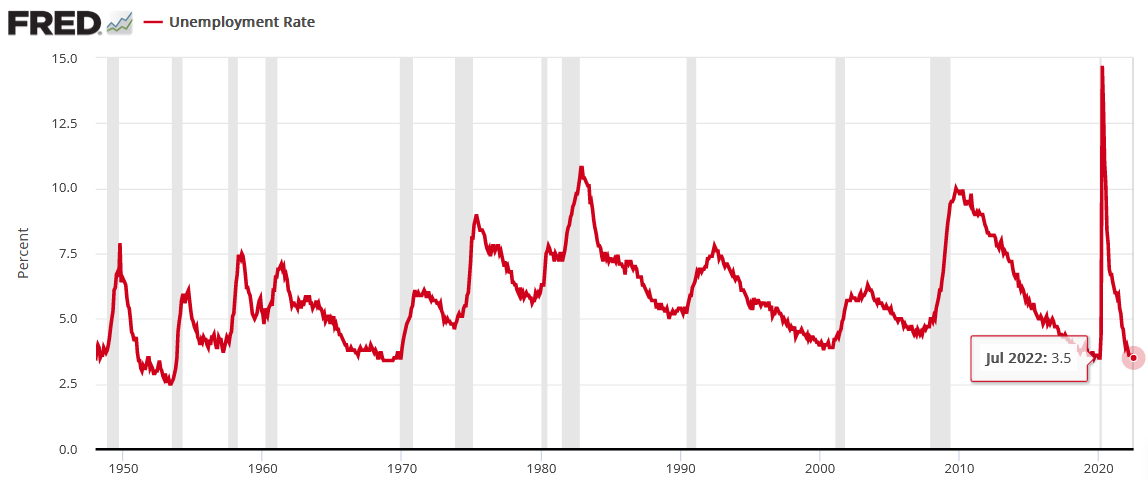
To explain, notice how the U.S. unemployment rate always troughs and then steadily rises before a recession hits. Thus, with the metric heading south in July, the bearish turn still awaits us. Of course, the uninformed crowd assumes that this time is different.
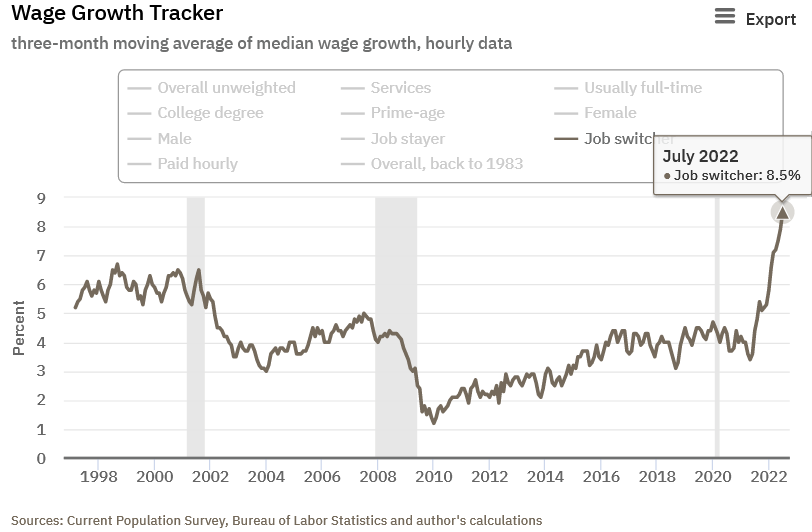
Furthermore, the unemployment rate needs to rise to curb inflation. The Atlanta Fed updated its Wage Growth Tracker on Aug. 11. Moreover, the overall index matched its record high set in June at 6.7%. However, job switchers – Americans that leave their job for a new one – saw their wages increase by 8.5% (a new all-time high and up from 7.9% in June). As a result, it highlights how companies are still paying up to attract new employees.
Please see below:
All in all, while the consensus and the media want you to believe that the bear market is over, their lack of fundamental objectivity highlights why narratives are so destructive. Remember, if normalizing inflation and reducing its balance sheet were so easy, the Fed would have done it already.
Think about it: the Fed was so cautious about tapering its asset purchases that officials waited until inflation was so unanchored that it couldn’t be ignored. However, now that the Fed will hike interest rates to 3.4%, sell $95 billion in bonds per month and increase the U.S. unemployment rate to 3.7% (the Fed’s 2022 SEP projections), while the S&P 500 hits new highs? All the while, reducing the YoY headline CPI to 2%, even though it’s never been done since 1954 without the FFR coming within ~50 basis points of the cycle peak. Good luck.
What’s Wrong With the USD Index?
With the USD Index languishing recently, you may be concerned about the dollar basket's recent pullback. However, the short answer is: nothing is wrong with the greenback. For starters, the U.S. dollar always suffers when investors adopt a risk-on mentality; and with short squeezes lifting the most speculative assets, the fervor has spread to the currency market and uplifted the 2022 laggards.
However, it's important to remember that the same unrealistic expectations that fuel the S&P 500's rise also fuel the USD Index's fall.
Please see below:
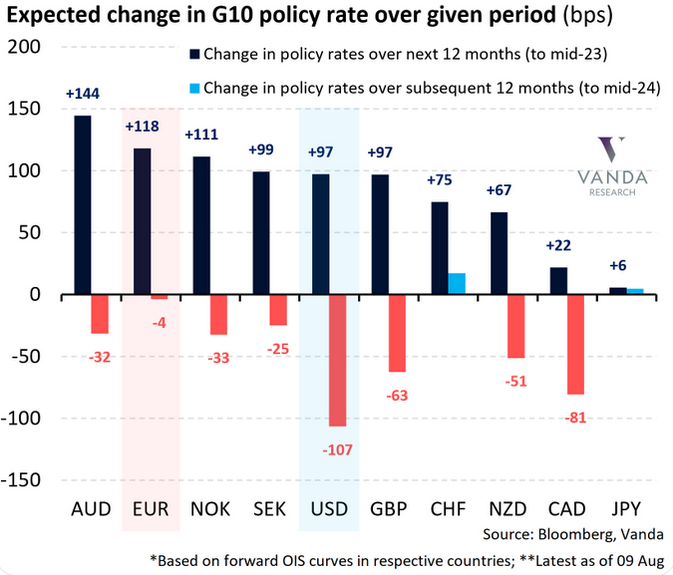
To explain, the dark blue bars above depict the market-implied changes in overnight policy rates for various currencies (regions) from now until mid-2023, while the light blue and red bars above depict the market-implied changes 12 months thereafter.
If you analyze the USD column, you can see that “peak inflation” has investors pricing in 97 basis points of rate increases over the next 12 months and 107 basis points of rate cuts from mid-2023 to mid-2024. Therefore, the consensus expects the U.S. dollar to be a relative underperformer as other central banks play catch-up.
To that point, the EUR column shows that investors expect 118 basis points of rate increases over the next 12 months and 4 basis points of rate cuts from mid-2023 to mid-2024. Thus, expectations are bullish for the EUR/USD, which accounts for nearly 58% of the USD Index’s movement.
However, investors’ rate hike/cut expectations are in la-la land. The idea that the ECB will out-hawk the Fed by hiking more and cutting less contrasts with fundamental reality. Furthermore, the Eurozone is in much worse economic shape than the U.S., and the EUR/USD should continue its descent when investors realize this.
The Bottom Line
Down is up, bad is good, and the narrative is that if you don’t board the bull train, it may leave the station. However, while the crowd is eager to ignore the fundamental imbalances that threaten the outlooks for the S&P 500, gold, silver, and mining stocks, it’s important to remember that gravity is undefeated. Therefore, while sentiment can keep asset prices uplifted in the short term, fundamental warning signs are flashing red.
In conclusion, the PMs declined on Aug. 11, and the GDXJ ETF was the worst performer. Moreover, while the USD Index has suffered recently, it’s likely only a correction within a medium-term uptrend. Furthermore, with investors expecting much more heavy lifting than the ECB can deliver, the EUR/USD’s recent rally is likely on borrowed time.
Thank you for reading our free analysis today. Please note that the above is just a small fraction of the full analyses that our subscribers enjoy on a regular basis. They include multiple premium details such as the interim target for gold that could be reached in the next few weeks. We invite you to subscribe now and read today’s issue right away.
Sincerely,
Przemyslaw Radomski, CFA
Founder, Editor-in-chief -
Gold Investment Update: Investors Strike Back in Favor of the Gold Market
August 5, 2022, 9:35 AMAvailable to premium subscribers only.
-
Gold Investment Update: It’s Time to Go Short Again
July 29, 2022, 6:55 AMAvailable to premium subscribers only.
-
Gold Investment Update: Eurozone Recession Fears Didn’t Stop Gold Miners From Spiking
July 22, 2022, 9:55 AMWhile this week was a rollercoaster across all assets, unanchored inflation, a hawkish Fed, and recession fears in the Eurozone made large intraday swings more prevalent than usual.
The Weekly Fundamental Roundup
However, with the GDXJ ETF rallying sharply and outperforming most risk assets on Jul. 21, the junior miners closed back above $31. Moreover, with equity optimism helping to lead the charge, I warned on Jul. 20 that predicable rallies with low volatility could enhance systematic funds’ appetites. I wrote:
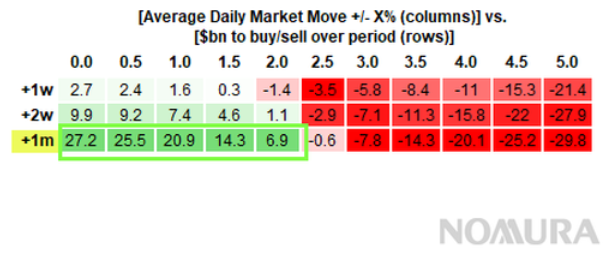
To explain, systematic funds apply strict volatility controls to prevent major drawdowns. Therefore, if calm prevails in the financial markets, systematic funds could enhance the upward momentum by increasing their risk exposure. For example, the green rows on the left highlight how average daily market moves of 0% to 2% should result in net purchases by systematic funds over the next month.
Moreover, average moves of 1% or less (most common) mean less volatility and often culminate in the largest inflows. In contrast, the red rows on the right show how large average daily swings of 2.5% or more often push systematic funds to the sidelines. As a result, “a ‘Summer doldrums’ environment” where a lot of the bad news is already priced in could provide the perfect backdrop for the GDXJ ETF to move higher.
Thus, with the S&P 500 capping its gains at less than 1% during the last two sessions, the CTAs are back in business. Furthermore, I warned on Jul. 19 that the recent pullback caused short sellers to press their positions too much. I wrote:
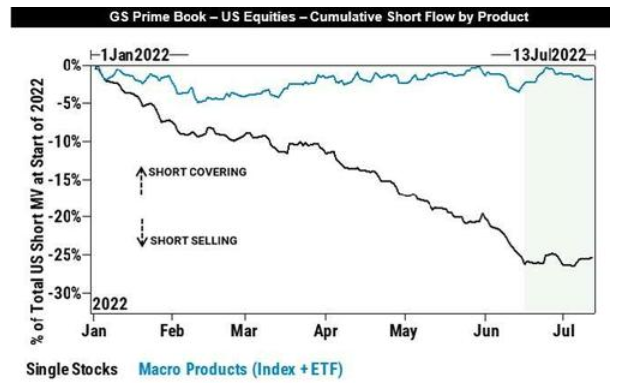 Source: Goldman Sachs
To explain, the light blue line above tracks hedge funds’ short-selling activity across indexes and ETFs, while the dark blue line above tracks their activity across single stocks. If you analyze the right side of the chart, you can see that index positioning is roughly neutral, while stock-specific shorts are near their 2022 highs.
Therefore, if the macroeconomic data or this week’s earnings releases elicit a small bout of optimism, the fundamental fuel could help uplift the NASDAQ 100, the S&P 500, and the GDXJ ETF.
To that point, with the most shorted stocks materially outperforming the S&P 500, the short squeeze arrived as expected.
Please see below:
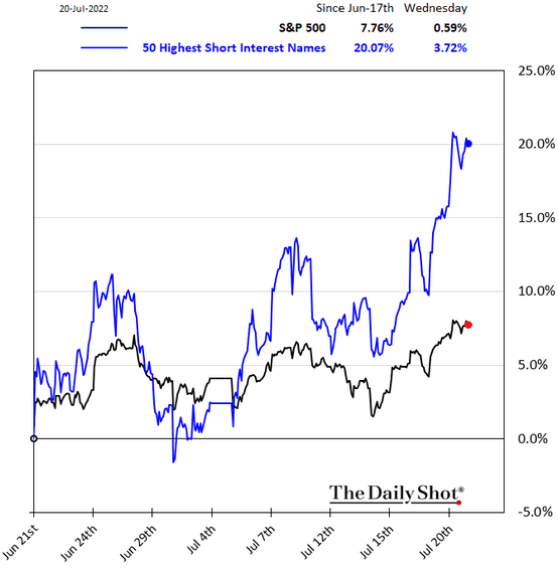
To explain, the black line above tracks the S&P 500, while the blue line above tracks an index of the 50 most shorted stocks as of Jul. 20. If you analyze the right side of the chart, you can see that the high beta, IPO, profitless tech, etc. companies have led the relief rally. Moreover, the basket increased by 3.72% on Jul. 20, while the S&P 500 rallied by 0.59%. Therefore, with a likely continuation unfolding on Jul. 21, liquidity-beneficiaries like the GDXJ ETF were supported by the re-rating.
In addition, the technical backdrop remains supportive and signals higher junior miners’ prices in the days ahead. The only caveat is that weak corporate earnings from Snap Inc. sent ripples across the financial markets after hours on Jul. 21. For example, the stock declined by more than 26% after the bell and dragged down other online advertisers like Meta Platforms (Facebook) and Alphabet (Google).
As a result, while the negativity may impact today’s session, we still expect the GDXJ ETF to rally in the days ahead.
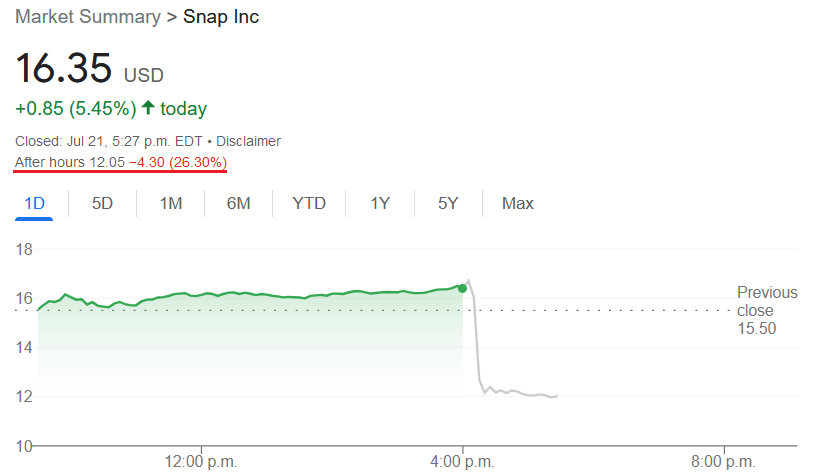 Source: Google
Inflation’s Alive and Kicking
While many technical, sentiment, and positioning metrics point to higher prices for the GDXJ ETF in the short term, fundamental clouds are growing darker by the day. For example, Blackstone – one of the largest private equity firms in the world – released its second-quarter earnings on Jul. 21. CEO Steve Schwarzman said:
“We're cautious on inflation which we think could stay higher for longer than most expect and central banks will have to continue responding. It will be a difficult balancing act in combating inflation, while trying to minimize the negative impact on economies (…).”
“We've been preparing for an environment of rising rates and a normalization of market multiples for some time. And the facts on the ground across our global portfolio suggested inflation would be higher and more persistent than many believed.”
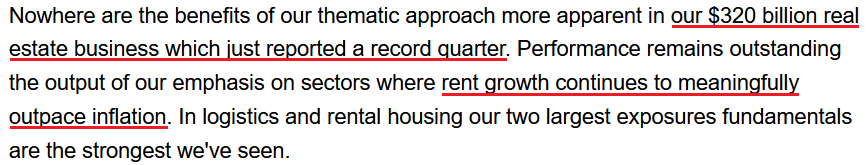
Thus, while I’ve been warning for months that inflation would surprise to the upside, please note that Blackstone has a $320 billion real estate portfolio. Moreover, with the Shelter Consumer Price Index (CPI) accounting for more than 30% of the headline CPI’s movement, Schwarzman’s revelation about “rent growth” is bullish for inflation.
Please see below:
 Source: Blackstone/Seeking Alpha
 Likewise, Hasbro released its second-quarter earnings on Jul. 19. For context, it's one of the largest toy companies in the world. CEO Chris Cocks said during the Q2 earnings call:
“We were very cognizant of the inflationary environment we were operating in, both from a consumer takeaway as well as its impact on our supply chain.” CFO Deb Thomas added, “While product and freight costs are up, we're beginning to see a reduction in port congestion delays. And lead times have come down, although they remain two times higher than historical levels.”
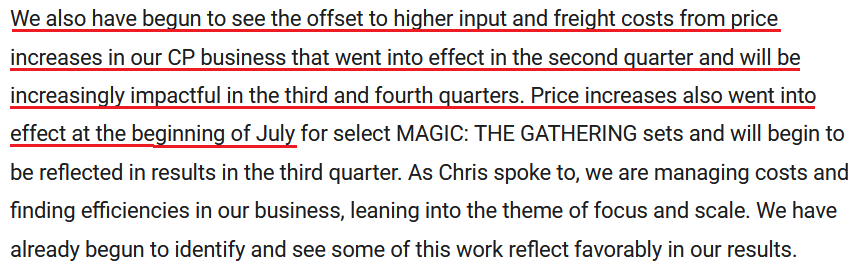
More importantly, with “price increases taken at the beginning of the quarter,” Hasbro executives aren’t waiting for the inflation environment to normalize. For context, “CP” stands for consumer products, and the segment accounted for 55% of Hasbro’s Q2 net revenue.
Please see below:
 Source: Hasbro/The Motley Fool
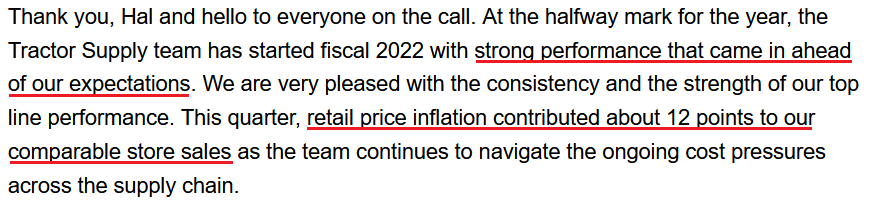
Sending a similar message, Tractor Supply – which sells products for home improvement, agriculture, lawn and garden maintenance, livestock, equine and pet care – released its second-quarter earnings on Jul. 21. CEO Hal Lawton said during the Q2 earnings call:
“On inflation, I would start by just saying it continues to be persistent and consistent. Certainly, seeing some moderation, if you look at a few of the metrics, fuel costs, slightly down, spot rates on containers, down a bit, commodities moderating, but still, if you look at even on a year-over-year (YoY) basis and certainly on a two-year and three-year basis, kind of record highs.”
He added:
“I think the thing we are both watching at a very high macro level is [the Producer Price Index]. And PPI has got to come down first, just generically speaking, across retail before CPI is going to come down.”
“It’s going to take [time] because retailers got to turn through their higher cost inventory for two months, three months, four months at a minimum before you start to see any reduction on the CPI retail side. So, I think inflation is going to hold and continue to be consistent really through the CPI kind of retail level, certainly through the balance of this year.”
Thus, with Tractor Supply executives not waiting for the inflation environment to normalize either, the company raised its prices by ~12% in Q2. As a result, does it seem like inflation is about to ride off into the sunset?
 Source: Tractor Supply/Seeking Alpha
The Bottom Line
While the GDXJ ETF should continue its ascent in the days ahead, weakness from Snap Inc. may depress overall sentiment somewhat. However, we still remain short-term bullish. In contrast, the medium-term outlook continues to worsen, as inflation should keep the Fed hawked up. Moreover, while the consensus assumes that a 2.5% to 3% U.S. federal funds rate will be enough to calm the pricing pressures, the data suggests otherwise.
In conclusion, the PMs rallied on Jul. 21, and the GDXJ ETF led the charge. Moreover, with a tactical buying opportunity still in place, the junior miners should enjoy more upside before their medium-term downtrend resumes.
What to Watch for Next Week
With more U.S. economic data releases next week, the most important are as follows:
- Jul. 25: Dallas Fed manufacturing survey
The Dallas Fed’s survey is a leading indicator of inflation and employment activity in Texas.
- Jul. 26: Richmond Fed manufacturing and Dallas Fed services surveys
Both regional surveys will highlight the growth, employment, and inflation dynamics in their respective regions. Therefore, they are also leading indicators of future government data.
- Jul. 27: FOMC meeting, Chairman Jerome Powell’s press conference
With the FOMC meeting headlining the week, a 75 basis point rate hike is widely expected. However, with Powell previously noting that he wants positive real interest rates “across the curve” (which hasn’t materialized at the short end), his comments will be of immense importance.
- Jul. 28: Q2 GDP, KC Fed manufacturing survey
It will be interesting to see if the U.S. economy is in a technical recession or not. With the Atlanta Fed’s latest estimate predicting another quarter of negative real growth, a realization may materialize. In addition, the KC Fed’s data will provide insights similar to the other regional surveys.
- Jul. 29: PCE Index, Chicago PMI
While the CPI and the PCE Index are roughly interchangeable, the latter is the Fed’s preferred measure of inflation. As such, it’s essential to monitor the results. Likewise, the Chicago PMI is another regional survey that helps paint a portrait of the U.S. employment and inflation outlooks.
All in all, economic data releases impact the PMs because they impact monetary policy. Moreover, if we continue to see higher employment and inflation, the Fed should keep its foot on the hawkish accelerator. If that occurs, the outcome is profoundly bearish for the PMs.
Thank you for reading our free analysis today. Please note that the above is just a small fraction of the full analyses that our subscribers enjoy on a regular basis. They include multiple premium details such as the interim target for gold that could be reached in the next few weeks. We invite you to subscribe now and read today’s issue right away.
Sincerely,
Przemyslaw Radomski, CFA
Founder, Editor-in-chief


Gold Alerts
More-
Status
New 2024 Lows in Miners, New Highs in The USD Index
January 17, 2024, 12:19 PM -
Status
Soaring USD is SO Unsurprising – And SO Full of Implications
January 16, 2024, 8:40 AM -
Status
Rare Opportunity in Rare Earth Minerals?
January 15, 2024, 2:06 PM
Dear Sunshine Profits,


