

Briefly: gold and the rest of the precious metals market are likely to decline in the next several weeks/months and then start another powerful rally. Gold’s strong bullish reversal/rally despite the USD Index’s continuous strength will likely be the signal confirming that the bottom is in.
Welcome to this week's Gold Investment Update. Predicated on last week’s price moves, our most recently featured outlook remains the same as the price moves align with our expectations. On that account, there are parts of the previous analysis that didn’t change at all in the earlier days, which will be written in italics.
While gold is currently (at the moment of writing these words) trading below $2,000, it just closed slightly above $2,000 yesterday (Thursday). What does it mean? Before commenting on gold’s chart and replying to this question, I would like to provide context by quoting what I wrote previously:
So much for gold’s move above $2,000. Congratulations on avoiding the mania – it was not easy. The volume readings show that many people were caught up in the “inevitable rally” in gold. You, however, kept focused on what’s most important in the medium term, and over this time frame, this approach is likely to prove most beneficial.
As gold tried to rally to new all-time highs, I sent out an intraday Gold & Silver Trading Alert, and in it, I emphasized the likely temporary nature of this move. I wrote the following:
Yes, the situation in Ukraine is critical.
However, the two key drivers of gold price continue to point to lower gold prices, and at the same time we know that geopolitical-event-based rallies don’t last and very likely to be reversed.
These two key drivers are:
- real interest rates;
- the USD Index.
The USD Index is already soaring, and real interest rates are likely to increase as the nominal interest rates are about to increase – and given the recent rally in prices they might increase more than most investors expect them to.
Consequently, while – given today’s rally – it might seem like there’s no stopping gold, silver, and mining stocks, please keep the above in mind. This rally is likely to be reversed, and when it reverses, junior gold miners are likely to decline in an epic manner. And lead to epic profits in case of those, who were able not to follow the mania during the parabolic upswing.
The above remains up-to-date.
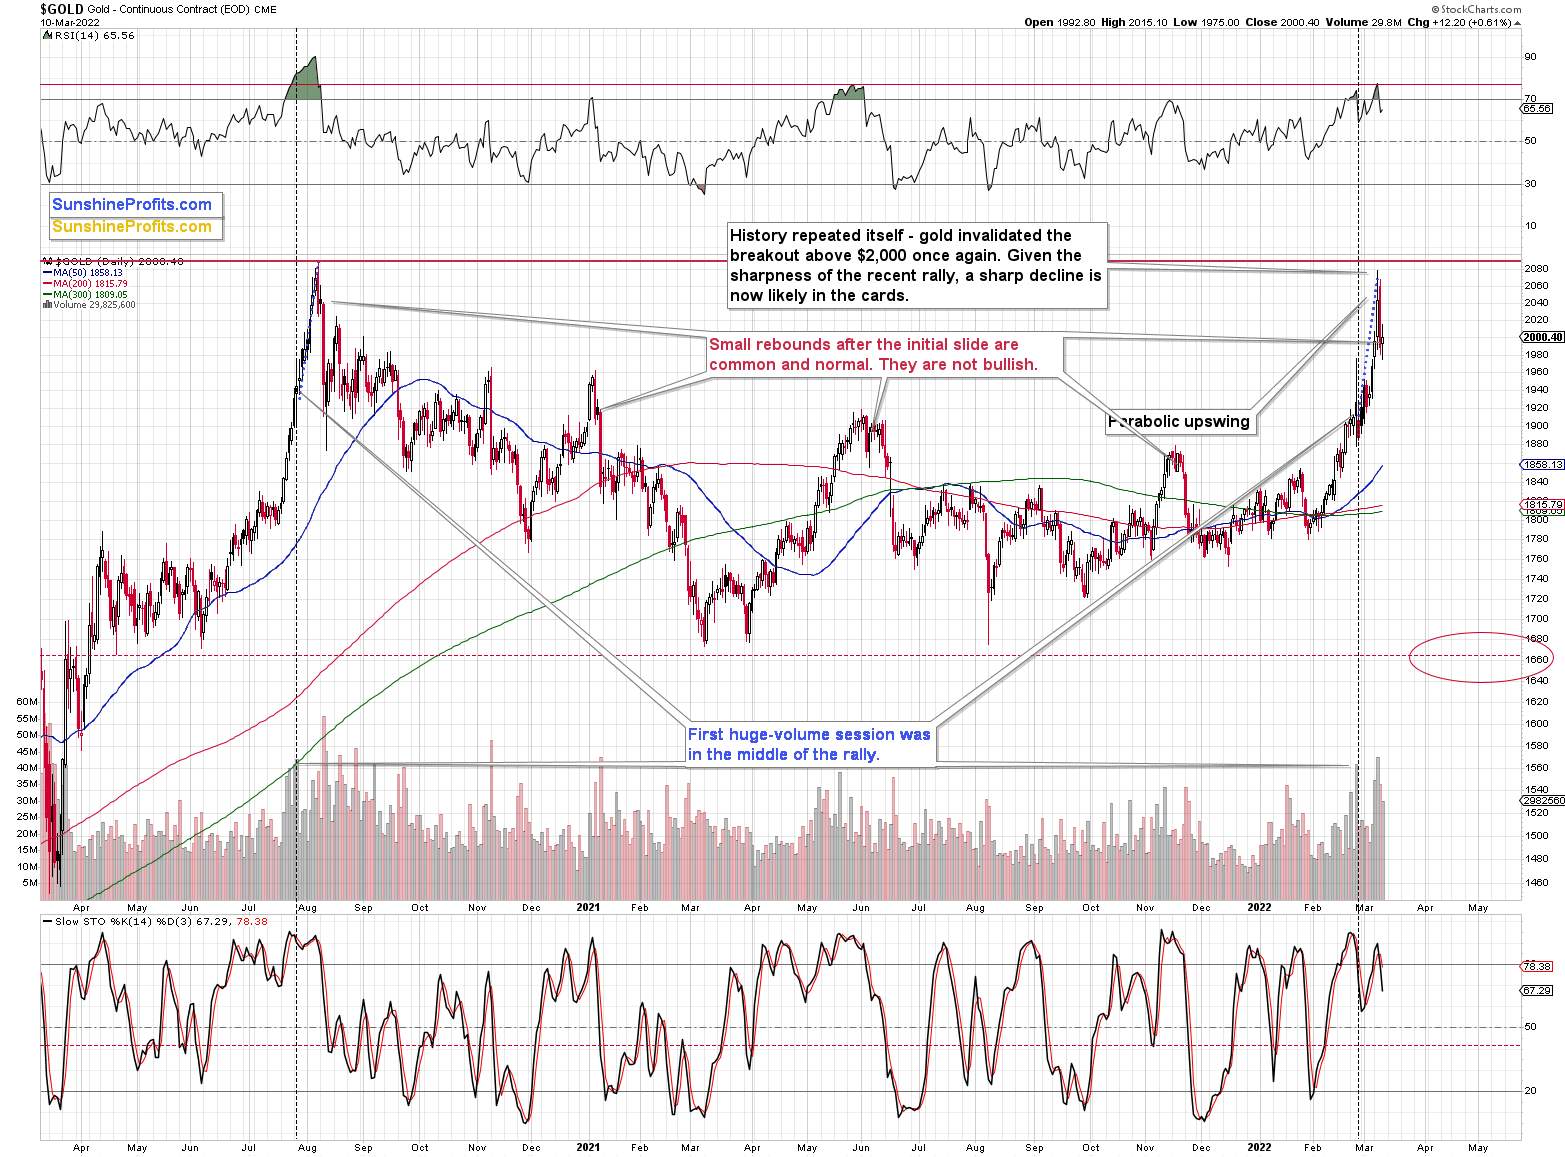
Gold’s move of $0.40 (yes, forty cents) above $2,000 is not important as the breakout above this level was just invalidated the previous day. Technically, this is another attempt to break above this level, which is likely to be invalidated based on what we see in today’s pre-market trading.
The fact that I would like to emphasize today is that this kind of small rebound after the initial slide is common and perfectly normal for gold. We saw exactly the same thing right after gold’s 2020 top and after its 2021 top, and also two times more in 2021 (as marked on the above chart).
This means that yesterday’s upswing is not particularly bullish. It’s a normal post-top reaction. Lower gold values are to be expected.
Let’s see how things look from the long-term point of view.
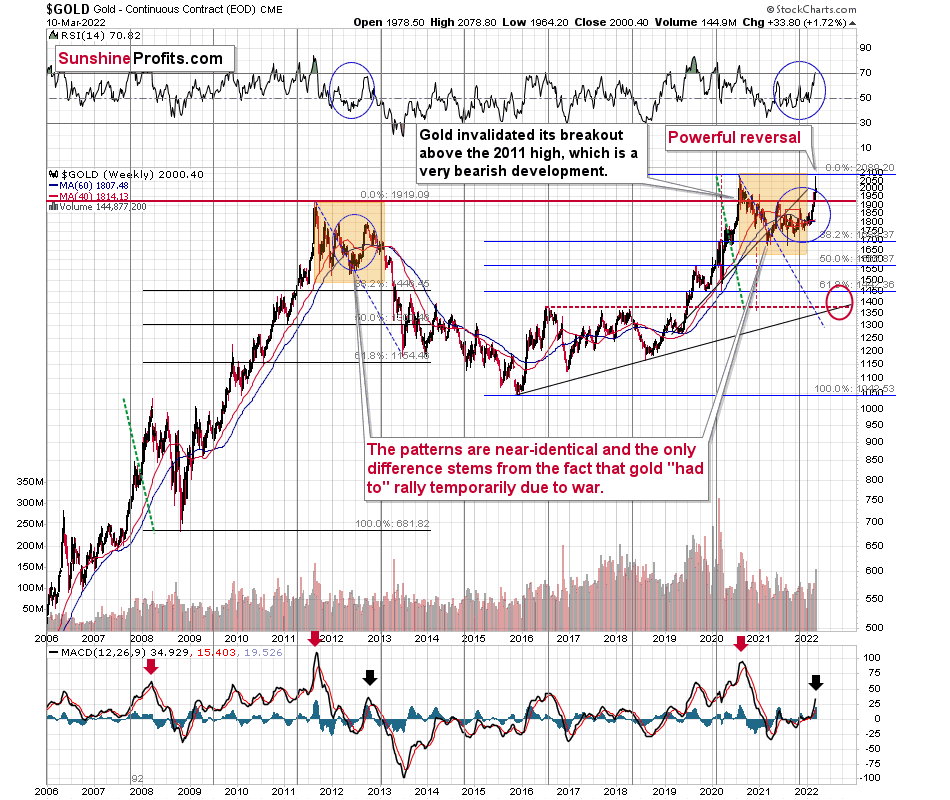
In short, the analogy between 2012 and 2022 remains up-to-date, with one important difference. This time, gold was practically forced to rally due to the safe-haven demand that war triggered. However, as it’s often the case with geopolitical events, their impact is likely to be temporary.
The RSI based on gold’s weekly chart is now above its 2021 high and very close to the 70 level, which is in tune with what we saw in 2012 (at the top) and it’s a major sell signal on its own.
The move higher in the MACD indicator (bottom of the above chart) is also noticeable, which is in tune with what we saw at the 2012 top.
This week is not over yet, but the nature of this week’s trading already seems clear. Namely, we’re likely to see a powerful weekly shooting star reversal candlestick. This is a very bearish indication for the following weeks and months.
Even the moving averages (40- and 60-week ones) are trading close to each other, just like what we saw in late 2012. Back then, they marked the target for the very initial decline from the top.
If this part of history were to be repeated, we could see some sort of short-term rebound (nothing major, though) after gold declines to about $1,800. This would be in tune with the analogy to 2003, when gold gave back all the war-based premium.
This would likely have a devastating impact on the prices of mining stocks. The latter would also likely suffer when the general stock market slides, and it seems that we won’t have to wait too long for that either.
Speaking of mining stocks and about the analogy to 2012, please note that this similarity continues to be present in the HUI Index.
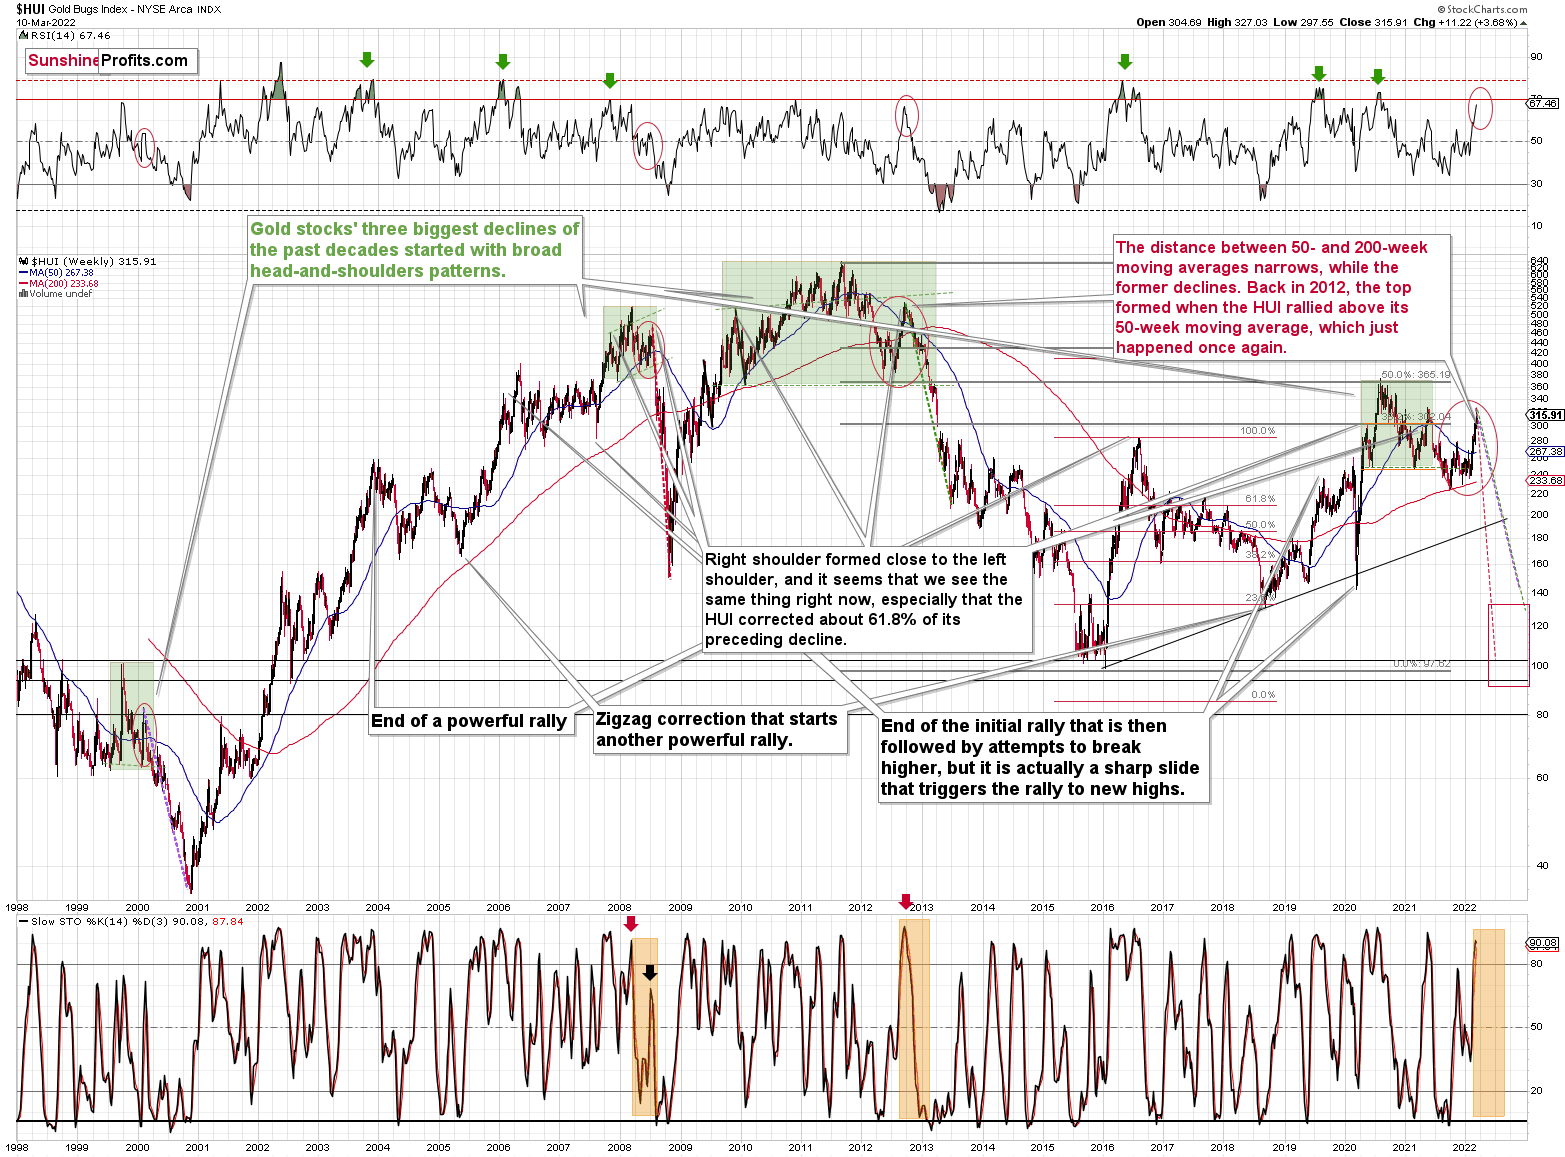
If you look at the areas marked with red circles (especially: now, 2012/2013, and 2008), you’ll notice that they are very similar. These are the sizable short-term rallies that we saw after / in the final parts of the broad head-and-shoulders patterns.
The moves were quite sizable – the 2012 rally was even bigger than the current one, even though there was no war in Europe at that time.
Based on how broad the pattern is and self-similarity present in gold, it seems that the analogy to what happened in 2012 is most important right now.
Looking at the moving averages, we see that the 50-week moving average (blue) and 200-week moving average (red) performed quite specifically in late 2012, and we see the same thing this year.
The distance between 50- and 200-week moving averages currently narrows, while the former declines. Back in 2012, the top formed when the HUI rallied above its 50-week moving average, which just happened once again.
The RSI indicator (above the price chart), based on the HUI Index’s weekly chart, provides us with another confirmation of the analogy, and the same goes for the stochastic indicator (below the price chart). The former is just below the 70 level – exactly what we saw at the 2012 top, and the latter is above 90 – again, something that we saw at the 2012 top.
As history tends to rhyme, gold stocks are likely to slide, similarly to how they declined in 2012 and 2013.
Still, if the general stock market slides, and that appears likely for the following weeks and months, then we might have a decline that’s actually similar to what happened in 2008. Back then, gold stocks declined profoundly, and they have done so very quickly.
The dashed lines that start from the recent prices are copy-paste versions of the previous declines that started from the final medium-term tops. If the decline is as sharp and as big as what we saw in 2008, gold stocks would be likely to decline sharply, approximately to their 2016 low. If the decline is more moderate, then they could decline “only” to 120 - 150 or so. Either way, the implications are very, very, very bearish for the following weeks.
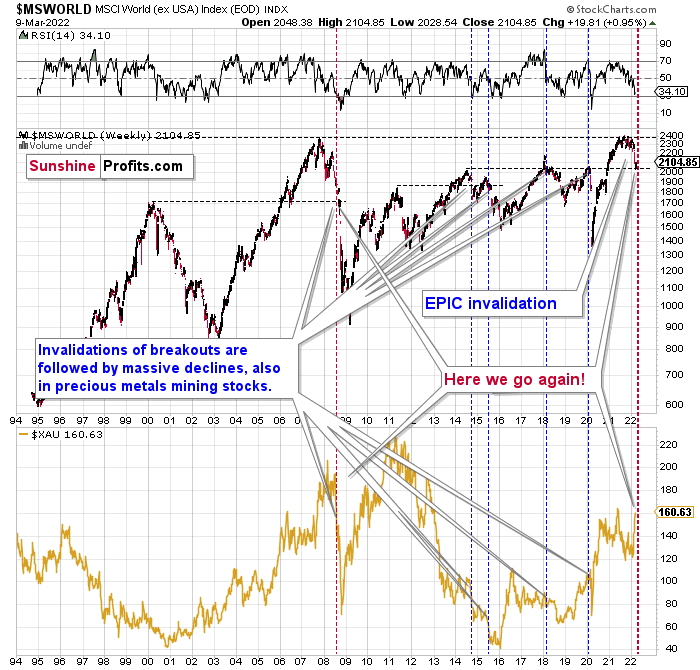
World stocks have already begun their decline, and based on the analogy to the previous invalidations, the decline is not likely to be small. In fact, it’s likely to be huge.
For context, I explained the ominous implications on Nov. 30. I wrote:
Something truly epic is happening in this chart. Namely, world stocks tried to soar above their 2007 high, they managed to do so and… they failed to hold the ground. Despite a few attempts, the breakout was invalidated. Given that there were a few attempts and that the previous high was the all-time high (so it doesn’t get more important than that), the invalidation is a truly critical development.
It's a strong sell signal for the medium- and quite possibly for the long term.
From our – precious metals investors’ and traders’ – point of view, this is also of critical importance. All previous important invalidations of breakouts in world stocks were followed by massive declines in the mining stocks (represented by the XAU Index).
Two of the four similar cases are the 2008 and 2020 declines. In all cases, the declines were huge, and the only reason why they appear “moderate” in the lower part of the above chart is that it has a “linear” and not “logarithmic” scale. You probably still remember how significant and painful (if you were long that is) the decline at the beginning of 2020 was.
Now, all those invalidations triggered big declines in the mining stocks, and we have “the mother of all stock market invalidations” at the moment, so the implications are not only bearish, but extremely bearish.
What does it mean? It means that it is time when being out of the short position in mining stocks to get a few extra dollars from immediate-term trades might be risky. The possibility that the omicron variant of Covid makes vaccination ineffective is too big to be ignored as well. If that happens, we might see 2020 all over again – to some extent. In this environment, it looks like the situation is “pennies to the upside and dollars to the downside” for mining stocks. Perhaps tens of dollars to the downside… You have been warned.
World stocks have declined to their previous highs, and when something similar happened in 2008, it meant that both stocks and gold and silver mining stocks (lower part of the chart) were about to slide much further. In particular, that’s when the corrective upswing in the miners ended and the huge slide started. The implications for mining stocks are extremely bearish.
Here's how the situation currently looks from the U.S. point of view. The chart below features the S&P 500 futures.
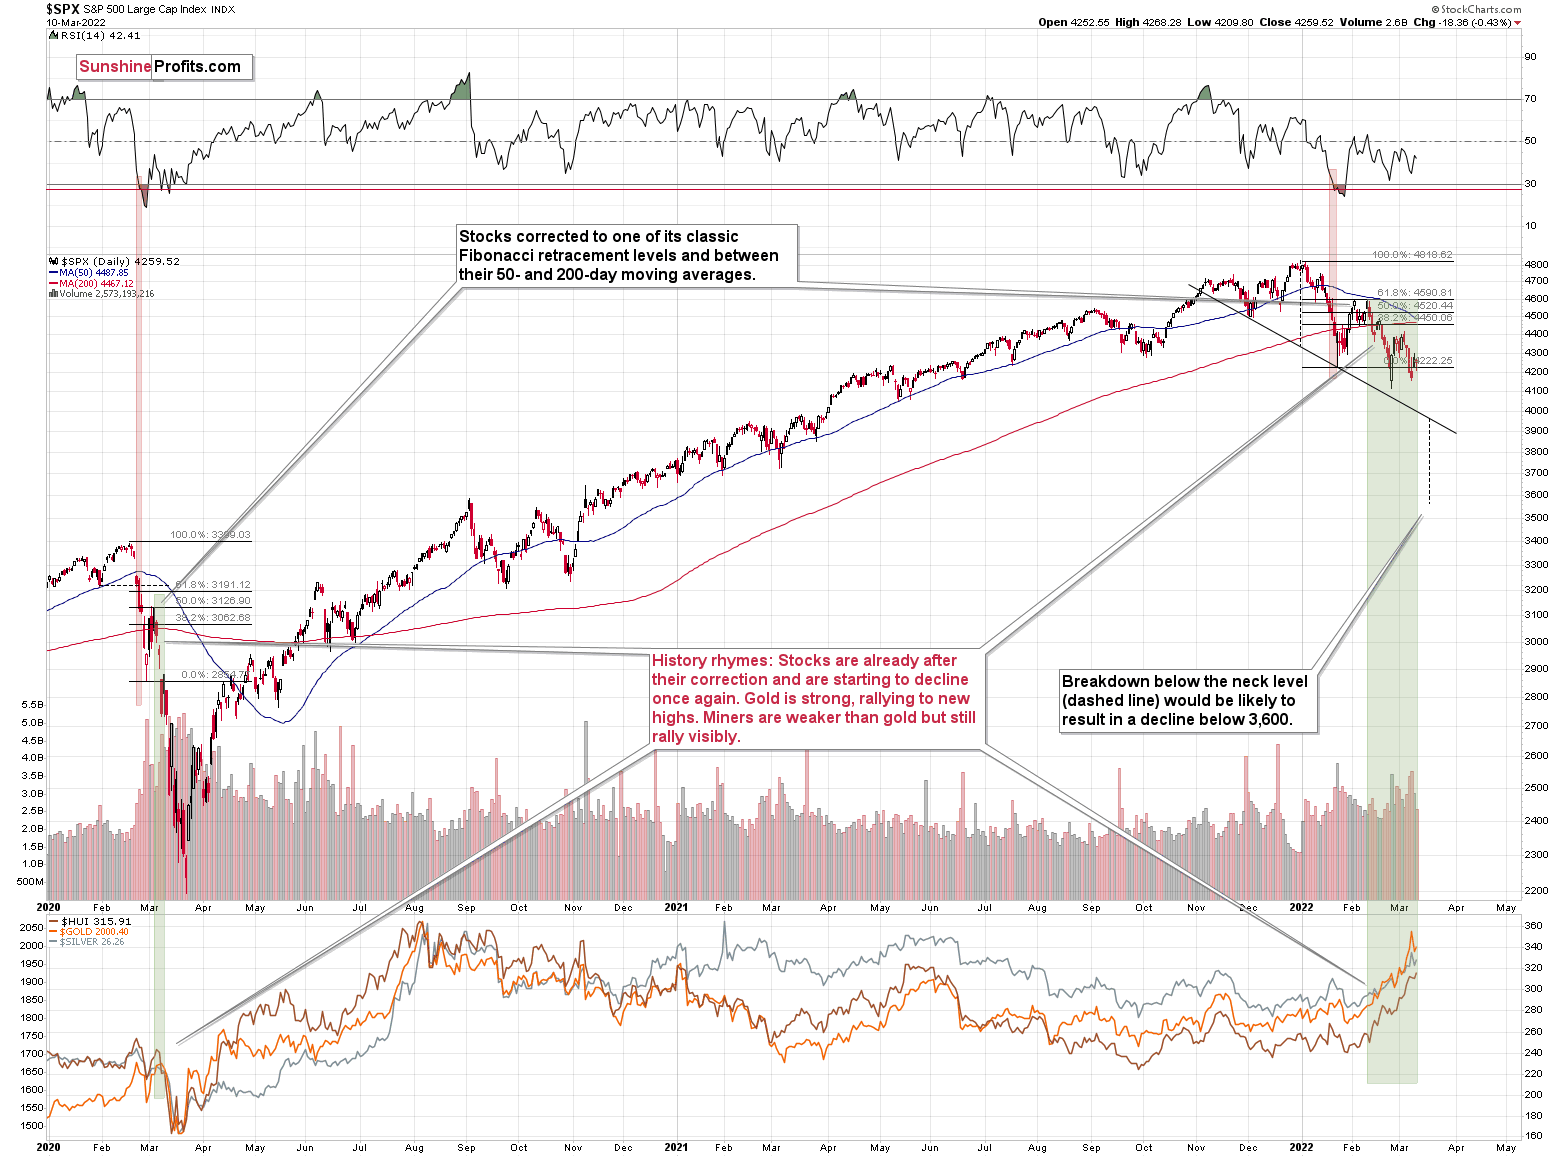
The key thing about the above chart is that what we’ve seen this year is the biggest decline since 2020, and the size of the recent slide is comparable to what we saw as the initial wave down in 2020. If these moves are analogous, the recent rebound is normal – there was one in early 2020 too. This also means that a much bigger decline is likely in the cards in the coming weeks.
Stocks have not yet declined significantly below the previous lows, but it seems that they are on the verge of doing so. If 2020 could teach us anything, the following slide could be huge and sharp.
The volatility won’t necessarily match the 2020 one, but the decline is likely to be significant, anyway.
Let’s keep in mind that the interest rates are likely to go higher, and that sanctions on Russia could impact global trade in multiple ways, thus negatively affecting the stock market.
This would be likely to have a very negative impact on the precious metals market, in particular on junior mining stocks (initially) and silver (a bit later).
Speaking of silver, the white metal just invalidated the move above its 61.8% Fibonacci retracement.
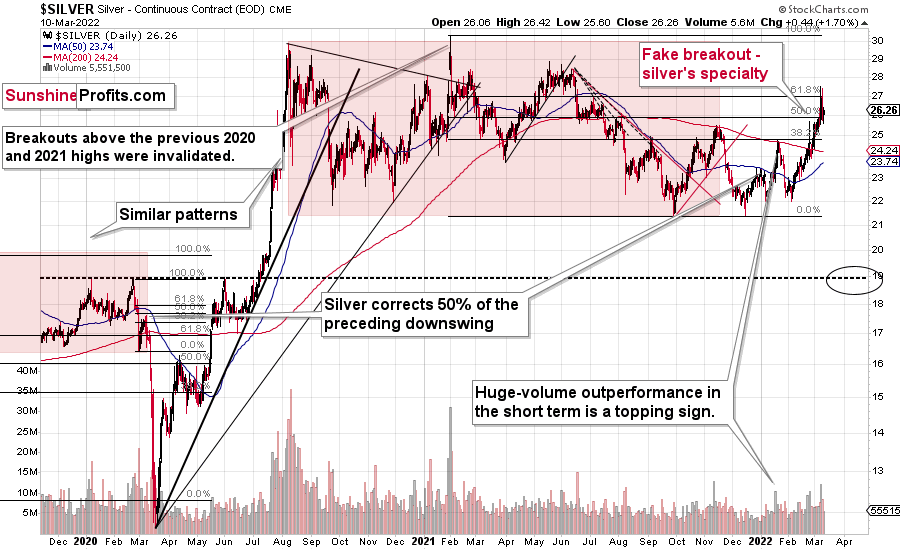
That’s bearish on its own, but let’s keep in mind that it happened right after silver outperformed gold.
On Tuesday, the GDXJ ETF was up by less than 1%, gold was up by 2.37%, and silver was up by 4.57%. Silver’s outperformance and miners’ underperformance is what we tend to see right at the tops. That’s exactly what it was – a top. Silver declined profoundly, and the attempt to break above its 61.8% Fibonacci retracement level will soon be just a distant (in terms of price) memory.
On a medium-term basis, silver was simply weak relative to gold, but we saw short-term outperformance. In short, that was and continues to be bearish.
How high could silver go before declining? Given all that I wrote above, I think that silver’s top is already in. However, if it isn’t, I don’t think it would manage to move above $30.
As far as silver’s big picture is concerned, please note that it also provides us with a confirmation of the analogy between 2012 and now.
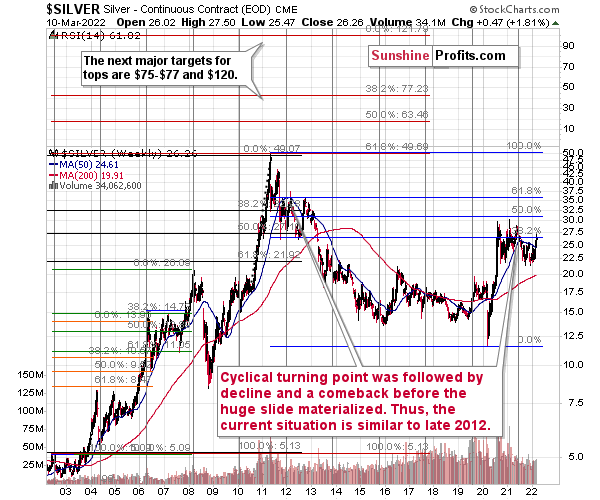
At the turn of the year in 2011/2012, there was a cyclical turning point in silver, and we saw a sizable decline in silver shortly thereafter. The same happened in 2021, after silver’s cyclical turning point.
Back in 2012, silver declined more or less to its previous lows and then rallied back up, but it didn’t reach its previous top. It more or less rallied to its 50-week moving average and then by about the same amount before topping.
Recently, we saw exactly the same thing. After the initial decline, silver bottomed close to its previous lows, and most recently it rallied to its 50-week moving average and then by about the same amount before topping – below the previous high.
Thus, the situation is just like what it was during the 2012 top in all three key components of the precious metals sector: in gold, silver, and mining stocks.
We have a situation in the general stock market that points to an even quicker slide than what we saw in 2012-2013. If stocks slide sharply and significantly just like in 2008, then the same fate may await the precious metals sector – just like in 2008. In this case, silver and mining stocks (in particular, junior mining stocks) would be likely to fall in a spectacular manner.
Speaking of junior miners, let’s take a look at their recent price moves.
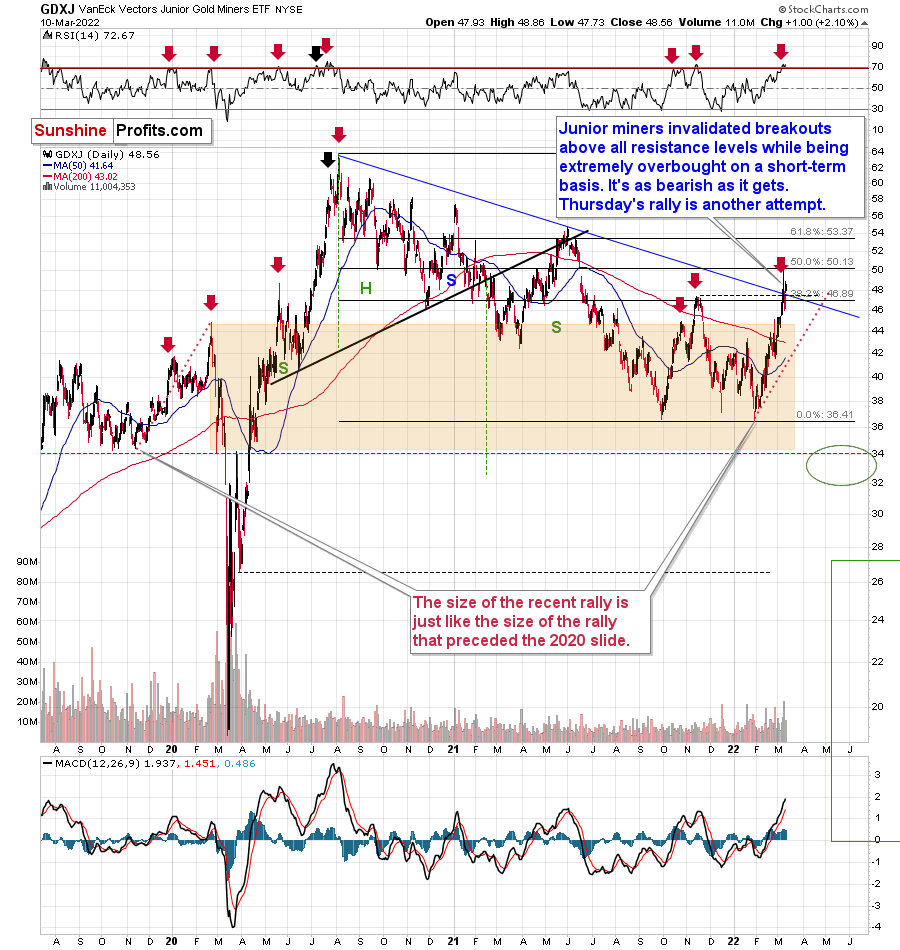
Junior miners invalidated their triple breakout so it was a triple invalidation, and thus a very strong sell sign. The resistance levels that were broken initially are:
- 38.2% Fibonacci retracement level;
- declining (blue) resistance line;
- late-2021 top.
Invalidations of breakouts are bearish as they show that a given market’s strength was not real and that sellers were able to overwhelm the buyers.
While mining stocks underperformed gold in a rather extreme manner on Tuesday, silver outperformed it on the same day. This was a bearish indication, and indeed, it was followed by lower prices.
During yesterday’s trading, we saw a 2.10% rally, so it’s another attempt by junior miners to break higher. However, will it be successful?
I strongly doubt it. The long-term indications are much more powerful than the short-term ones, and given what I already wrote in today’s analysis, it’s simply unlikely that junior would be able to trigger an additional rally from here.
Some might say that what we saw yesterday is a sign of strength as junior moved higher more visibly than gold did, but please note that miners’ strength is particularly bullish at the beginning of a given upswing or at the end of a downswing. Miners are in neither of those. Instead, what we could see is fake strength that’s present just before the slide, in analogy to what we saw at the very beginning of 2016. Back then, we saw fake weakness when miners broke to new lows while gold didn’t.
Given what gold is doing and what’s happening in the general stock market, it seems that the next big move in junior mining stocks will be to the downside.
Investing and trading are difficult. If it was easy, most people would be making money – and they’re not. Right now, it’s most difficult to ignore the urge to “run for cover” if you physically don’t have to. The markets move on “buy the rumor and sell the fact.” This repeats over and over again in many (all?) markets, and we have direct analogies to similar situations in gold itself. Junior miners are likely to decline the most, also based on the massive declines that are likely to take place (in fact, they have already started) in the stock markets.
Overview of the Upcoming Part of the Decline
- It seems to me that the corrective upswing is now over or very close to being over , and that gold, silver, and mining stocks are now likely to continue their medium-term decline.
- It seems that the first (bigger) stop for gold will be close to its previous 2021 lows, slightly below $1,700. Then it will likely correct a bit, but it’s unclear if I want to exit or reverse the current short position based on that – it depends on the number and the nature of the bullish indications that we get at that time.
- After the above-mentioned correction, we’re likely to see a powerful slide, perhaps close to the 2020 low ($1,450 - $1,500).
- If we see a situation where miners slide in a meaningful and volatile way while silver doesn’t (it just declines moderately), I plan to – once again – switch from short positions in miners to short positions in silver. At this time, it’s too early to say at what price levels this could take place, and if we get this kind of opportunity at all – perhaps with gold close to $1,600.
- I plan to exit all remaining short positions once gold shows substantial strength relative to the USD Index while the latter is still rallying. This may be the case with gold close to $1,350 - $1,400. I expect silver to fall the hardest in the final part of the move. This moment (when gold performs very strongly against the rallying USD and miners are strong relative to gold after its substantial decline) is likely to be the best entry point for long-term investments, in my view. This can also happen with gold close to $1,375, but at the moment it’s too early to say with certainty.
- As a confirmation for the above, I will use the (upcoming or perhaps we have already seen it?) top in the general stock market as the starting point for the three-month countdown. The reason is that after the 1929 top, gold miners declined for about three months after the general stock market started to slide. We also saw some confirmations of this theory based on the analogy to 2008. All in all, the precious metals sector is likely to bottom about three months after the general stock market tops.
- The above is based on the information available today, and it might change in the following days/weeks.
You will find my general overview of the outlook for gold on the chart below:
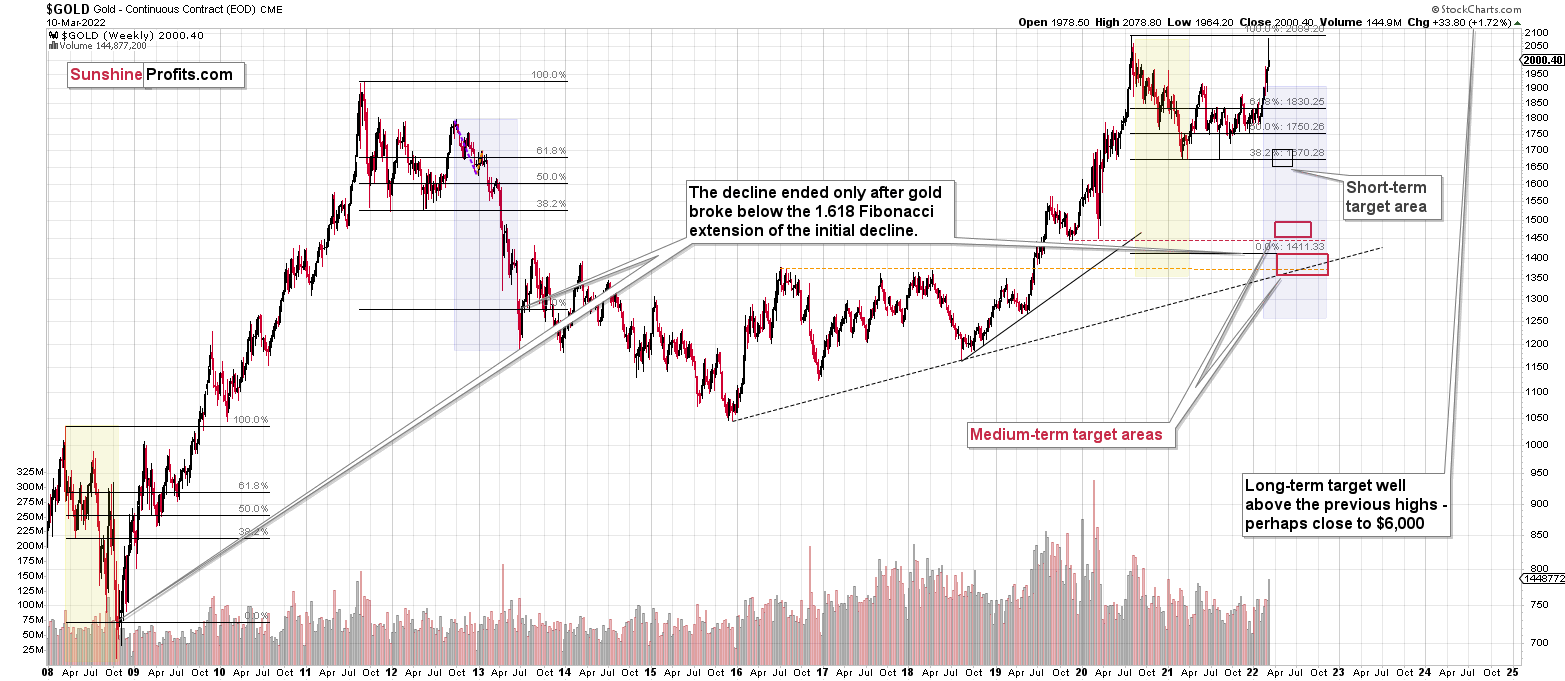
Please note that the above timing details are relatively broad and “for general overview only” – so that you know more or less what I think and how volatile I think the moves are likely to be – on an approximate basis. These time targets are not binding or clear enough for me to think that they should be used for purchasing options, warrants or similar instruments.
Summary
Summing up, despite the recent rally in gold, the outlook for junior mining stocks remains exactly as I described previously.
Crude oil’s extreme outperformance, the stock market’s weakness, and critical medium-term resistance levels reached by gold (all-time high!) and junior mining stocks, all indicate that the tops are at hand or have just formed. The huge-volume reversals in gold and (especially) mining stocks, along with silver’s short-term outperformance, all point to lower precious metals prices in the following days/weeks. It seems that the top is in.
Investing and trading are difficult. If it was easy, most people would be making money – and they’re not. Right now, it’s most difficult to ignore the urge to “run for cover” if you physically don’t have to. The markets move on “buy the rumor and sell the fact.” This repeats over and over again in many (all?) markets, and we have direct analogies to similar situations in gold itself. Junior miners are likely to decline the most, also based on the massive declines that are likely to take place (in fact, they have already started) in the stock markets.
From the medium-term point of view, the two key long-term factors remain the analogy to 2013 in gold and the broad head and shoulders pattern in the HUI Index. They both suggest much lower prices ahead.
It seems that our profits from short positions are going to become truly epic in the coming months.
After the sell-off (that takes gold to about $1,350-$1,500), I expect the precious metals to rally significantly. The final part of the decline might take as little as 1-5 weeks, so it's important to stay alert to any changes.
Most importantly, please stay healthy and safe. We made a lot of money last March and this March, and it seems that we’re about to make much more in the upcoming decline, but you have to be healthy to enjoy the results.
As always, we'll keep you - our subscribers - informed.
To summarize:
Trading capital (supplementary part of the portfolio; our opinion): Full speculative short positions (300% of the full position) in junior mining stocks are justified from the risk to reward point of view with the following binding exit profit-take price levels:
Mining stocks (price levels for the GDXJ ETF): binding profit-take exit price: $34.63; stop-loss: none (the volatility is too big to justify a stop-loss order in case of this particular trade)
Alternatively, if one seeks leverage, we’re providing the binding profit-take levels for the JDST (2x leveraged) and GDXD (3x leveraged – which is not suggested for most traders/investors due to the significant leverage). The binding profit-take level for the JDST: $14.98; stop-loss for the JDST: none (the volatility is too big to justify a SL order in case of this particular trade); binding profit-take level for the GDXD: $25.48; stop-loss for the GDXD: none (the volatility is too big to justify a SL order in case of this particular trade).
For-your-information targets (our opinion; we continue to think that mining stocks are the preferred way of taking advantage of the upcoming price move, but if for whatever reason one wants / has to use silver or gold for this trade, we are providing the details anyway.):
Silver futures downside profit-take exit price: $19.12
SLV profit-take exit price: $17.72
ZSL profit-take exit price: $38.28
Gold futures downside profit-take exit price: $1,683
HGD.TO – alternative (Canadian) inverse 2x leveraged gold stocks ETF – the upside profit-take exit price: $11.79
HZD.TO – alternative (Canadian) inverse 2x leveraged silver ETF – the upside profit-take exit price: $29.48
Long-term capital (core part of the portfolio; our opinion): No positions (in other words: cash
Insurance capital (core part of the portfolio; our opinion): Full position
Whether you already subscribed or not, we encourage you to find out how to make the most of our alerts and read our replies to the most common alert-and-gold-trading-related-questions.
Please note that we describe the situation for the day that the alert is posted in the trading section. In other words, if we are writing about a speculative position, it means that it is up-to-date on the day it was posted. We are also featuring the initial target prices to decide whether keeping a position on a given day is in tune with your approach (some moves are too small for medium-term traders, and some might appear too big for day-traders).
Additionally, you might want to read why our stop-loss orders are usually relatively far from the current price.
Please note that a full position doesn't mean using all of the capital for a given trade. You will find details on our thoughts on gold portfolio structuring in the Key Insights section on our website.
As a reminder - "initial target price" means exactly that - an "initial" one. It's not a price level at which we suggest closing positions. If this becomes the case (like it did in the previous trade), we will refer to these levels as levels of exit orders (exactly as we've done previously). Stop-loss levels, however, are naturally not "initial", but something that, in our opinion, might be entered as an order.
Since it is impossible to synchronize target prices and stop-loss levels for all the ETFs and ETNs with the main markets that we provide these levels for (gold, silver and mining stocks - the GDX ETF), the stop-loss levels and target prices for other ETNs and ETF (among other: UGL, GLL, AGQ, ZSL, NUGT, DUST, JNUG, JDST) are provided as supplementary, and not as "final". This means that if a stop-loss or a target level is reached for any of the "additional instruments" (GLL for instance), but not for the "main instrument" (gold in this case), we will view positions in both gold and GLL as still open and the stop-loss for GLL would have to be moved lower. On the other hand, if gold moves to a stop-loss level but GLL doesn't, then we will view both positions (in gold and GLL) as closed. In other words, since it's not possible to be 100% certain that each related instrument moves to a given level when the underlying instrument does, we can't provide levels that would be binding. The levels that we do provide are our best estimate of the levels that will correspond to the levels in the underlying assets, but it will be the underlying assets that one will need to focus on regarding the signs pointing to closing a given position or keeping it open. We might adjust the levels in the "additional instruments" without adjusting the levels in the "main instruments", which will simply mean that we have improved our estimation of these levels, not that we changed our outlook on the markets. We are already working on a tool that would update these levels daily for the most popular ETFs, ETNs and individual mining stocks.
Our preferred ways to invest in and to trade gold along with the reasoning can be found in the how to buy gold section. Furthermore, our preferred ETFs and ETNs can be found in our Gold & Silver ETF Ranking.
As a reminder, Gold & Silver Trading Alerts are posted before or on each trading day (we usually post them before the opening bell, but we don't promise doing that each day). If there's anything urgent, we will send you an additional small alert before posting the main one.
Thank you.
Przemyslaw Radomski, CFA
Founder, Editor-in-chief
To summarize:
Short-term outlook for the precious metals sector (our opinion on the next 1-6 weeks): Bearish
Medium-term outlook for the precious metals sector (our opinion for the period between 1.5 and 6 months): Bearish initially, then possibly Bullish
Long-term outlook for the precious metals sector (our opinion for the period between 6 and 24 months from now): Bullish
Very long-term outlook for the precious metals sector (our opinion for the period starting 2 years from now): Bullish
As a reminder, Gold Investment Updates are posted approximately once per week. We are usually posting them on Monday, but we can’t promise that it will be the case each week.
Our preferred ways to invest in and to trade gold along with the reasoning can be found in the how to buy gold section. Additionally, our preferred ETFs and ETNs can be found in our Gold & Silver ETF Ranking.
Moreover, Gold & Silver Trading Alerts are posted before or on each trading day (we usually post them before the opening bell, but we don’t promise doing that each day). If there’s anything urgent, we will send you an additional small alert before posting the main one.
Thank you.
Przemyslaw Radomski, CFA
Founder, Editor-in-chief

