

-
Early (Gold Video) Heads-up before the Next Week
December 4, 2021, 12:18 PMIn today’s early heads-up video, I’m talking about yesterday’s rally in gold, what it changed and, most importantly, what it didn’t change. Did you know that gold price declined by just $1.60 last week (0.09%)? Gold stocks (the HUI Index) declined by almost 4%! Let’s just say that the forecast for gold price is not that bullish at this time.
You can access the video using the following link:
-
Gold Investment Update: Can You Hear It? That’s the Crowd Booing Gold’s Downturn
November 29, 2021, 10:10 AMEven though the technicals have been predicting this for several months, people were still taken aback by gold’s fall — that’s why they’re booing.
While the precious metals received a round of applause for their performances in October, I warned on several occasions that the celebration was premature. And with gold, silver, and mining stocks resuming their 2021 downtrends, investors’ cheers have turned into jeers in short order.
To explain, I warned previously that the GDX ETF could rally to or slightly above $35 (the senior miners reached this level intraday on Nov. 12, moving one cent above it). However, with the GDX ETF’s RSI (Relative Strength Index) signaling overbought conditions, I highlighted just how quickly the air often comes out of the balloon. For context, the blue vertical dashed lines below depict the sharp reversals that followed after the GDX ETF’s RSI approached or superseded 70.
Why am I telling you this? To emphasize that what happened recently was neither random nor accidental. What you see is a true, short-term top that formed in tune with previous patterns. You also see a fake inverse head-and-shoulders formation that was invalidated. This means that the implications of what happened really are bearish.
Let’s check why and how, in tune with the past patterns, the previous broad top really was. Please see below:
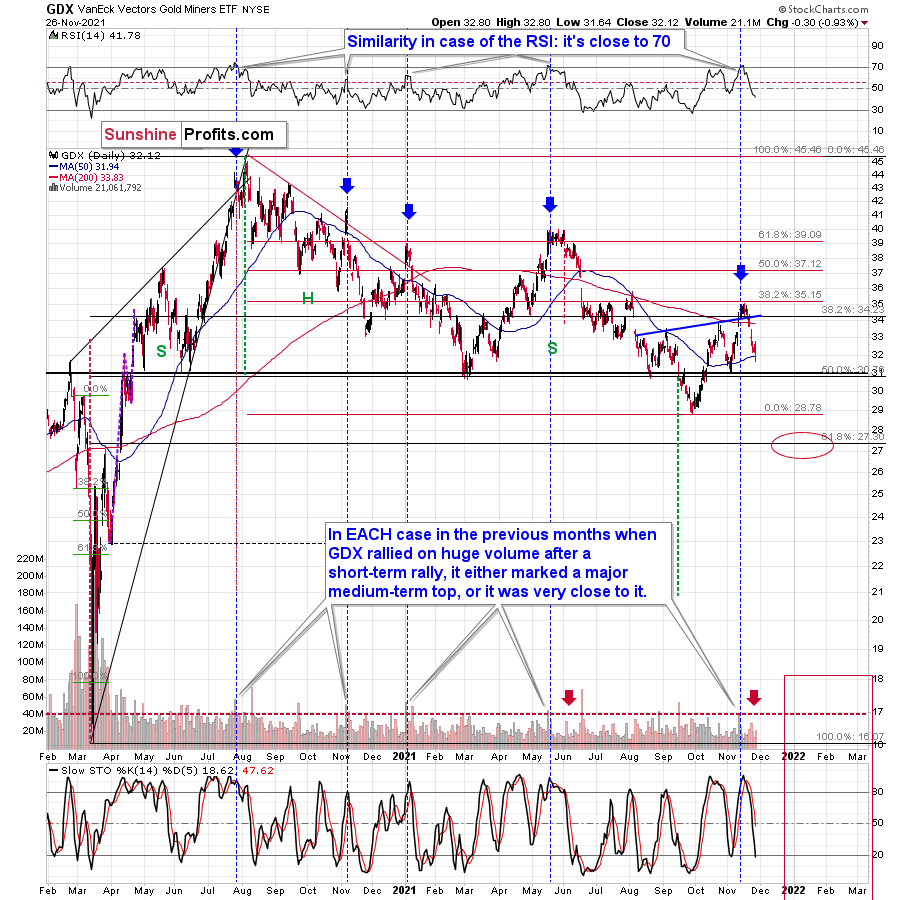
The GDX ETF rallied on huge volume on Nov. 11 and there were only 4 cases in the recent past when we saw something like that after a visible short-term rally.
In EACH of those 4 cases, GDX was after a sharp daily rally.
In EACH of those 4 cases, GDX-based RSI indicator (upper part of the chart above) was trading close to 70.
The rallies that immediately preceded these 4 cases:
- The July 27, 2020 session was immediately preceded by a 29-trading-day rally that took the GDX about 42% higher. It was 7 trading days before the final top (about 24% of time).
- The November 5, 2020 session was immediately preceded by a 5-trading-day rally that took the GDX about 14%-15% higher (the high-volume day / the top). It was 1 trading day before the final top (20% of time).
- The January 4, 2021 session was immediately preceded by a 26-trading-day rally that took the GDX about 17%-18% higher (the high-volume day / the top). It was 1 trading day before the final top (about 4% of time).
- The May 17, 2021 session was immediately preceded by a 52-trading-day rally that took the GDX about 30% higher. It was 7 trading days before the final top (about 13% of time).
So, as you can see these sessions have even more in common than it seemed at the first sight. The sessions formed soon before the final tops (4% - 24% of time of the preceding rally before the final top), but the prices didn’t move much higher compared to how much they had already rallied before the high-volume sessions.
Consequently, since history tends to rhyme, it would have been only natural for one to expect the GDX ETF to move a bit higher here (but not significantly so) and for one to assume that this move higher would take between additional 0 to 7 trading days (based on the Nov. 12 session). That’s what is wrote to my subscribers – to expect this kind of performance.
The final top formed on Nov. 16 - 4 trading days after the huge-volume session, practically right in the middle of the expected 0-7 trading day range.
Moreover, since the GDX topped very close to its 38.2% Fibonacci retracement, it seems that miners corrected “enough” for another huge downswing to materialize.
Having said that, let’s move on to more recent developments.
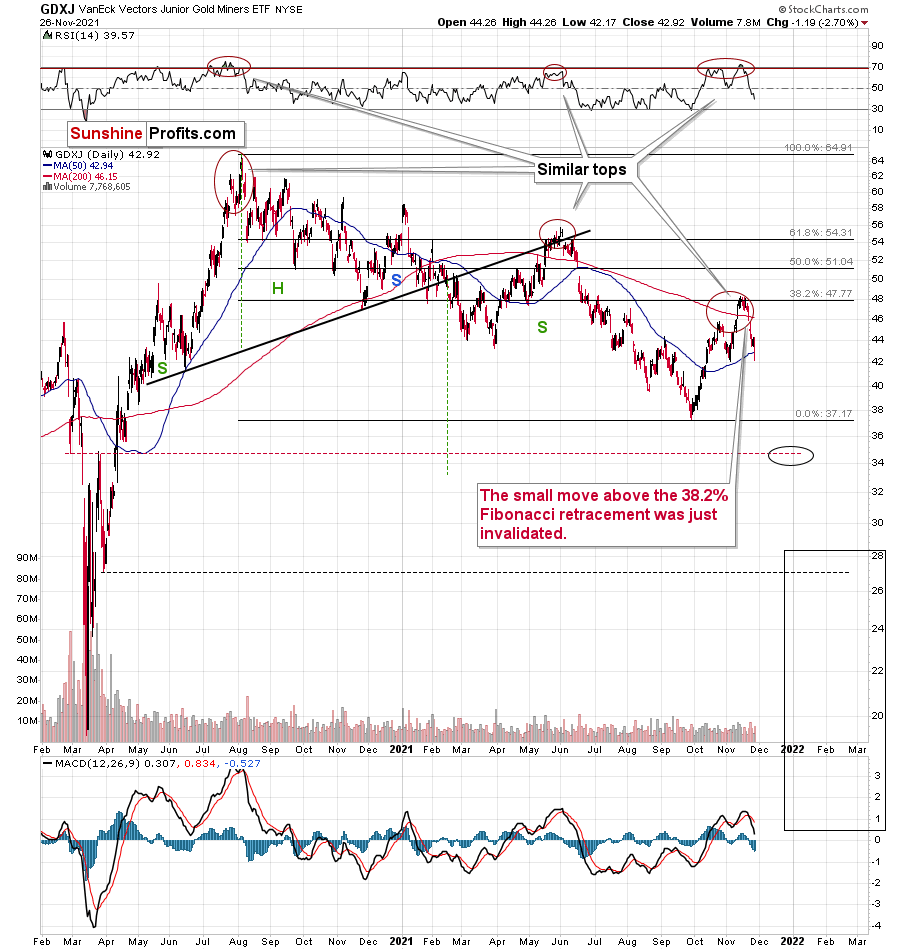
Gold price declined heavily recently and the same goes for the silver price. What’s more, the proxy for junior mining stocks - the GDXJ ETF (our short position) materially underperformed on Nov. 26 – after it declined by nearly 3x the percentage of the GDX ETF – and, in my opinion, more downside is likely to materialize over the medium term.
The GDXJ ETF ended the Nov. 26 session slightly below its 50-day moving average, and the milestone is often a precursor to sharp drawdowns. That’s what happened in late February 2020 and also in mid-June 2021. Big declines followed in both cases.
Moreover, with the S&P 500’s weakness on Nov. 26 mirroring the onslaught that unfolded in early 2020, the GDXJ ETF’s underperformance follows a familiar script. As a result, another ‘flash crash’ for the pair may unfold once again.
Keep in mind, though: while asset prices often don’t move in a straight line, a bullish pause may ensue if/once gold reaches its previous lows. All in all, though, lower lows should confront the GDXJ ETF over the short term and my $35 price target remains up to date. As a reminder, that’s only an interim target, analogous to the late-Feb. 2020 low. Interestingly, it is the February 2020 low along with its late-March 2020 high that created this target.
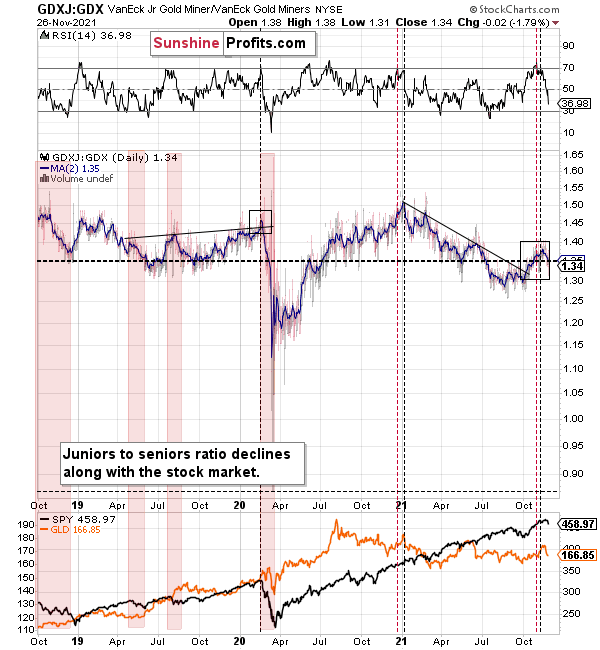
Also, the GDXJ/GDX ratio is falling once again. And with the price action implying that the GDXJ ETF is underperforming the GDX ETF, a drop below 1 isn’t beyond the realms of possibility. In fact, it’s quite likely. As such, this is why I’m shorting the junior mining stocks.
For context, I think that gold, silver and the GDX ETF are all ripe for sharp re-ratings over the medium term. However, I think that the GDXJ ETF offers the best risk-reward proposition due to its propensity to materially underperform during bear markets in the general stock market.
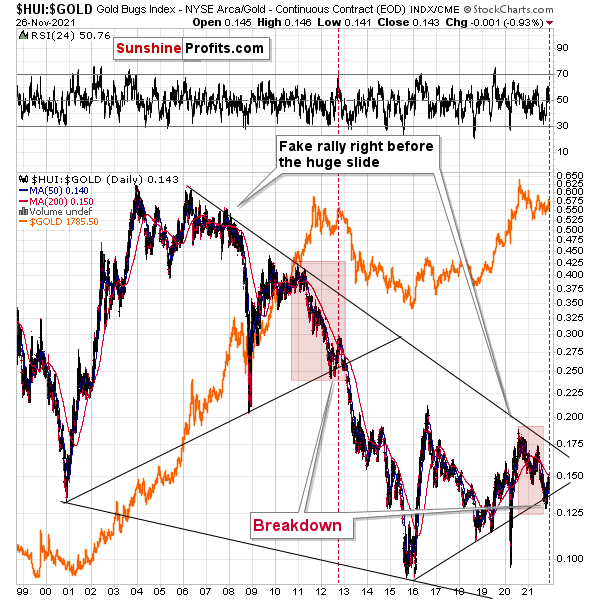
Finally, the HUI Index/gold ratio is also eliciting bearish signals. For example, I marked (with the shaded red boxes below) just how similar the current price action is to 2013. And back then, after a sharp decline was followed by a small corrective upswing before the plunge, the ratio’s current behavior mirrors its historical counterpart.
What’s more, the end of the corrective upswing in 2013 occurred right before gold sunk to its previous lows (marked with red vertical dashed lines in the middle of the chart below). Thus, the ratio is already sending ominous warnings about the PMs’ future path.
In addition, with the S&P 500 acting as the bearish canary in the coal mine, the ratio plunged in 2008 and 2020 when the general stock market tanked. Thus, if a similar event unfolds this time around, the gold miners’ sell-off could occur at a rapid pace.
For more context, I wrote previously:
A major breakdown occurred after the HUI Index/gold ratio sunk below its rising support line (the upward sloping black line on the right side of the chart above). Moreover, with the bearish milestone only achieved prior to gold’s crash in 2012-2013, the ratio’s breakdown in 2013 was the last chance to short the yellow metal at favorable prices. And while I’ve been warning about the ratio’s potential breakdown for weeks, the majority of precious metals investors are unaware of the metric and its implications. As a result, investors’ propensity to ‘buy the dip’ in gold will likely backfire over the medium term.
In conclusion, the crowd has turned on the precious metals, and the narrative has shifted once again. However, despite all of the drama and the volatility that came with it, the technicals have been predicting this outcome for several months. And with the GDXJ ETF down by more than 20% YTD (as of the Nov. 26 close), the junior miners’ 2021 performance is far from critically-acclaimed. As a result, the chorus of boos will likely continue over the short- and/or medium term.
Thank you for reading our free analysis today. Please note that the above is just a small fraction of the full analyses that our subscribers enjoy on a regular basis. They include multiple premium details such as the interim target for gold that could be reached in the next few weeks. We invite you to subscribe now and read today’s issue right away.
Sincerely,
Przemyslaw Radomski, CFA
Founder, Editor-in-chief -
Early (Gold Video) Heads-up before the Next Week
November 28, 2021, 11:07 AMIn today’s early heads-up video, I’m talking about Friday’s intraday reversal in gold price along with a likely reason that caused it (the initial reaction to the omicron variant of the Covid-19). The way gold price reacted tells us quite a lot about the outlook for the following weeks.
You can access the video using the following link:
-
Gold Investment Update: Like the Latest Bond Flick, the US Dollar Has No Time to Die
November 22, 2021, 8:53 AMWhile the dollar is on a tear, precious metal stocks have gotten away with it lately. But how long will their resistance last?
The USD Index (USDX)
After the USD Index’s negative response to the ECB’s monetary policy meeting on Oct. 28, I warned on Oct. 29 that dollar bears were unlikely to celebrate for much longer. I wrote:
Based on the rather random comment during the conference, the traders panicked and bought the EUR/USD, which triggered declines in the USD Index (after all, the EUR/USD is the largest component of the USDX).
Was the breakout to new 2021 lows invalidated? No. The true breakout was above the late-March highs (the August highs also served as a support level, but the March high is more important here) and it wasn’t invalidated.
What was the follow-up action? At the moment of writing these words, the USDX is up and trading at about 93.52, which is just 0.07 below the August high in terms of the closing prices. Consequently, it could easily be the case that the USD Index ends today’s session (and the week) back above this level.
You’ve probably heard the saying that time is more important than price. It’s the end of the month, so let’s check what happened in the case of previous turns of the month; that’s where we usually see major price turnarounds. I marked the short-term turnarounds close to the turns of the month with horizontal dashed blue lines, and it appears that, in the recent past, there was practically always some sort of a turnaround close to the end of the month. Consequently, seeing a turnaround (and a bottom) in the USD index now would be perfectly normal.
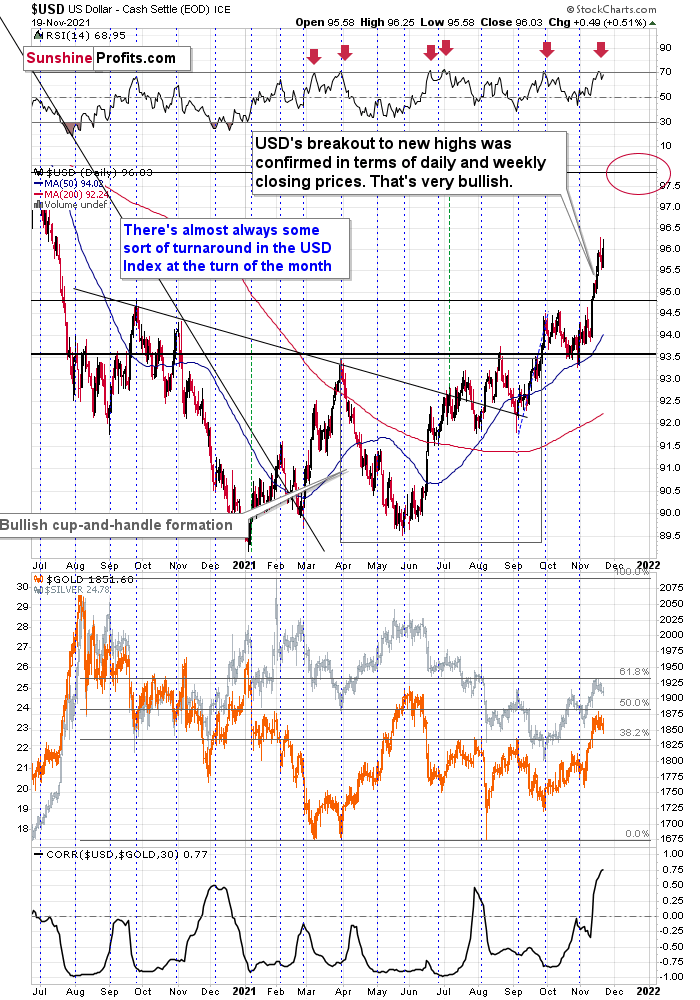
And with the USD Index making quick work of 94, 95, and now 96, the greenback’s rally continues to gain steam. What’s more, the USD Index also surged above its late 2020 resistance and 98 should be the next bullish milestone.
More importantly, however, gold, silver, and mining stocks are sensing that something is amiss. For example, while they largely ignored the USD Index’s recent ascent, their negative correlations resurfaced last week (on a very short-term basis, so far, but still). Moreover, while the precious metals’ recent rallies were likely euro-weakness-driven and not USD Index-strength-driven, the dollar basket’s uprising should elicit more pain for gold, silver, and mining stocks over the medium term.
To explain, I wrote on Nov. 17:
The euro recently declined and the prices of silver and gold recently rallied shortly after dovish comments from the eurozone. Namely, while the expansionary nature of fiscal and monetary decisions in the U.S. might be after its peak (with the infrastructure bill signed even despite high inflation numbers), the eurozone is far from limiting its expansionary (i.e., inflationary) policies, and it was just made clear recently.
That was bearish for the euro and bullish for the gold price – as more money (euros in this case) would be chasing the same amount of physical gold.
The point here is that it might have been the decline in the value of the European currency that caused gold to rally, and it had little to do with what happened in the USD Index.
Don’t get me wrong, most of the time, the gold-USD link is stable and negative. In some cases, gold shows strength or weakness by refusing to move in tune (and precisely: again) with U.S. dollar’s movement. But in this case, it seems that it’s not about the U.S. dollar at all (or mostly), but rather about what happened in the Eurozone and euro recently.
As a result, with the USD Index likely to take the lead in the coming months, the precious metals should suffer along the way. For context, the USD Index is approaching overbought territory and a short-term decline to ~95 isn’t out of the question. However, it’s more of a possibility than a given. Moreover, the greenback’s medium-term outlook remains robust, and any short-term pullback is likely a corrective downswing within a medium-term uptrend.
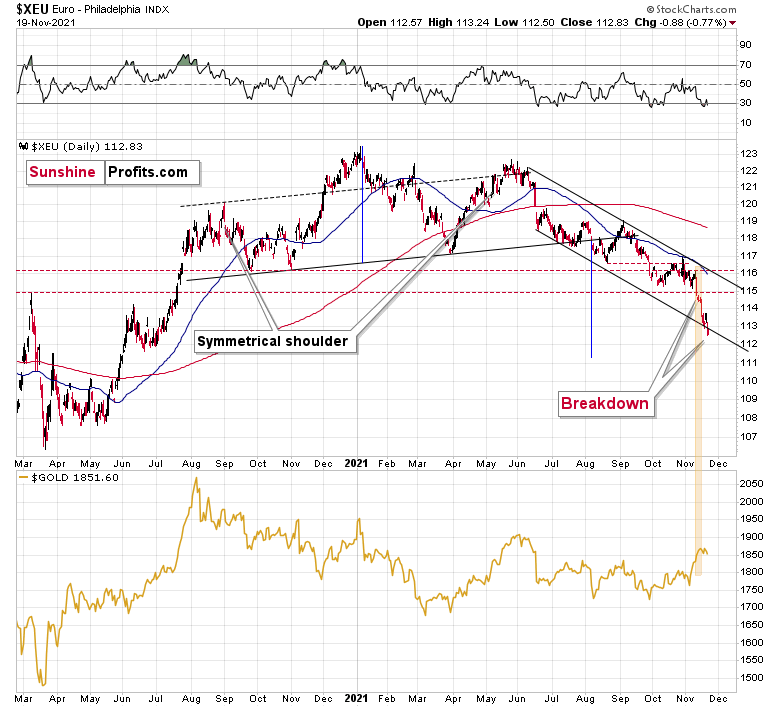
Circling back to the euro, I’ve been warning for months that the Euro Index was materially overvalued and that a sharp re-rating would likely unfold. I wrote previously:
The next temporary stop could be ~1.1500 (the March 2020 highs, then likely lower). For context, the EUR/USD accounts for nearly 58% of the movement of the USD Index, and that’s why the euro’s behavior is so important.
And after the Euro Index sunk to a new 2021 low last week, the European currency has officially fallen off a cliff. To that point, after breaking below the declining support line of its monthly channel, a drawdown to ~111 is likely next in line (which is signaled by the breakdown below its bearish head & shoulders pattern).
The Euro Index is near oversold territory and a short-term bounce may ensue, but the bearish medium-term implications remain intact.
Please see below:
Adding to our confidence (don’t get me wrong, there are no certainties in any market; it’s just that the bullish narrative for the USDX is even more bullish in my view), the USD Index often sizzles in the summer sun and major USDX rallies often start during the middle of the year. Summertime spikes have been mainstays on the USD Index’s historical record and in 2004, 2005, 2008, 2011, 2014 and 2018 a retest of the lows (or close to them) occurred before the USD Index began its upward flights (which is exactly what’s happened this time around).
Furthermore, profound rallies (marked by the red vertical dashed lines below) followed in 2008, 2011 and 2014. With the current situation mirroring the latter, a small consolidation on the long-term chart is exactly what occurred before the USD Index surged in 2014. Likewise, the USD Index recently bottomed near its 50-week moving average; an identical development occurred in 2014. More importantly, though, with bottoms in the precious metals market often occurring when gold trades in unison with the USD Index (after ceasing to respond to the USD’s rallies with declines), we’re still far away from that milestone in terms of both price and duration. Again, the recent move higher in the USD Index doesn’t necessarily apply in the case of the above rule, as it was not the strength of the USD but weakness in the euro that has driven it.
Likewise, with the USD Index now approaching its long-term rising support line (which is now resistance), a rally above the upward sloping black line below would invalidate the prior breakdown and support a move back above 100. However, with the dollar basket’s weekly RSI (Relative Strength Index) now above 70, a short-term consolidation may ensue.
Conversely, please note that the recent medium-term rally has been calmer than any major upswing witnessed over the last 20 years where the USD Index’s RSI has hit 70. I marked the recent rally in the RSI with an orange rectangle and I did the same with the second-least and third-least volatile of the medium-term upswings.
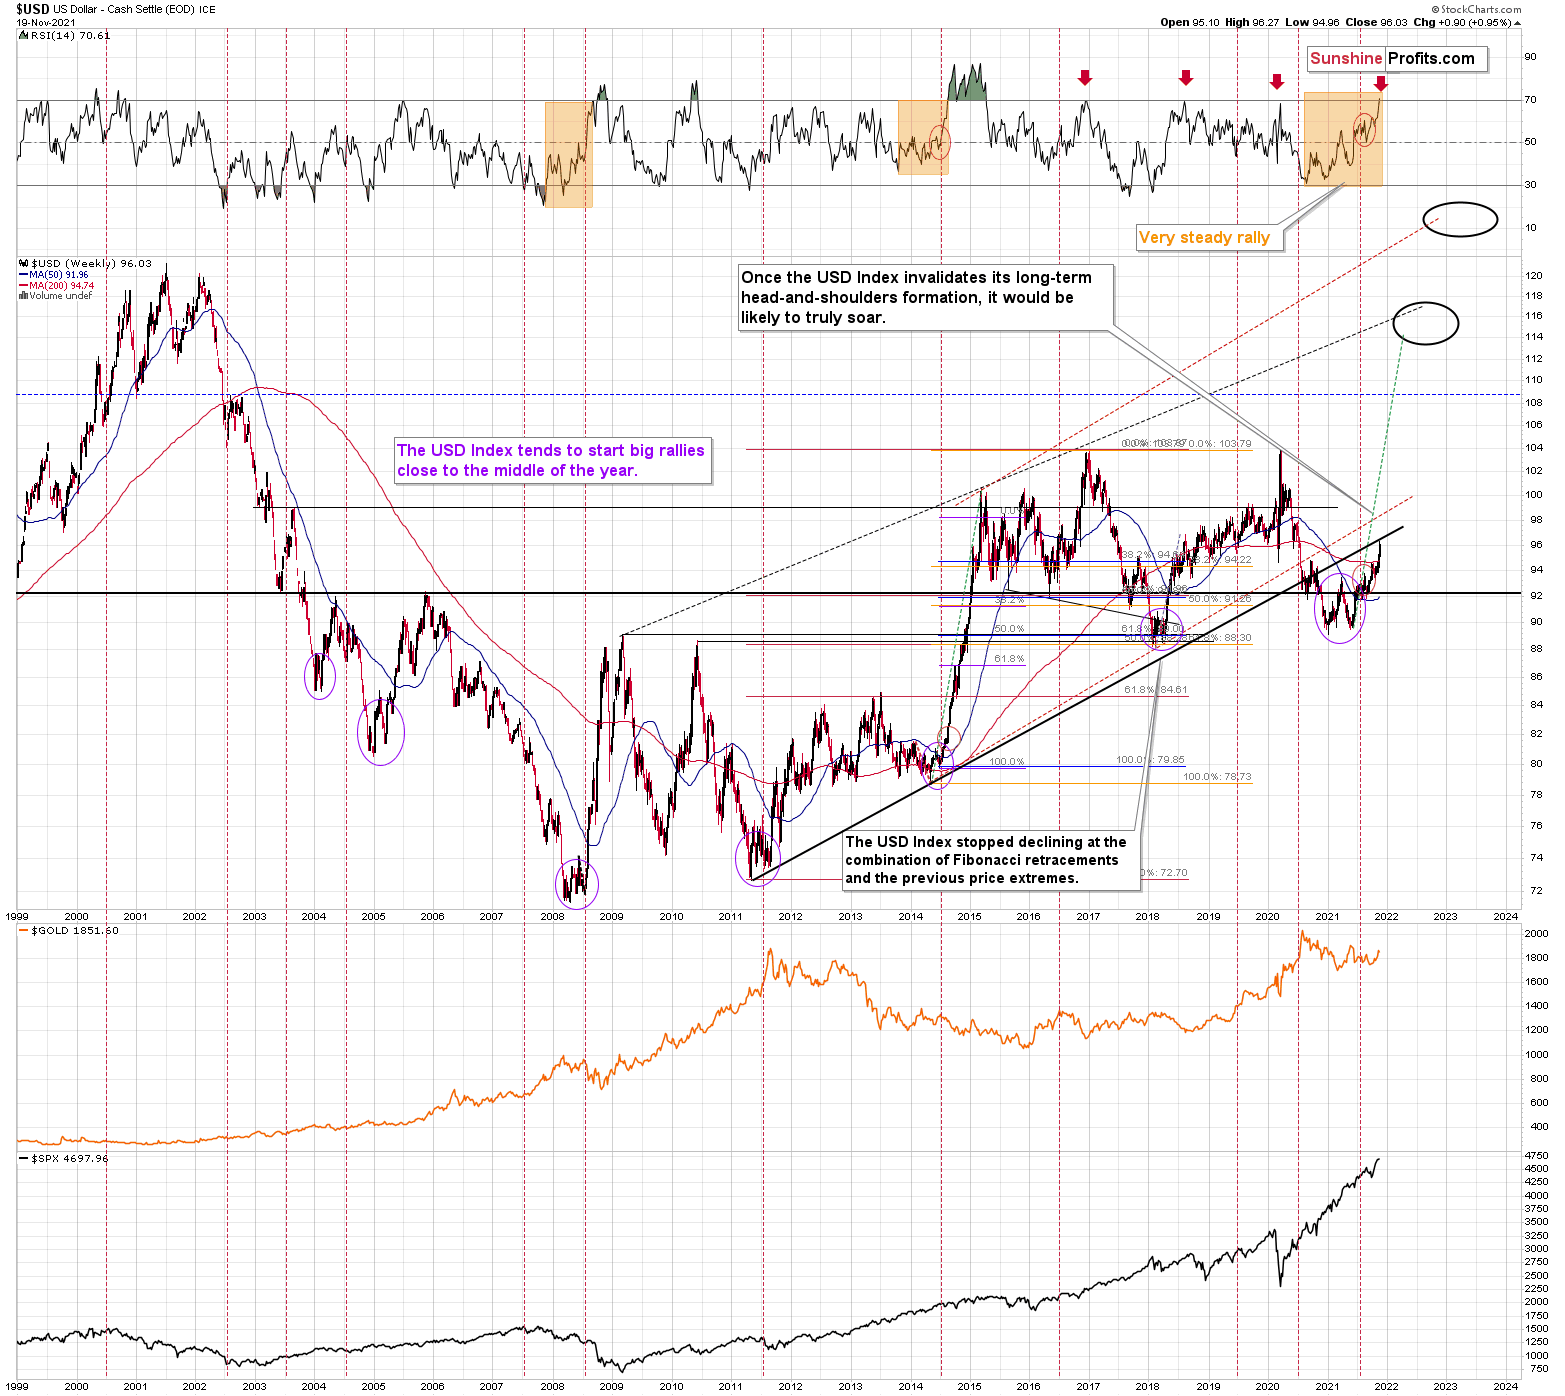
The sharp rallies in 2008 and 2014 were of much larger magnitudes. And in those historical analogies, the USD Index continued its surge for some time without suffering any material corrections.
As a result, the short-term outlook is more of a coin flip. However, the medium-term outlook remains profoundly bullish, and gold, silver, and mining stocks may resent the USD Index’s forthcoming uprising.
Just as the USD Index took a breather before its massive rally in 2014, it seems that we saw the same recently. This means that predicting higher gold prices (or the ones of silver) here is likely not a good idea.
Continuing the theme, the eye in the sky doesn’t lie. And with the USDX’s long-term breakout clearly visible, the wind still remains at the dollar’s back.
Please see below:
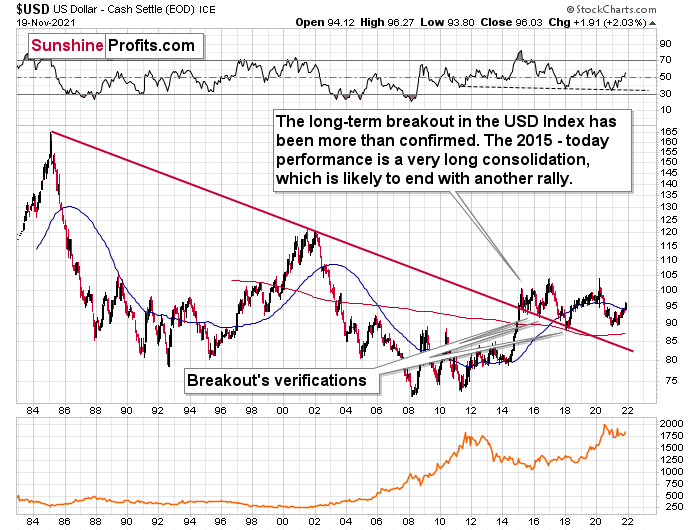
The bottom line?
With my initial 2021 target of 94.5 already hit, the ~98 target is likely to be reached over the medium term, and the USDX will likely exceed 100 at some point over the medium or long term. Keep in mind, though: we’re not bullish on the greenback because of the U.S.’ absolute outperformance. It’s because the region is fundamentally outperforming the Eurozone, the EUR/USD accounts for nearly 58% of the movement of the USD Index, and the relative performance is what really matters.
In conclusion, while the USD Index’s 2021 surge caught the consensus by surprise, I’ve been sounding the bullish alarm for many months. And with more strength likely to materialize over the medium term, the ‘death of the dollar’ narrative has been grossly over-exaggerated. Moreover, while gold, silver, and mining stocks recently ignored the greenback’s fervor, history implies that their relative strength won’t last. As a result, more downside will likely confront the precious metals over the next few months.
Thank you for reading our free analysis today. Please note that the above is just a small fraction of the full analyses that our subscribers enjoy on a regular basis. They include multiple premium details such as the interim target for gold that could be reached in the next few weeks. We invite you to subscribe now and read today’s issue right away.
Sincerely,
Przemyslaw Radomski, CFA
Founder, Editor-in-chief -
Early (Gold Video) Heads-up before the Next Week
November 21, 2021, 11:27 AMIn today’s early heads-up video, I’m talking about the recent performance of gold stock prices (GDX ETF) and I’m providing my forecast for the gold stock prices in the following weeks. And as I outlined last week – the outlook is bearish.
You can access the video using the following link:


Gold Alerts
More-
Status
New 2024 Lows in Miners, New Highs in The USD Index
January 17, 2024, 12:19 PM -
Status
Soaring USD is SO Unsurprising – And SO Full of Implications
January 16, 2024, 8:40 AM -
Status
Rare Opportunity in Rare Earth Minerals?
January 15, 2024, 2:06 PM
Dear Sunshine Profits,


