

-
Gold Investment Update: Thinking the Dollar Will Collapse Is False Hope
February 7, 2022, 11:04 AM
Gold’s latest feats increased investors’ appetite. The outlook for the dollar, however, remains healthy. That can only mean one thing.As volatility erupts across the financial markets, gold and silver prices are being pulled in conflicting directions. For example, with the USD Index suffering a short-term decline, the outcome is fundamentally bullish for the precious metals. However, with U.S. Treasury yields rallying, the outcome is fundamentally bearish for gold and silver prices. Then, with panic selling and panic buying confronting the general stock market, the PMs are dealing with those crosscurrents.
However, with QE on its deathbed and the Fed poised to raise the Federal Funds Rate in the coming months, the common denominator is rising real interest rates. To explain, the euro’s recent popularity has impacted the USD Index. For context, the EUR/USD accounts for nearly 58% of the dollar basket’s movement. Thus, if real interest rates rise and the U.S. dollar falls, what will happen to the PMs?
Well, the reality is that rising real interest rates are bullish for the USD Index, and the euro’s recent ECB-induced rally is far from a surprise. With investors often buying the EUR/USD in anticipation of a hawkish shift from the ECB, another ‘hopeful’ upswing occurred. However, the central bank disappointed investors time and time again in 2021, and the currency pair continued to make new lows. As a result, we expect the downtrend to resume over the medium term.
Supporting our expectations, I wrote the following about financial conditions and the USD Index on Feb. 2:
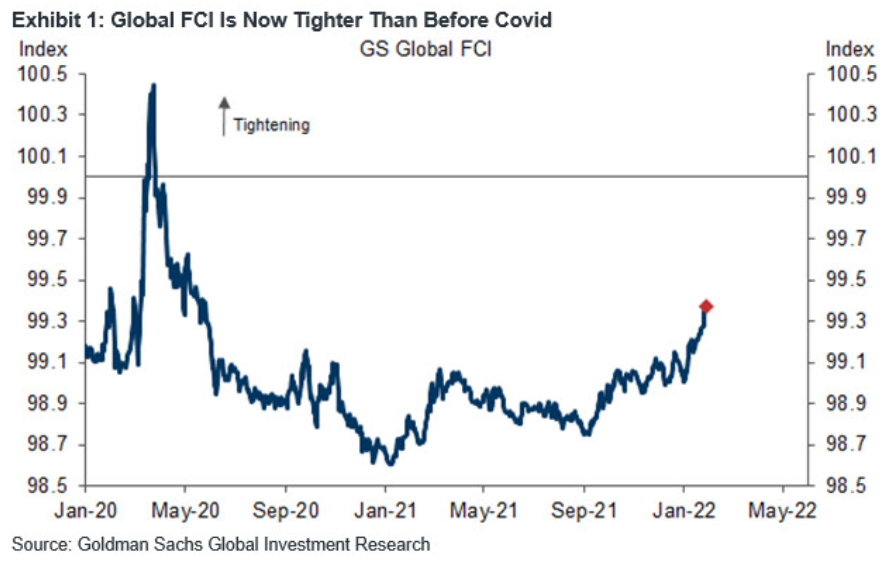
To explain, the blue line above tracks Goldman Sachs' Financial Conditions Index (FCI). For context, the index is calculated as a "weighted average of riskless interest rates, the exchange rate, equity valuations, and credit spreads, with weights that correspond to the direct impact of each variable on GDP." In a nutshell: when interest rates increase alongside credit spreads, it's more expensive to borrow money and financial conditions tighten.
To that point, if you analyze the right side of the chart, you can see that the FCI has surpassed its pre-COVID-19 high (January 2020). Moreover, the FCI bottomed in January 2021 and has been seeking higher ground ever since. In the process, it's no coincidence that the PMs have suffered mightily since January 2021. To that point, with the Fed poised to raise interest rates at its March monetary policy meeting, the FCI should continue its ascent. As a result, the PMs' relief rallies should fall flat like in 2021.
Likewise, while the USD Index has come down from its recent high, it's no coincidence that the dollar basket bottomed with the FCI in January 2021 and hit a new high with the FCI in January 2022. Thus, while the recent consolidation may seem troubling, the medium-term fundamentals supporting the greenback remain robust.
Furthermore, tighter financial conditions are often a function of rising real interest rates. As mentioned, the USD Index bottomed with the FCI and surged to new highs with the FCI. As a result, the fundamentals support a stronger, not weaker USD Index. As evidence, the U.S. 10-Year real yield, the FCI, and the USD Index have traveled similar paths since January 2020.
Please see below:
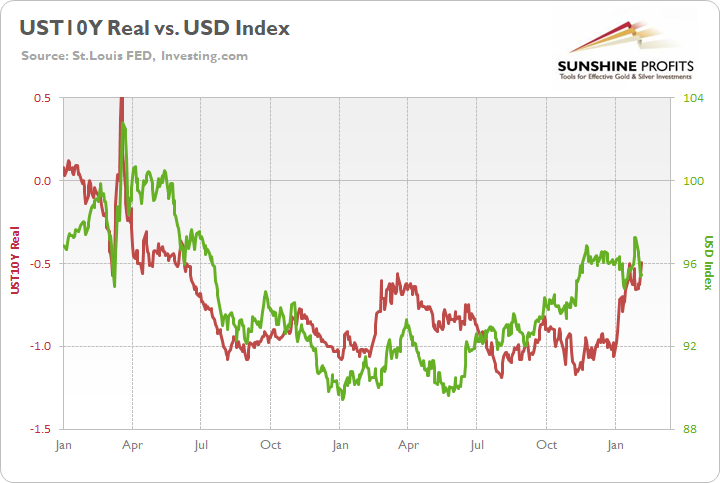
To explain, the green line above tracks the USD Index since January 2020, while the red line above tracks the U.S. 10-Year real yield. While the latter didn’t bottom in January 2021 like the USD Index and the FCI (though it was close), all three surged in late 2021 and hit new highs in 2022. Moreover, the U.S. 10-Year Treasury nominal and real yields hit new 2022 highs on Feb. 4.
In addition, if you compare the two charts, you can see that all three metrics spiked higher when the coronavirus crisis struck in March 2020. As such, the trio often follows in each other’s footsteps. Furthermore, with the Fed likely to raise interest rates at its March monetary policy meeting, this realization supports a higher U.S. 10-Year real yield, and a higher FCI. As a result, the fundamentals underpinning the USD Index remain robust, and short-term sentiment is likely to be responsible for the recent weakness.
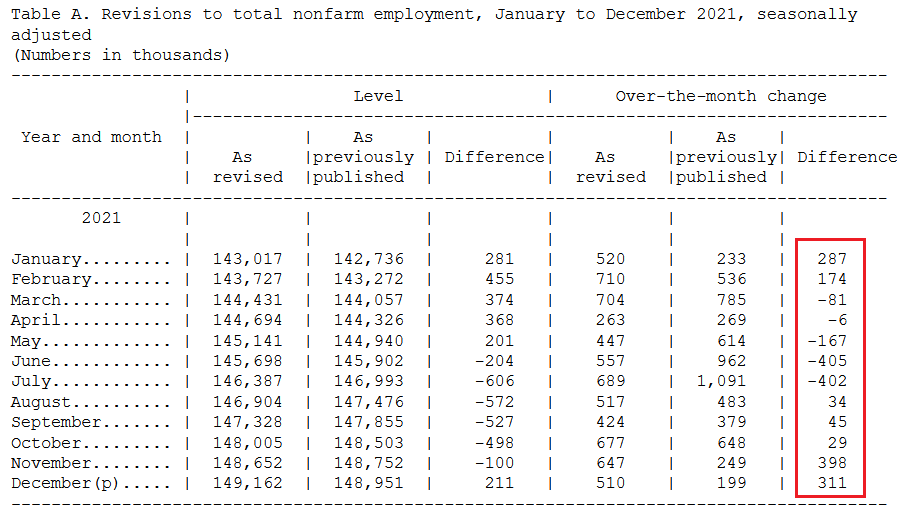
Likewise, as the Omicron variant slows U.S. economic activity, the ‘bad news is good news’ camp has renewed hopes for a dovish Fed. However, the latest strain is unlikely to affect the Fed’s reaction function. A case in point: after ADP’s private payrolls declined by 301,000 in January (data released on Feb. 2), concern spread across Wall Street. However, after U.S. nonfarm payrolls (government data) came in at 467,000 versus 150,000 expected on Feb. 4, the U.S. labor market remains extremely healthy.
Please see below:
 Source: U.S. Bureau of Labor Statistics (BLS)
On top of that, the BLS revealed that “the over-the-month employment change for November and December 2021 combined is 709,000 higher than previously reported, while the over-the-month employment change for June and July 2021 combined is 807,000 lower. Overall, the 2021 over-the-year change is 217,000 higher than previously reported.”
Thus, the U.S. added more than 700,000 combined jobs in November and December than previously reported, and the net gain in 2021 was more than 200,000.
Please see below:
 Source: BLS
As for wage inflation, the BLS also revealed:
“In January, average hourly earnings for all employees on private nonfarm payrolls increased by 23 cents to $31.63. Over the past 12 months, average hourly earnings have increased by 5.7 percent.”
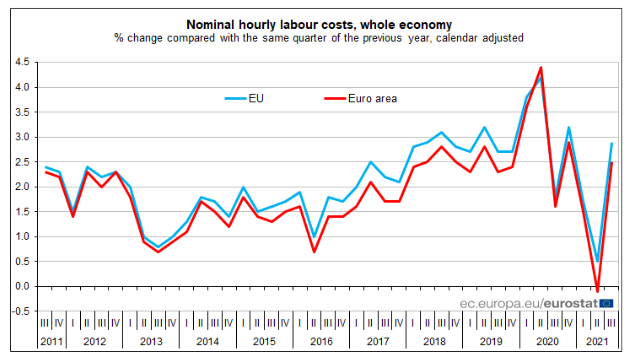
As a reminder, while investors speculate on the prospect of a hawkish ECB, the latest release out of Europe shows that wage inflation is much weaker than in the U.S. To explain, I wrote on Feb. 1:
Eurozone hourly labor costs rose by 2.5% YoY on Dec. 16 (the latest release). Moreover, the report revealed that “the costs of wages & salaries per hour worked increased by 2.3%, while the non-wage component rose by 3.0% in the third quarter of 2021, compared with the same quarter of the previous year.”
As a result, non-wage labor costs – like insurance, healthcare, unemployment premiums, etc. – did the bulk of the heavy lifting. In contrast, wage and salary inflation are nowhere near the ECB’s danger zone.
Please see below:
And why is wage inflation so critical? Well, ECB Chief Economist Philip Lane said on Jan. 25:
 Source: ECB
As a result, when the ECB’s Chief Economist tells you that wage inflation needs to hit 3% YoY to be “consistent” with the ECB’s 2% overall annual inflation target, a wage print of 2.3% YoY is far from troublesome. Thus, while euro bulls hope that the ECB will mirror the Fed and perform a hawkish 180, the data suggests otherwise.
In addition, while U.S. nonfarm payrolls materially outperformed on Feb. 4, I noted on Feb. 2 that there are now 4.606 million more job openings in the U.S. than citizens unemployed.
Please see below:
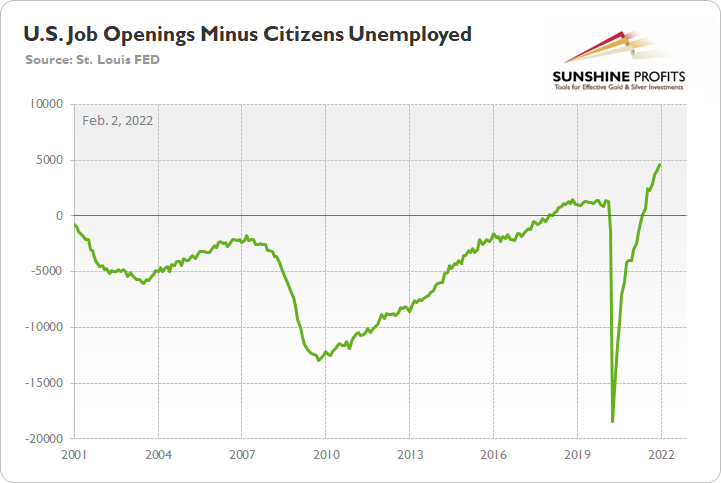
To explain, the green line above subtracts the number of unemployed U.S. citizens from the number of U.S. job openings. If you analyze the right side of the chart, you can see that the epic collapse has completely reversed and the green line is now at an all-time high. Thus, with more jobs available than people looking for work, the economic environment supports normalization by the Fed.
Thus, if we piece the puzzle together, the U.S. labor market remains healthy and U.S. inflation is materially outperforming the Eurozone. As a result, the Fed should stay ahead of the ECB, and the hawkish outperformance supports a weaker EUR/USD and a stronger USD Index. Moreover, the dynamic also supports a higher FCI and a higher U.S. 10-Year real yield. As we’ve seen since January 2021, these fundamental outcomes are extremely unkind to the PMs.
Finally, while the Omicron variant has depressed economic sentiment, I noted previously that the disruptions should be short-lived. For example, with Americans’ anxiety about COVID-19 decelerating, renewed economic strength should keep the pressure on the Fed.
Please see below:
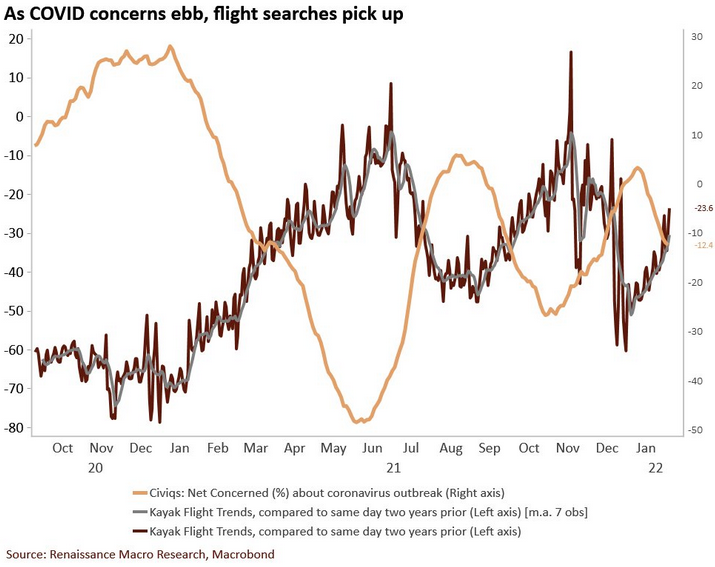
To explain, the light brown line above tracks the net percentage of Americans concerned about COVID-19, while the dark brown line above tracks the change in flight search trends on Kayak. In a nutshell: the more concern over COVID-19 (a high light brown line), the more Americans hunker down and avoid travel (a low dark brown line).
However, if you analyze the right side of the chart, you can see that the light brown line has rolled over and the dark brown line has materially risen. Moreover, with the trend poised to persist as the warmer weather arrives, increased mobility should uplift sentiment, support economic growth, and keep the Fed’s rate hike cycle on schedule.
The bottom line? The USD Index’s fundamentals remain extremely healthy, and while short-term sentiment has been unkind, rising real yields and a hawkish Fed should remain supportive over the medium term. Moreover, with the PMs often moving inversely to the U.S. dollar, more downside should confront gold, silver, and mining stocks over the next few months.
In conclusion, the PMs rallied on Feb. 4, despite the spike in U.S. Treasury yields. However, with so much volatility confronting the general stock market recently, sentiment has pulled the PMs in many directions. However, the important point is that the medium-term thesis remains intact: the USD Index and U.S. Treasury yields should seek higher ground, and the realization is profoundly bearish for the precious metals sector.
Thank you for reading our free analysis today. Please note that the above is just a small fraction of the full analyses that our subscribers enjoy on a regular basis. They include multiple premium details such as the interim target for gold that could be reached in the next few weeks. We invite you to subscribe now and read today’s issue right away.
Sincerely,
Przemyslaw Radomski, CFA
Founder, Editor-in-chief -
Gold Investment Update: The USDX Caught the Wave and Left Hungry Bears on the Shore
January 28, 2022, 10:17 AMDespite death wishes from the doubters, the dollar took to the skies on the Fed’s hawkish wings. Gold and silver can wave from the ground for now.
While Fed Chairman Jerome Powell threw fuel on the fire on Jan. 26, it’s no surprise that the USD Index has rallied to new highs. For example, while dollar bears feasted on false narratives in 2021, I was a lonely bull forecasting higher index values. Likewise, after more doubts emerged in 2022, the death of the dollar narrative resurfaced once again. However, with the charts signaling a bullish outcome for some time, my initial target of 94.5 was surpassed and my next target of 98 is near.
As such, it’s crucial to avoid speculation and wait for confirmation of breakdowns and breakouts. In its absence, the price action often pulls you in the wrong direction.
Remember the supposedly bearish move below 95 when the USD Index moved even below its rising support line? It’s been just 2 weeks since that development.
On Jan. 14, I wrote the following:
In conclusion, 2022 looks a lot like 2021: dollar bears are out in full force and the ‘death of the dollar’ narrative has resurfaced once again. However, with the greenback’s 2021 ascent catching many investors by surprise, another re-enactment will likely materialize in 2022. Moreover, since gold, silver, and mining stocks often move inversely to the U.S. dollar, their 2022 performances may surprise for all of the wrong reasons. As such, while the dollar’s despondence is bullish for the precious metals, a reversal of fortunes will likely occur over the medium term. Given yesterday’s reversal in the USD Index, it’s likely also from the short-term point of view – we could see the reversal and the return of the USD’s rally and PMs’ decline any day or hour now.
Fortunately, if you’ve been following my analyses, the recent price moves didn’t catch you by surprise. What’s next?
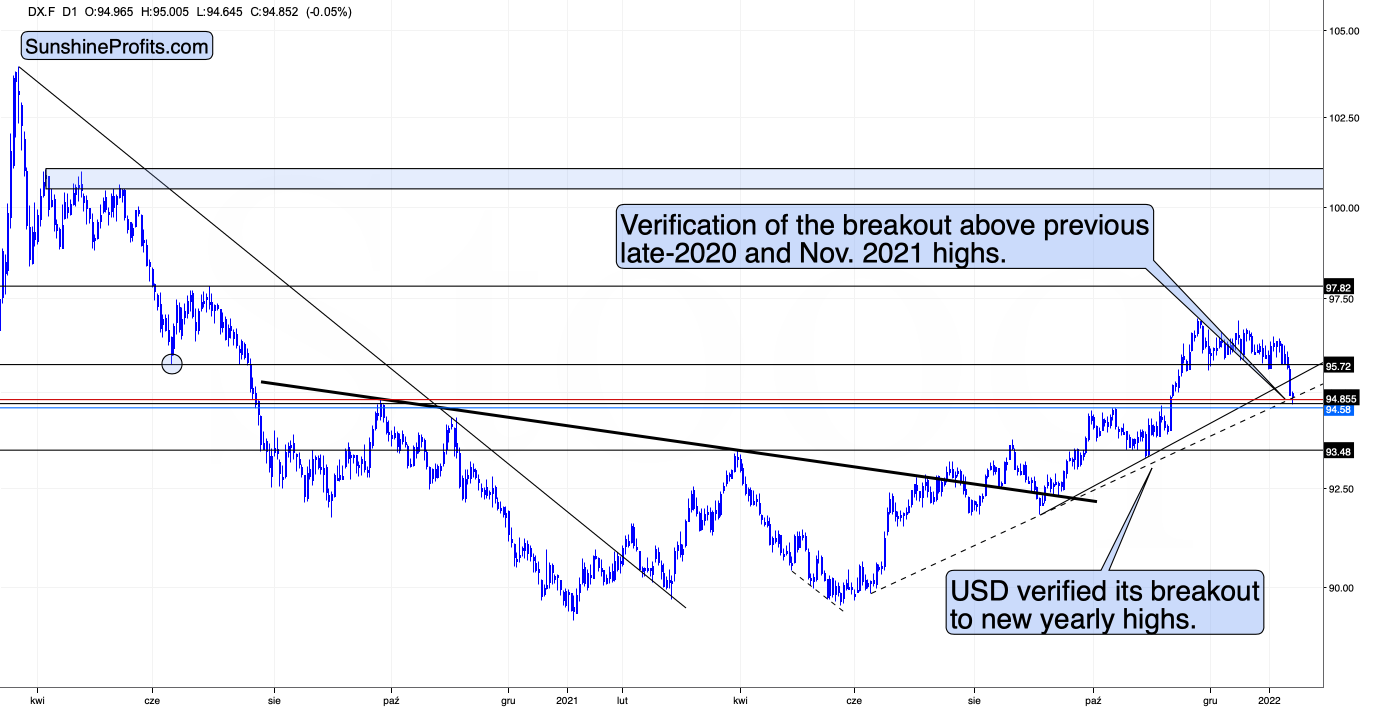
While the USD Index still needs to confirm the recent breakout and some consolidation may ensue, the bullish medium-term thesis remains intact.
More importantly, though, the USD Index’s gain has resulted in gold, silver, and mining stocks’ pain. For example, the dollar’s surge helped push gold below its short-and-medium-term rising support lines (the upward sloping red lines on the bottom half of the above chart).
However, since the USD Index hit a new high and gold didn’t hit a new low, is the development bullish for the yellow metal? To answer, I wrote on Jan. 27:
The U.S. currency just moved above its previous 2022 and 2021 highs, while gold is not at its 2021 lows.
Yet.
I wouldn’t view gold’s performance as true strength against the USD Index at this time just yet. Why? Because of the huge consolidation that gold has been trading in.
The strength that I want to see in gold is its ability not to fall or soar back up despite everything thrown against it, not because it’s stuck in a trading range.
In analogy, you’ve probably seen someone, who’s able to hold their ground, and not give up despite the world throwing every harm and obstacle at them. They show their character. They show their strength. Inaction could represent greater wisdom and/or love and focus on one’s goal that was associated with the lack of action. You probably know someone like that. You might be someone like that.
The above “inaction” is very different from “inaction” resulting from someone not knowing what to do, not having enough energy, or willpower.
Since markets are ultimately created by people (or algorithms that were… ultimately still created by people) is it any surprise that markets tend to work in the same way? One inaction doesn’t equal another inaction, and – as always – context matters.
However, wasn’t gold strong against the USD Index’s strength in 2021?
It was, but it was very weak compared to the ridiculous amounts of money that were printed in 2020 and 2021 and given the global pandemic. These are the circumstances, where gold “should be” soaring well above its 2011 highs, not invalidating the breakout above it. The latter, not the former, happened. Besides, the “strength” was present practically only in gold. Silver and miners remain well below their 2011 highs – they are not even close to them and didn’t move close to them at any point in 2020 or 2021.
The Eye in the Sky Doesn’t Lie
Moreover, if we zoom out and focus our attention on the USD Index’s weekly chart, the price action has unfolded exactly as I expected. For example, while overbought conditions resulted in a short-term breather, the USD Index consolidated for a few weeks. However, history shows that the greenback eventually catches its second wind. To explain, I previously wrote:
I marked additional situations on the chart below with orange rectangles – these were the recent cases when the RSI based on the USD Index moved from very low levels to or above 70. In all three previous cases, there was some corrective downswing after the initial part of the decline, but once it was over – and the RSI declined somewhat – the big rally returned and the USD Index moved to new highs.
Please see below:
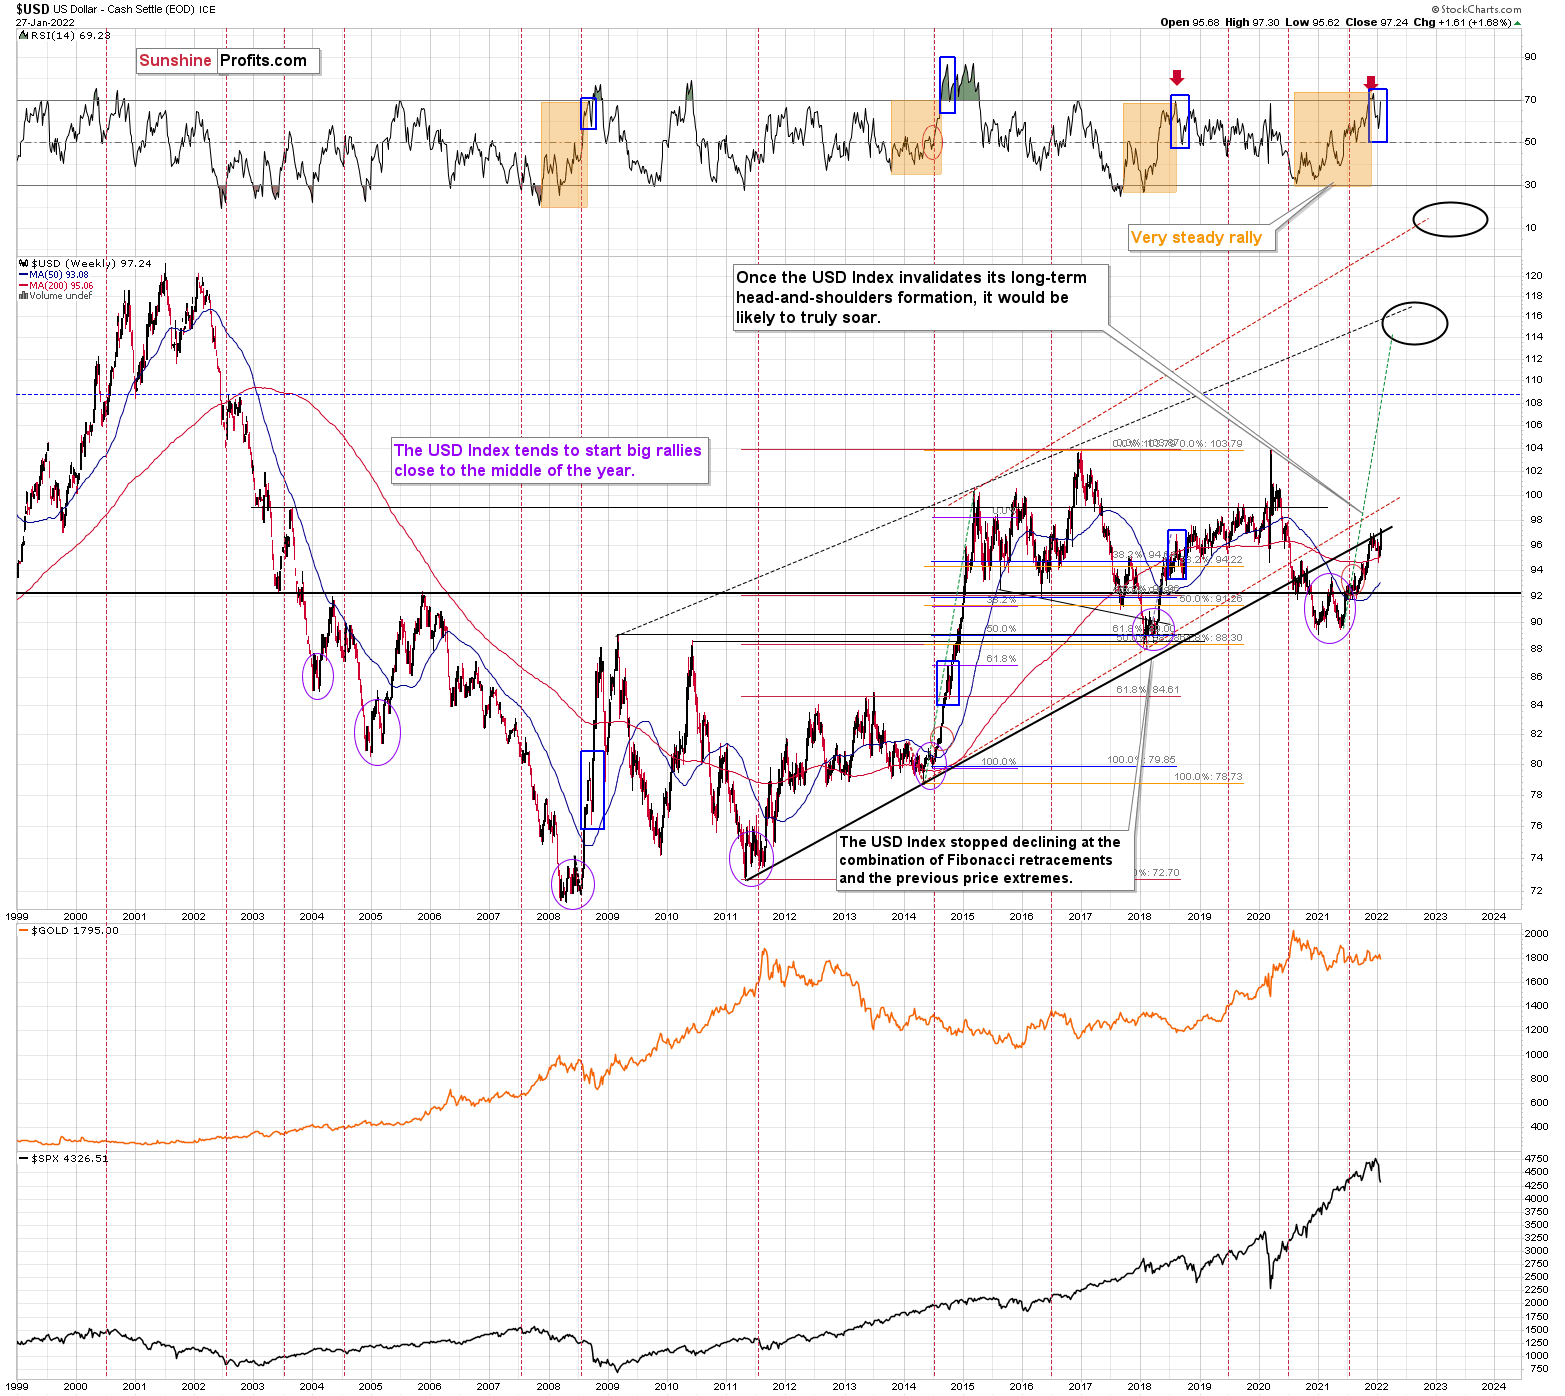
Just as the USD Index took a breather before its massive rally in 2014, it seems that we saw the same recently. This means that predicting higher gold prices (or those of silver) here is likely not a good idea.
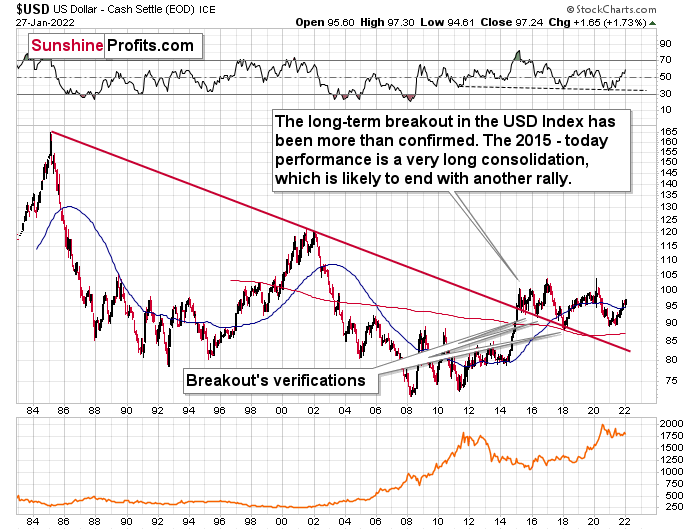
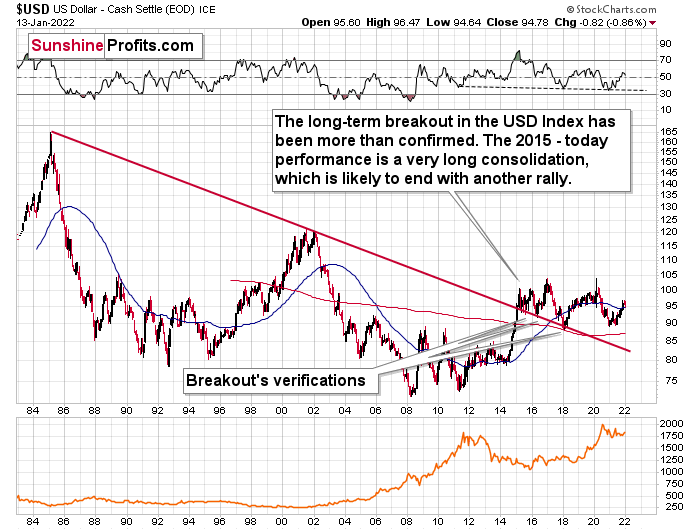
Continuing the theme, the eye in the sky doesn’t lie, and with the USDX’s long-term breakout clearly visible, the wind remains at the dollar’s back. Furthermore, dollar bears often miss the forest through the trees: with the USD Index’s long-term breakout gaining steam, the implications of the chart below are profound. While very few analysts cite the material impact (when was the last time you saw the USDX chart starting in 1985 anywhere else?), the USD Index has been sending bullish signals for years.
Please see below:
The bottom line?
With my initial 2021 target of 94.5 already hit, the ~98-101 target is likely to be reached over the medium term (and perhaps quite soon) Mind, though: we’re not bullish on the greenback because of the U.S.’s absolute outperformance. It’s because the region is fundamentally outperforming the Eurozone. The EUR/USD accounts for nearly 58% of the movement of the USD Index, and the relative performance is what really matters.
In conclusion, the USD Index’s ascent has surprised investors. However, if you’ve been following my analysis, you know that I’ve been expecting these moves for over a year. Moreover, with the rally poised to persist, gold, silver, and mining stocks may struggle before they reach lasting bottoms. However, with long-term buying opportunities likely to materialize later in 2022, the precious metals should soar to new heights in the coming years.
Thank you for reading our free analysis today. Please note that the above is just a small fraction of the full analyses that our subscribers enjoy on a regular basis. They include multiple premium details such as the interim target for gold that could be reached in the next few weeks. We invite you to subscribe now and read today’s issue right away.
Sincerely,
Przemyslaw Radomski, CFA
Founder, Editor-in-chief -
Gold Investment Update: Gold Is the Belle of the Ball. Will Its Dance Turn Bearish?
January 21, 2022, 10:26 AMThe precious metals still do pirouettes on the trading floor, but they can stumble in their choreography. The bears are just waiting for it.
With the GDX ETF soaring on significant volume on Jan. 19, the senior miners had a renewed pep in their step. With gold, silver, and mining stocks all dancing to the same beat, the precious metals garnered all of the bullish attention. However, with the trio known to cut their performances short as soon as investors arrive, will the mood music remain so sanguine?
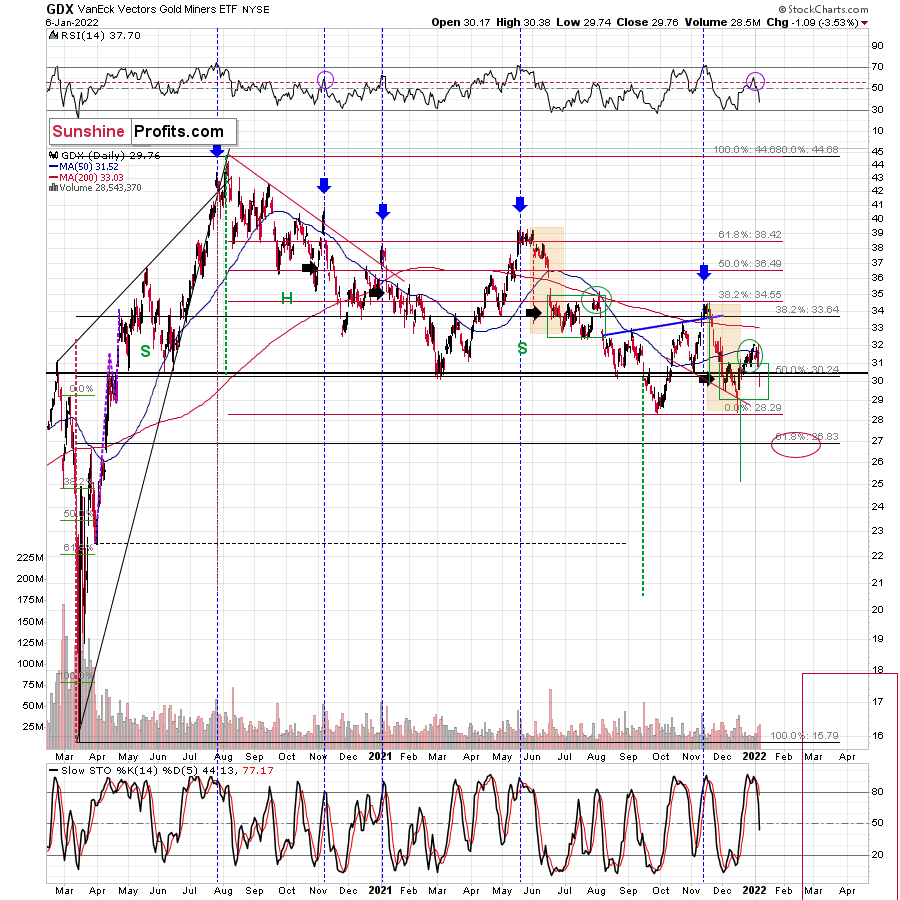
Well, for one, the GDX ETF has a history of peaking when the crowd enters the party. For example, I marked with the blue vertical dashed lines and blue arrows below how large daily spikes in volume often coincide with short-term peaks. Moreover, with another ominous event unfolding on Jan. 19, historical data implies that we’re much closer to the top than the bottom.
To explain, I wrote on Jan. 20:
From the technical point of view, we just saw another day similar to the other days that I marked with vertical dashed lines and black arrows. Those days were either right at the tops or not far from them. As much as yesterday’s (7%!) rally looks bullish, taking a look at the situation from a broad perspective provides us with the opposite – bearish – implications.
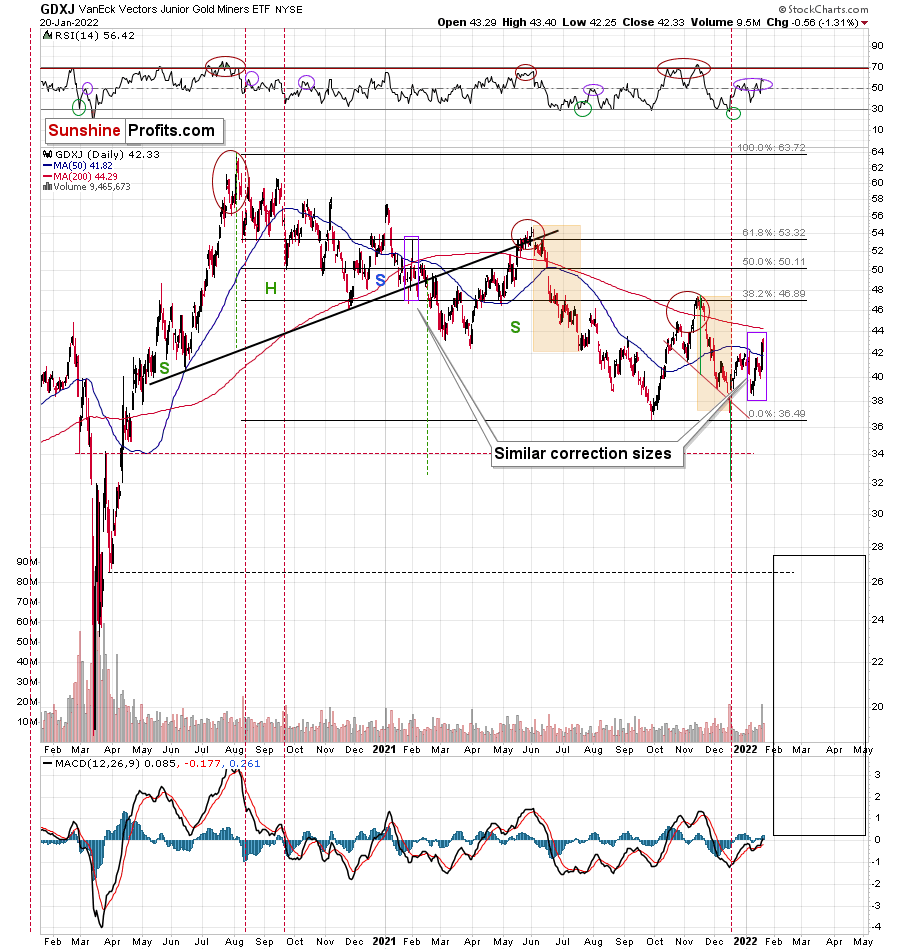
The zig-zag scenario is being realized as well. The GDX ETF moved to the upper border of the rising trend channel. Also, doesn’t it remind you of something? Hint: it happened at a similar time of the year.
Yes, the current price/volume action is similar to what we saw in early 2021. The RSI was above 60, a short-term rally that was preceded by a bigger decline, and a strong daily rally on huge volume at the end of the corrective rally. We’ve seen it all now, and we saw it in early 2021.
Please see below:
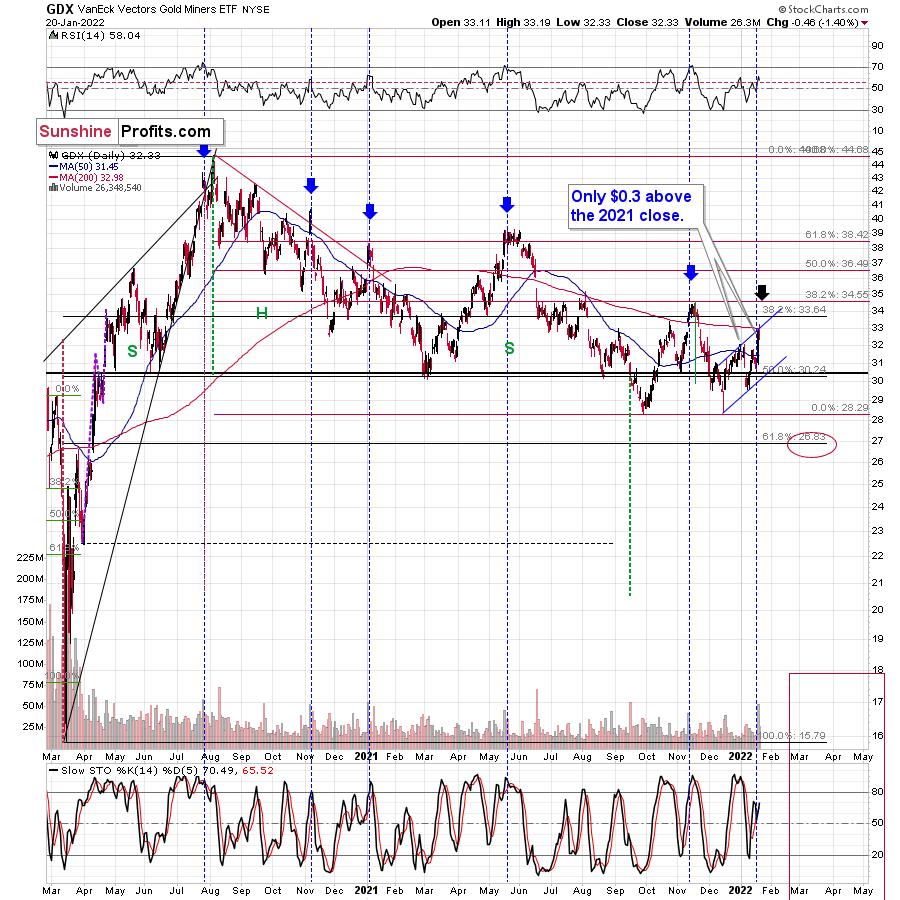
What’s more, the senior miners’ fatigue is already present. For example, the GDX ETF declined by 1.40% on Jan. 20, and the index ended the session only $0.30 above its 2021 close. Likewise, the senior miners failed to rally above the upper trendline of their ascending channel (drawn with the blue lines above). As a result, the price action resembles an ABC zigzag pattern, and while the short-term outlook is less certain, the medium-term outlook is profoundly bearish.
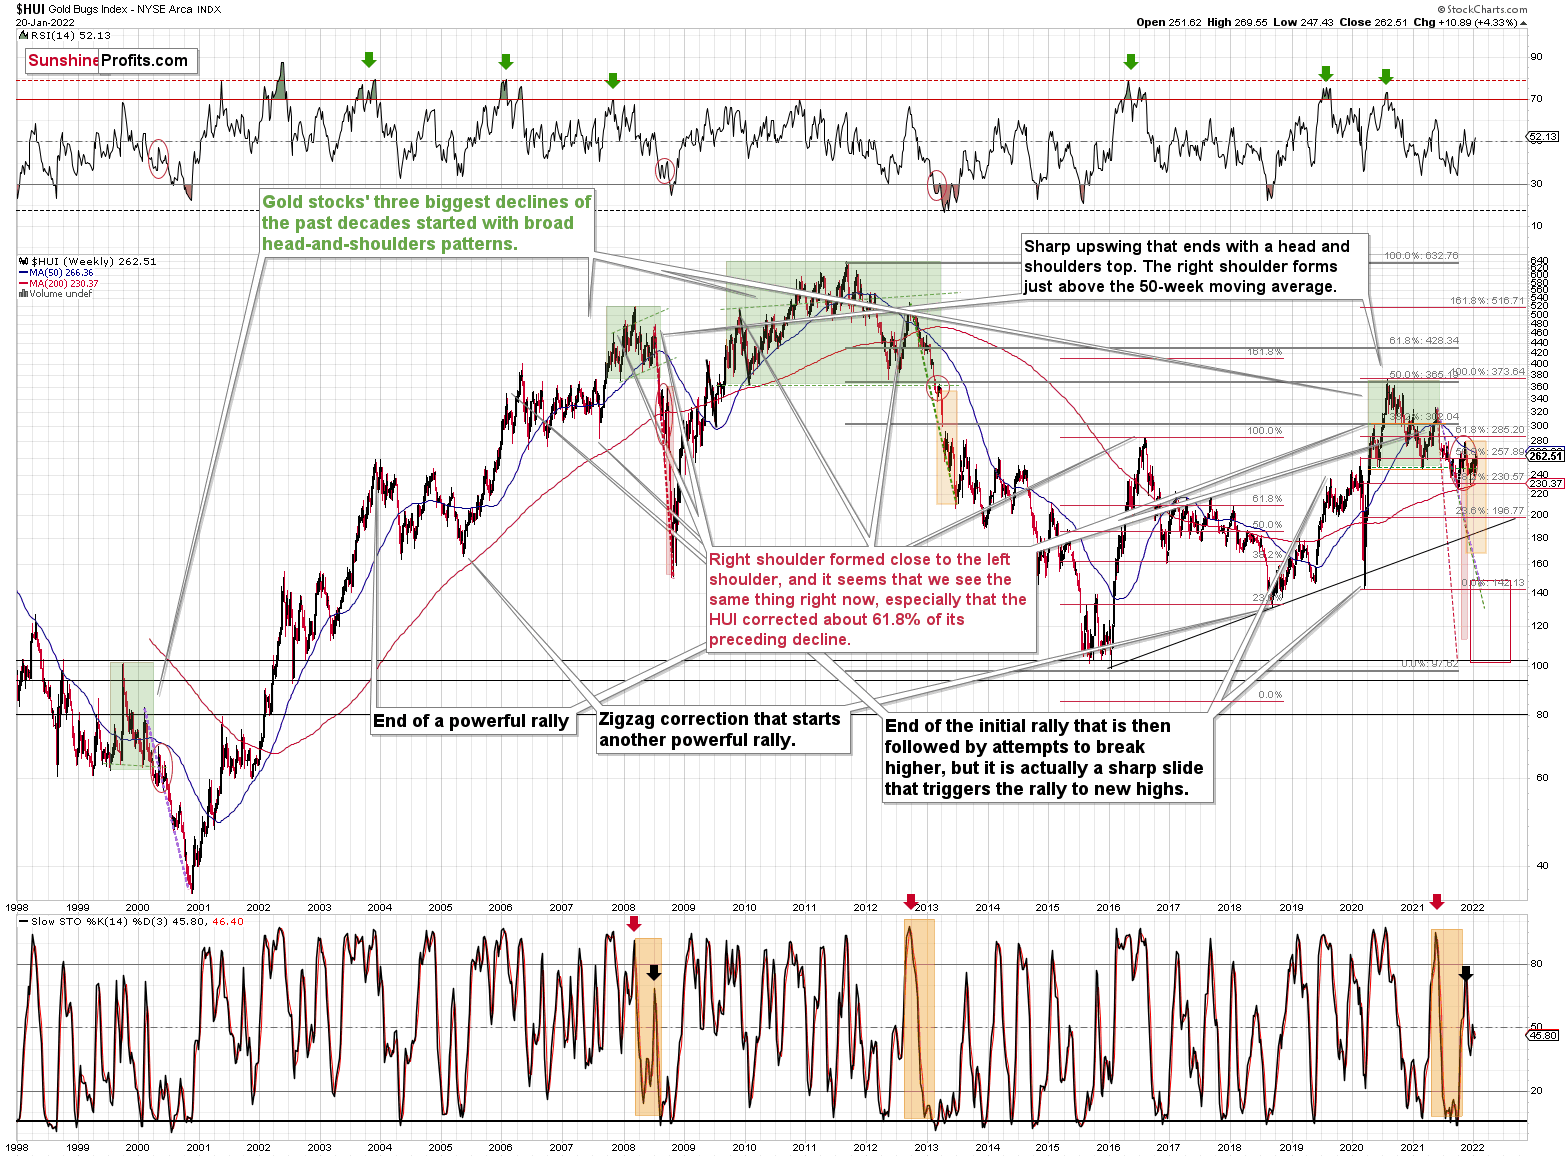
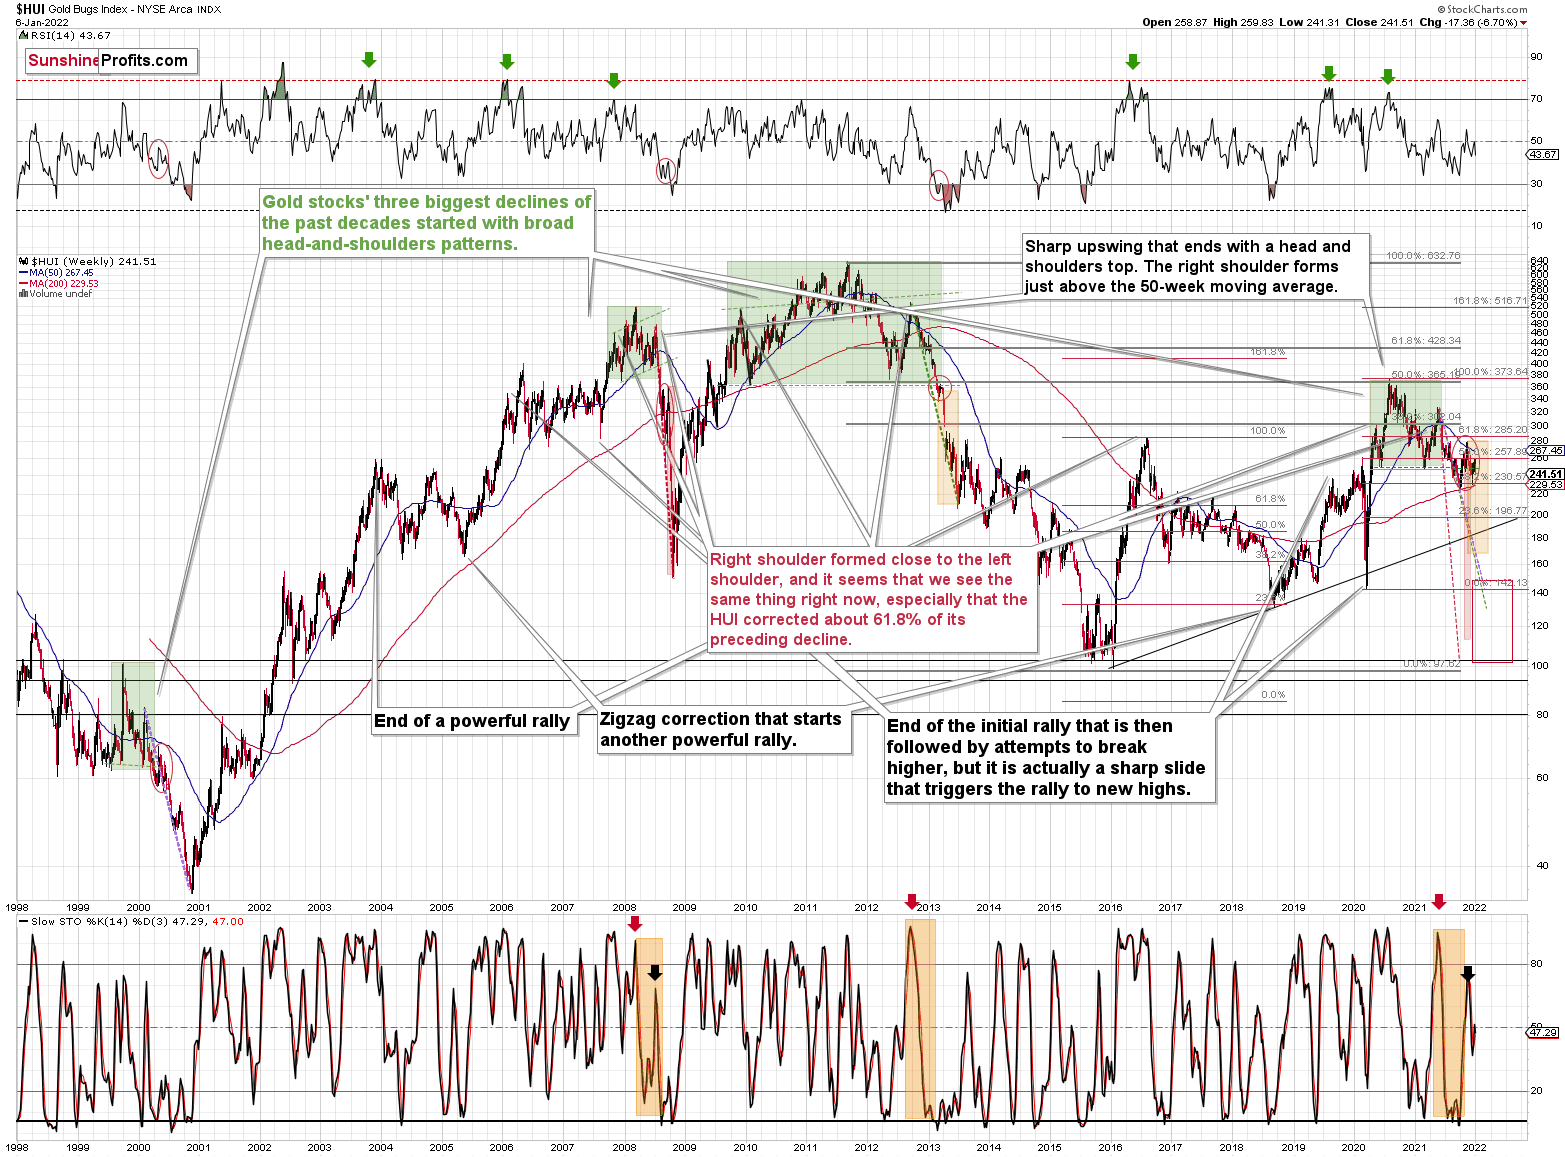
As further evidence, the HUI Index’s weekly chart provides some important clues. For example, despite the profound rally on Jan. 19, the index’s stochastic indicator still hasn’t recorded a buy signal. Moreover, the HUI Index dropped after reaching its 50-week moving average, and the ominous rejection mirrors 2013. Back then, the index approached its 50-week moving average, then suffered a pullback, and then suffered a monumental decline. As a result, is this time really different? Remember – history tends to rhyme, and this time the analogies from the past favor a bearish forecast for gold stocks.
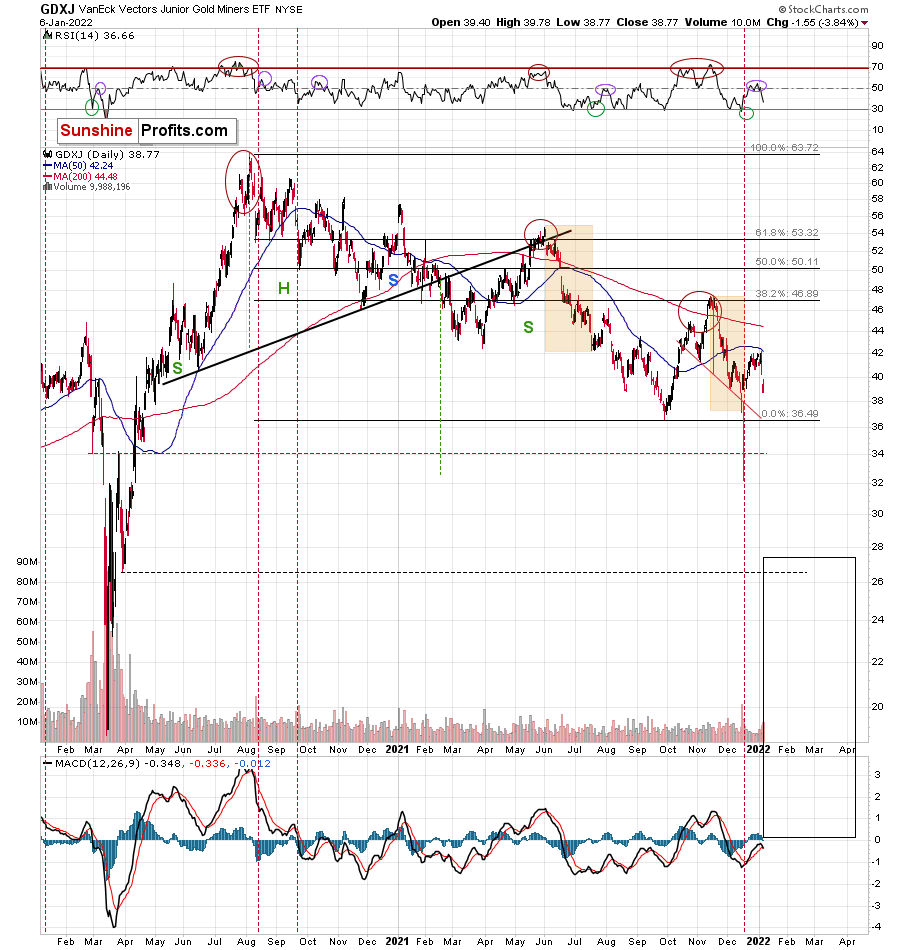
Turning to the GDXJ ETF, the junior miners were off to the races on Jan. 19. However, the size of the rally is actually smaller than what we witnessed in early 2021. Moreover, when the short-term sugar high ended back then, optimism turned to pessimism and the GDXJ ETF sank to new lows. Thus, with the junior miners’ 2021 story one of lower highs and lower lows, 2022 will likely result in more of the same.
Please see below:
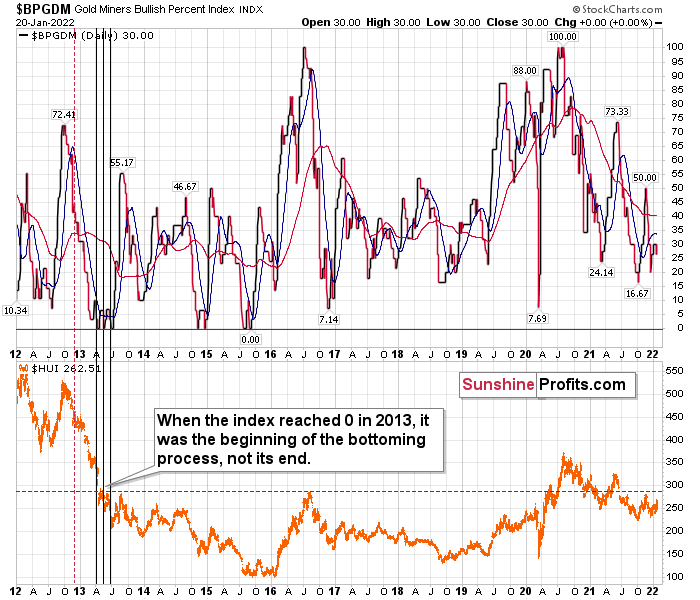
Finally, the Gold Miners Bullish Percent Index ($BPGDM) isn’t at levels that trigger a major reversal. The Index is now at 30. However, far from a medium-term bottom, the latest reading is still more than 20 points above the 2016 and 2020 lows.
Likewise, when the BPGDM hit 30 in 2013, the HUI Index was already in the midst of its medium-term downtrend (similar to what we witnessed in 2021). However, the milestone was far from the final low. With material weakness persisting and a lasting bottom not forming until the end of 2015/early 2016, further downside for gold (and silver) likely lies ahead.
For context, it’s my belief that the precious metals will bottom when the BPGDM hits zero – and perhaps when it remains there for some time.
In conclusion, gold, silver, and mining stocks put on quite a show on Jan. 19. However, with their bullish rhythm known to turn bearish in an instant, investors should proceed with caution. Moreover, the data shows that when investors rush to buy the precious metals, their over-enthusiasm results in medium-term weakness, not strength. As a result, the trio’s declines likely have more room to run before long-term buying opportunities emerge later in 2022.
Thank you for reading our free analysis today. Please note that the above is just a small fraction of the full analyses that our subscribers enjoy on a regular basis. They include multiple premium details such as the interim target for gold that could be reached in the next few weeks. We invite you to subscribe now and read today’s issue right away.
Sincerely,
Przemyslaw Radomski, CFA
Founder, Editor-in-chief -
Gold Investment Update: Dollar Bears Are Pushing Their Narrative. Will It Stick?
January 14, 2022, 10:12 AMWhile the USD has a slight cold and is sitting out this inning, the precious metals are enjoying some sun. But for how long before the tables turn?
While six Fed officials warned of forthcoming rate hikes and signaled that the March meeting could result in liftoff, the USD Index responded like they had announced another round of QE. What does it give?
Well, with the U.S. dollar stuck in consolidation mode after its recent sprint higher, gold, silver, and mining stocks have enjoyed the pullback. However, since the charts provide the most accurate clues regarding the future price action, the technicals signal that the USD Index’s weakness should be short-lived.
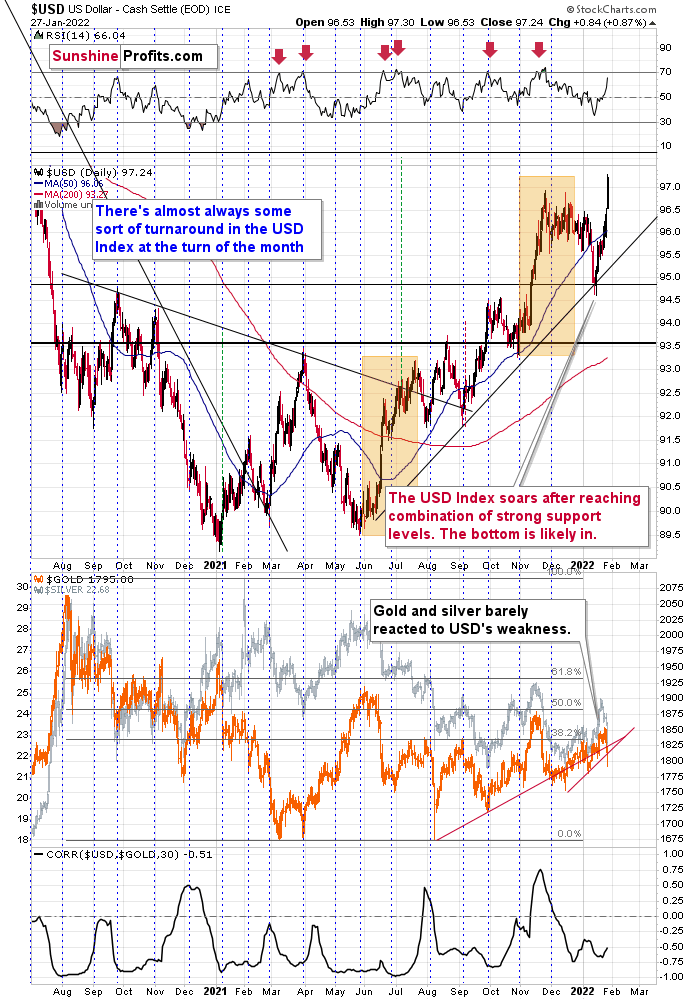
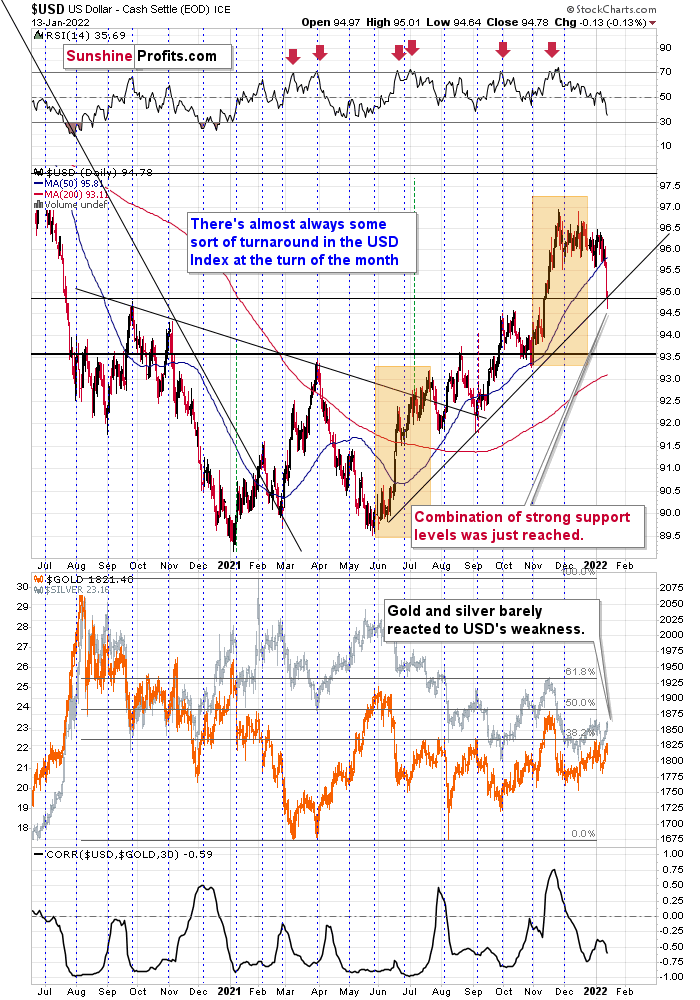
For example, while unfulfilled prophecies of the dollar’s demise in 2021 have been resurrected in 2022, the USD Index rallied off of expected support. After declining intraday on Jan. 13, the dollar basket reversed higher and ended the day with a bullish hammer candle. Moreover, the USD Index closed above its rising support line (the dashed line below) and its September 2020 high. As a result, the dollar found support near the levels that I outlined on Jan. 13. I wrote:
At the beginning of 2021, I wrote that the year was likely to be bullish for the USD Index, and my forecast for gold (and the rest of the precious metals sector) was bearish – against that of almost every one of my colleagues.
The USD Index ended 2021 about 6% higher, gold was down about 3.5%, silver was down almost 12%, the GDX ETF was down by about 9.5%, and the GDXJ ETF (proxy for junior mining stocks, my primary tool for shorting the precious metals sector in 2021 – I wasn’t shorting gold at any point in 2021) was down by about 21%.
What about this year? It’s a tough call to say how the entire year will go, but it seems to me that the USD Index will move higher, and we’ll see both in the PMs: a massive decline, and then a huge rally. It’s very likely to be a year to remember for anyone interested in trading gold, silver, and/or mining stocks and/or investing in them.
The USD Index declined to fresh 2022 lows – well below the previous January lows, and also below the December and late-November lows.
We see that the USD Index just (in overnight trading, so the move is not even close to being confirmed) moved a little below USDX’s rising support line based on the previous June and October 2021 lows. At the same time, the USDX is slightly below its late-2020 top and slightly above its November 2021 top.
In light of the situation on the long-term USDX chart, this combination of support levels is likely to trigger a rebound and the continuation of the medium-term rally.
Please see below:
The USD Index (USDX)
Moreover, if we zoom out and focus our attention on the USD Index’s weekly chart, an interesting pattern has developed. To explain, when the dollar basket’s weekly RSI (based on the weekly price changes) hit 70, I wrote the following:
Also, please note that the recent medium-term rally has been calmer than any major upswing witnessed over the last 20 years, where the USD Index’s RSI has hit 70. I marked the recent rally in the RSI with an orange rectangle, and I did the same with the second-least and third-least volatile of the medium-term upswings.
The sharp rallies in 2008 and 2014 were of much larger magnitudes. And in those historical analogies, the USD Index continued its surge for some time without suffering any material corrections.
As a result, the short-term outlook is more of a coin flip.
Consequently, the current decline is not unexpected – it’s rather normal.
I marked additional situations on the chart below with orange rectangles – these were the recent cases when the RSI based on the USD Index moved from very low levels to or above 70. In all three previous cases, there was some corrective downswing after the initial part of the decline, but once it was over – and the RSI declined somewhat – the big rally returned and the USD Index moved to new highs.
I marked those declines in the RSI with blue rectangles, and I did the same thing for the current decline. As you can see, the size of the move lower is currently analogous to previous short-term corrections that were then followed by higher prices. This means that it’s quite likely over or very close to being over, and the medium-term rally can return any day now.
Please see below:
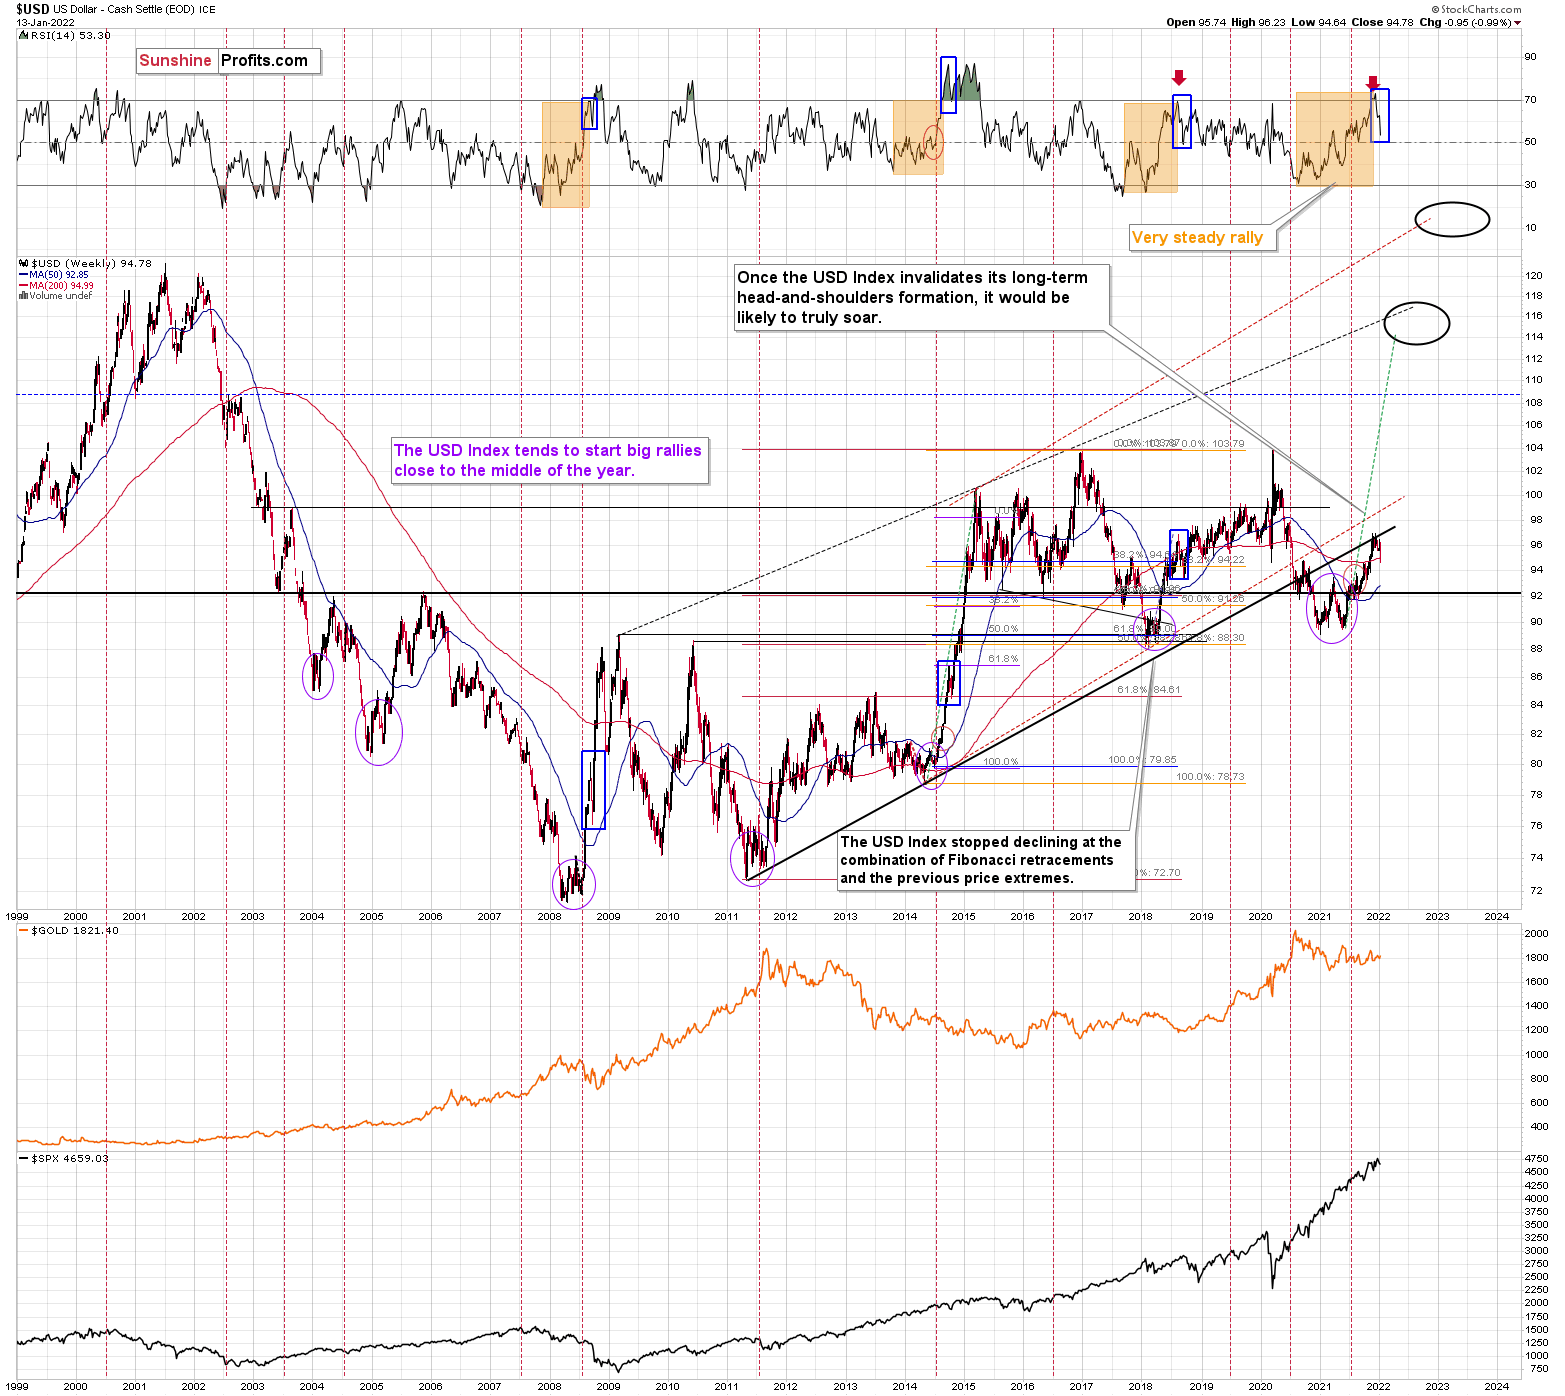
Just as the USD Index took a breather before its massive rally in 2014, it seems that we saw the same recently. This means that predicting higher gold prices (or the ones of silver) here is likely not a good idea.
Continuing the theme, the eye in the sky doesn’t lie. And with the USDX’s long-term breakout clearly visible, the wind remains at the dollar’s back. Furthermore, dollar bears often miss the forest through the trees: with the USD Index’s long-term breakout gaining steam, the implications of the chart below are profound. And while very few analysts cite the material impact (when was the last time you saw the USDX chart starting in 1985 anywhere else?), the USD Index has been sending bullish signals for years.
Please see below:
The bottom line?
With my initial 2021 target of 94.5 already hit, the ~98 - 101 target is likely to be reached over the medium term (and perhaps quite soon), mind, though: we’re not bullish on the greenback because of the U.S.’ absolute outperformance. It’s because the region is fundamentally outperforming the Eurozone, the EUR/USD accounts for nearly 58% of the movement of the USD Index, and the relative performance is what really matters.
In conclusion, 2022 looks a lot like 2021: dollar bears are out in full force and the ‘death of the dollar’ narrative has resurfaced once again. However, with the greenback’s 2021 ascent catching many investors by surprise, another re-enactment will likely materialize in 2022. Moreover, since gold, silver, and mining stocks often move inversely to the U.S. dollar, their 2022 performances may surprise for all of the wrong reasons. As such, while the dollar’s despondence is bullish for the precious metals, a reversal of fortunes will likely occur over the medium term. Given yesterday’s reversal in the USD Index, it’s likely also from the short-term point of view – we could see the reversal and the return of the USD’s rally and PMs’ decline any day or hour now.
Thank you for reading our free analysis today. Please note that the above is just a small fraction of the full analyses that our subscribers enjoy on a regular basis. They include multiple premium details such as the interim target for gold that could be reached in the next few weeks. We invite you to subscribe now and read today’s issue right away.
Sincerely,
Przemyslaw Radomski, CFA
Founder, Editor-in-chief -
Gold Investment Update: Miners Should Prepare a Pillow. Gold’s Hard Landing Can Hurt
January 7, 2022, 9:51 AMAs in sports, a weak market streak can reverse in the next season. However, the precious metals team looks like it’s about to drop out of the league.
While gold, silver, and mining stocks were in the holiday spirit during the final weeks of 2021, I warned on Jan. 4 that the GDXJ ETF’s sleigh was headed for an epic crash. I wrote:
The GDXJ ETF’s corrective upswing has likely run its course. Interestingly, the junior miners’ current rally mirrors the small correction that materialized in mid-2021 (early August). Back then, the GDXJ ETF rallied on low volume and didn’t recapture its 50-day moving average. With the same tepid strength present today, the drawdown that followed in mid-2021 will likely commence once again.
On top of that, the behavior of the GDXJ ETF’s RSI is also similar – with the indicator moving from roughly 30 to 50. For context, I highlighted the similarities with green and purple ellipses below. Also noteworthy, similar developments occurred in February/March 2020, before the profound plunge unfolded. As a result, the GDXJ ETF looks set for another sharp drawdown over the medium term.
After the junior mining stocks ETF proceeded to decline by more than 6% in two days, my short position rang in the New Year with solid gains. What’s more, with the GDXJ ETF likely to break below its 2021 lows over the medium term, winter woes should materialize before a long-term buying opportunity emerges.
Please see below:
Likewise, with the GDX ETF’s RSI (Relative Strength Index) signaling an ominous outcome for the senior miners, I warned that a sell-off was likely on the horizon. For context, I highlighted the historical similarities with the blue vertical dashed lines below.
Moreover, with the GDX ETF’s weakness accelerating on Jan. 5/6, the senior miners have declined sharply in recent days. In addition, the current price action mirrors the senior miners’ ominous performance in July/August 2021 – just like I’ve been describing it for a few weeks now. As a result, the previous corrective upswing is likely over, and the GDX ETF should confront lower lows sooner rather than later.
For context, a breakdown below the 2021 lows should materialize over the medium term, and the forecast for gold, as well as gold stocks, is bearish for the next several weeks / months. However, the milestone may not occur over the next few days.
Turning to the HUI Index’s long-term chart, the same bearish signals are present. For example, I marked the specific tops with red and black arrows. In the current situation, we saw yet another small move up, but that’s most likely because the price moves are now less volatile. The areas marked with red ellipses remain similar and show back-and-forth movement before the big decline.
As such, while we’ve entered a consolidation phase, this week’s selling pressure has been quite ferocious. Thus, the implications are not bullish but bearish.
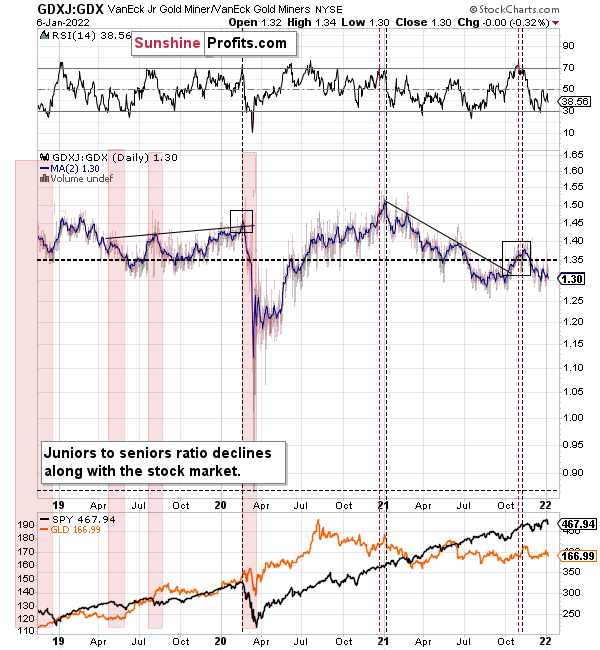
Finally, the GDX/GDXJ ratio continues to perform as expected. For example, I warned throughout 2021 that the ratio was destined for devaluation. ith the metric kicking off 2022 with another decline, the GDXJ ETF continues to underperform the GDX ETF.
For context, I believe that gold, silver, and the GDX ETF are all ripe for sharp re-ratings over the medium term. However, I think that the GDXJ ETF offers the best risk-reward ratio due to its propensity to materially underperform during bear markets. As a result, shorting junior miners offers a great risk to reward trade-off.
In conclusion, gold, silver, and mining stocks began 2022 with the same weakness that plagued them in 2021. While the worst performers one year often become the best performers the next, the charts signal more weakness ahead. As a result, while the precious metals are poised to soar over the long term, lower lows will likely materialize before their secular uptrends resume.
Thank you for reading our free analysis today. Please note that the above is just a small fraction of the full analyses that our subscribers enjoy on a regular basis. They include multiple premium details such as the interim target for gold that could be reached in the next few weeks. We invite you to subscribe now and read today’s issue right away.
Sincerely,
Przemyslaw Radomski, CFA
Founder, Editor-in-chief


Gold Alerts
More-
Status
New 2024 Lows in Miners, New Highs in The USD Index
January 17, 2024, 12:19 PM -
Status
Soaring USD is SO Unsurprising – And SO Full of Implications
January 16, 2024, 8:40 AM -
Status
Rare Opportunity in Rare Earth Minerals?
January 15, 2024, 2:06 PM
Dear Sunshine Profits,


