

Briefly: in our opinion, full (250% of the regular size of the position) speculative short position in gold, silver, and mining stocks are justified from the risk/reward point of view at the moment of publishing this Alert.
As the Fed turned dovish this year, not only did the short-term interest rates move down - the long- and very-long-term ones also declined. Why would this be the case? After all, the long-term rates are set by market forces, not through Fed's direct decision... More importantly, though, why should you, the precious metals investor, care? What kind of signal does it send to the gold market for the following months and years?
It's not that the Fed directly controls the long-term rates that is the issue here - it doesn't. The long-term interest rates are based on supply and demand, which are in turn based on market expectations. After all, markets are forward looking.
And what does the Fed provide in addition to interest rate decisions? Forward guidance. Year after year, the public debts have been increasing across the world's most advanced economies, and it's becoming increasingly obvious that this debt cannot be repaid using regular revenue of the official sector (taxes). The debt can be repudiated but that's an unthinkable proposition - take a look at how Greece's efforts turned out. Realistically, the debt will need to be inflated away... Or maybe it won't have to be. After all, the scenario where long-term interest rates go below zero, the debt is no longer ballooning due to interest. Either way, the interest rates are likely to be lower in the long run based on the above. This is the core of financial repression - artificially low rates. But that's just one of the reasons.
The direct comments from the Fed clearly support the above - the rates are getting lower and that's happening even without incoming data that would support a rate cut. All the talk about the Fed being data-driven didn't amount to much after Trump started openly criticizing Fed and demanding rates be cut. He delivered the "trade risk" which served as justification of a rate cut. That's not an official statistic the Fed was supposed to follow - it's smoke and mirrors that helps to keep rates in a long-term downtrend. Then, it's no wonder that forward-looking investors expect rates to be lower in the following years, not only months. What does it imply for gold? In the very long term it's very bullish, because when the risk-free rate goes to (or below) zero, an asset that doesn't yield any interest becomes much more desirable. In normal circumstances, it's better to have an interest-yielding asset than one without. But when the long-term interest rates go below zero and investors can't earn money through bonds, gold will be a much better alternative. Especially when it outshines inflation.
The key thing to keep in mind is that the above is a long-term fundamental factor. It doesn't tell us where the market will move either in the short term or in the medium term. It's practically a factor of zero importance for day trading.
The markets are forward looking, which means that they are already discounting the above taking place and they aim to frontrun the obvious consequences even before they occur. The markets discount more than news and fundamentals, though. They also discount investors and traders' emotions for people tend to get ahead of themselves in terms of expectations and reactions to news. Consequently, the market could get ahead of itself and then decline regardless of the fundamental situation being positive. Or it might be in a medium-term downtrend and forced to move against it based on series of unexpected events. How do we know what price movement is real and which one is fake? The truth is that one can never be 100% certain with regard to any price movement. However, there is a way to detect what is likely and what's not. That happens by comparing the current situation to similar cases in the past and how consistently the follow-up actions unfolded. That's more or less what technical analysis is all about. There are more sophisticated techniques, but the overall general rule is as simple as the above.
So, without further ado, let's take a look at what the very long-term (30-year) interest rates are currently doing and how similar cases impacted the gold market in the past.
Long-Term Interest Rates and Gold
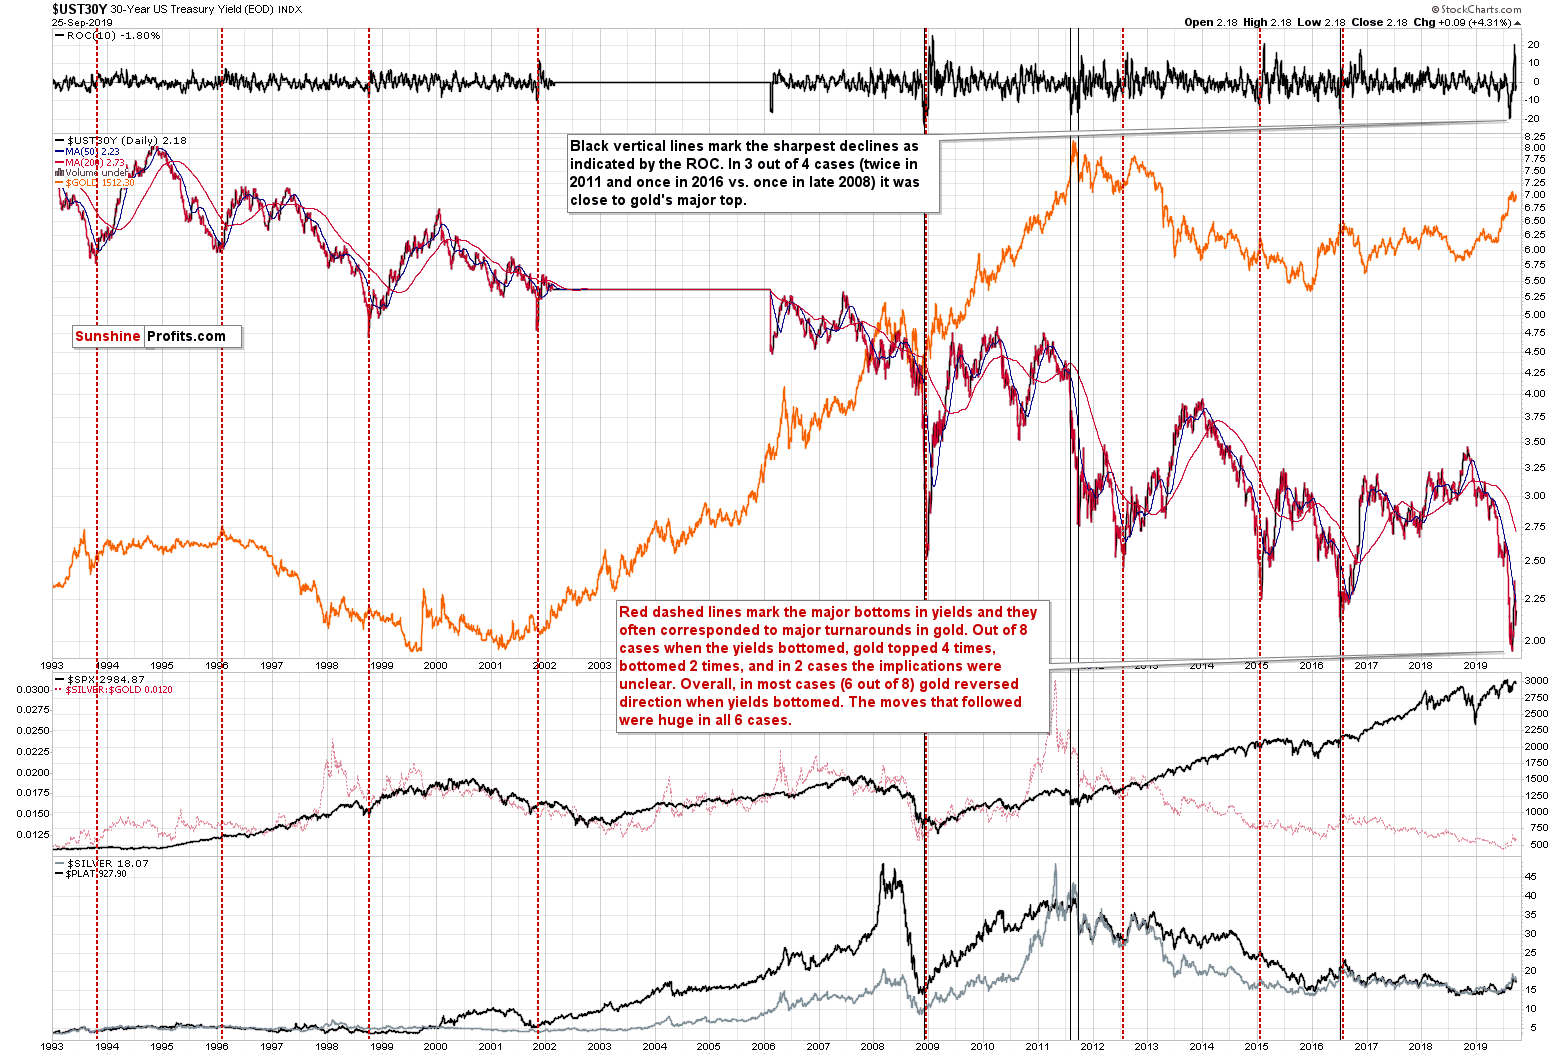
In short, we recently saw a huge drop in the long-term rates. It was neither the first one, nor the biggest one though. We saw similar developments several times in the previous years, and the 2008 drop was the most significant one.
Long-term rates are definitely in a long-term downtrend, but they are not declining in a straight line. There are big slides, just like the one that we saw recently, and there are upswings that take up to- or even over a year. The rates moved to new lows recently and then rallied back above the previous lows. This suggests that the short- or even medium-term bottom in the rates is in. Moreover, that's exactly what happened in 2015 and 2016, and gold topped at both lows in the rates. Of course, these are not the only cases when the rates bottomed, so let's check what happened in all previous cases since 1993.
Out of 8 cases when the 30-year Treasury yields bottomed, gold topped 4 times, it bottomed twice and in the 2 remaining cases, the implications were unclear. In other words, gold rallied in only 25% of cases (in 2001 and 2013), but in both cases the exact bottom in gold took place along with the bottom in the rates. This means that in both cases when the implications were bullish, gold declined beforehand. This was definitely not the case recently. Gold topped along with the bottom in the rates, which makes it similar to the 4 cases when the slide and bottom in the rates were actually great shorting opportunities for gold traders.
This means that while the overall trend lower in rates is positive for gold for the following years, the very recent slide in rates does not have bullish implications for the short or even medium term. Whatever bullish action was likely to happen based on it, is likely already behind us.
Please take a look at what happened with the long-term interest rates at the 1996 top. This is particularly important, because based on what's happening in the USD Index, the current situation is just like what we saw in the mid-90s. The long-term interest rates formed a short-term bottom, then they rallied for a few months, consolidated and then declined once again for more than a year. And you know what happened in gold? Gold declined for practically the entire time. It even declined after the rates bottomed in 1998. That's exactly what we might see in the following months.
The USD Index is likely to soar this and next year and while the rates might move lower in the long run, they are likely to bounce in the short term. And gold? It has likely topped just as it did in early 1996, and is now starting a major decline.
Yesterday's decline in the precious metals sector seems to confirm the above.
Precious Metals in the Short-Term
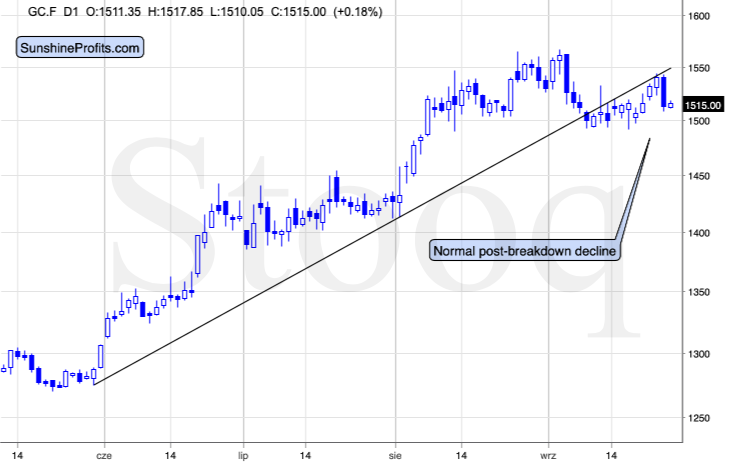
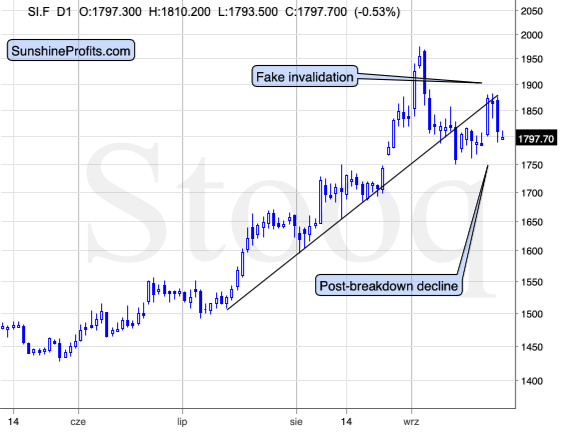
Both gold and silver verified the breakdowns below their rising support lines and declined shortly thereafter, just as they were supposed to.
Silver did move a bit above the line, which some traders may have viewed as breakdown's invalidation, but we warned you that silver's signals shouldn't be taken at face value if they are not confirmed by either gold or mining stocks. This was not the case, so the bearish outlook didn't change. And yesterday's slide confirms it. The outlook remains bearish and more declines are likely to follow.
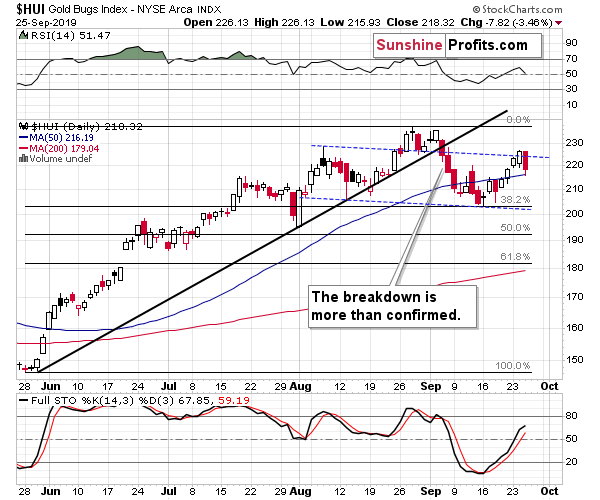
As far as the mining stocks are concerned, we wrote the following:
Miners moved only about halfway up to the previously broken support line. The line is currently above the August high and at about 250. The HUI Index is not even close to this level. Conversely, it's not above the September high. It's not above the August high. It's not even above the early-August high. Consequently, nothing really changed based on yesterday's upswing.
Now, why do we mention gold and gold miners' performance with the emphasis on their breakdowns' status? Because silver tends to provide false indications quite often and thus it's important to check with the rest of the precious metals market to see whether silver is confirming anything. The invalidation of the breakdown certainly lacks this confirmation.
The most useful sign from the silver market that we get on a short-term basis is its outperformance of gold. That's what usually takes place at or very close to the local top. And that's exactly what we saw yesterday. Consequently, should yesterday's upswing in silver be really viewed as bullish? No.
It's also important to keep the comments on the possible head-and-shoulders pattern in mind:
Please note that the current moves in gold and the HUI Index are relatively similar to what happened in the first half of August. Gold is moving back and forth at similar levels and so is the HUI Index. The miners' very short-term moves are bigger but the volume is lower this time, though. While the implications are not yet clear, the odds are that the current back and forth movement (a slight rally) is actually the right shoulder of the bearish head and shoulders formation. The volume should be relatively small during the right shoulder, and this has been the case recently. The implications are not clear yet, because the formation is not yet completed. Once gold confirms its breakdown below $1,490 and the HUI confirms its breakdown below (approximately) 200, the next big slide will follow. Given what is happening in the USD Index, the start of this slide is likely just around the corner.
What About the USD Index?
It just rallied strongly, in perfect tune with what we wrote about its triangle-vertex-based reversal (and if you haven't read Tuesday's analysis yet, we strongly encourage you to do so today for the long-term details):
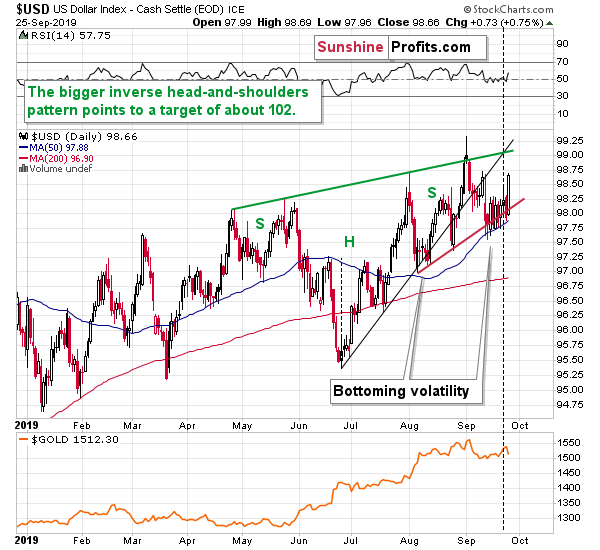
It was yet another higher low. The ultimate low this year formed in early January. Then, we saw a higher low in late January. Then a higher low in March, then a higher low in June, then a higher low in mid-July, then two higher lows in August and finally the higher low that we saw this week. Higher lows mean uptrend. Trendlines are useful to detect the turnarounds and Fibonacci retracements tell us if the move in the opposite direction is significant enough to be viewed as a trend change. However, the underlying rule is simple. If the price is on average moving up, then the market is an uptrend. Looking at the relative placement of lows and highs tells us the same thing. By the way, the highs in the USD Index have also been increasing this year.
While the rising black support line was already broken, it didn't cause the USDX to decline below the previous local low. It didn't decline below the red line that's based on the August lows either. And that's despite Trump calling for zero percent rate policy or even negative interest rate policy.
In the previous Alerts we wrote that the market will be viewing the U.S. President's tweets and comments as less and less important, given how often Trump changes his mind (remember how quickly North Korean "fire and fury" threats turned into a handshake?). The higher USDX lows confirm that. It didn't matter that Trump demanded radically lower interest rates. The currency traders didn't care much.
What did all the above result in? We have the USD Index above 98, close to the yearly highs. It mostly doesn't react to bearish news and it comes back stronger after each of such news is presented.
The outlook for the USD Index remains bullish.
There's one more detail about the USD Index chart that we would like to discuss. It's the vertex of the triangle that's based on the rising green resistance line and the rising black resistance line. (...) The vertexes of triangles tend to mark reversal dates, which means that the USD Index is likely to reverse its course on Monday or around it (perhaps even today).
Now, if the general trend is up, then the above is likely to mean a bottom in the USDX and then a rally. However, in order for the bottom to form, the price would have to come down. This means that the U.S. dollar could temporarily decline here, even despite all the bullish indications that we have right now.
This in turn means that gold, silver, and mining stocks could still move a bit higher before plunging. The emphasis goes on "could" and "a bit". In the last few weeks, gold and silver managed to decline on their own - so even if the USD declines, it's not a sure thing that the PMs will rally. And even if they do, they are unlikely to rally far. Still, it seems useful to know that such a possibility exists - so that a temporary upswing doesn't make one question all the bearish factors that remain in place. Speaking of the bearish factors, here they are. The links below include the analyses with discussions of these main points.
The USD Index moved lower on Friday and then reversed before the end of the session. Given the proximity of the triangle vertex reversal, it could be the case that this was the final bottom before the next upswing. Alternatively, it could be the case that the USDX bottoms today or tomorrow. Either way, the start of the next rally is most likely very close.
The USD Index seems to have bottomed right after the triangle-vertex-based turnaround. The implications are bullish for the USDX and bearish for the precious metals market.
Key Factors to Keep in Mind
Critical factors:
- The USD Index broke above the very long-term resistance line and verified the breakout above it. Its huge upswing is already underway.
- The USD's long-term upswing is an extremely important and bearish factor for gold. There were only two similar cases in the past few decades, when USD Index was starting profound, long-term bull markets, and they were both accompanied by huge declines in gold and the rest of the precious metals market
- Out of these two similar cases, only one is very similar - the case when gold topped in February 1996. The similarity extends beyond gold's about a yearly delay in reaction to the USD's rally. Also the shape of gold price moves prior to the 1996 high and what we saw in the last couple of years is very similar, which confirm the analysis of the gold-USD link and the above-mentioned implications of USD Index's long-term breakout.
- The similarity between now and 1996 extends to silver and mining stocks - in other words, it goes beyond USD, gold-USD link, and gold itself. The white metal and its miners appear to be in a similar position as well, and the implications are particularly bearish for the miners. After their 1996 top, they erased more than 2/3rds of their prices.
- Many investors got excited by the gold-is-soaring theme in the last few months, but looking beyond the short-term moves, reveals that most of the precious metals sector didn't show substantial strength that would be really visible from the long-term perspective. Gold doesn't appear to be starting a new bull market here, but rather to be an exception from the rule.
- Gold's True Seasonality around the US Labor Day points to a big decline shortly.
Very important, but not as critical factors:
- Long-term technical signs for silver, i.a. the analogy in terms of price to what we saw in 2008, shows that silver could slide even below $10.
- Silver's very long-term cycles point to a major reversal taking place right now and since the most recent move was up, the implications are bearish (this is also silver's technical sign, but it's so important that it deserves its own point)
- Long-term technical signs for gold stocks point to this not being a new gold bull market beginning. Among others, it's their long-term underperformance relative to gold that hint this is rather a corrective upswing within a bear market that is not over yet.
- Record-breaking weekly volume in gold is a strong sign pointing to lower gold prices
Important factors:
- Extreme volume reading in the SIL ETF (proxy for silver stocks) is an effective indication that lower values of silver miners are to be expected
- Silver's short-term outperformance of gold, and gold stocks' short-term underperformance of gold both confirm that the precious metals sector is topping here
- Gold topped almost right at its cyclical turning point, which makes the trend reversal more likely
- Copper broke below its head-and-shoulders pattern and confirmed the breakdown. The last time we saw something similar was in April 2013, when the entire precious metals sector was on the verge of plunging lower.
Moreover, please note that while there may be a recession threat, it doesn't mean that gold has to rally immediately. Both: recession and gold's multi-year rally could be many months away - comparing what happened to bond yields in the 90s confirms that.
Copper moved above the neck level of its head-and-shoulders pattern that's based on the intraday lows, but it didn't invalidate the analogous level based on the weekly closing prices, so we don't think it's justified to say that this bearish formation was invalidated at this time.
Summary
Summing up, the big decline in the precious metals sector appears to be finally underway, and the temporary USD-reversal-caused rally in gold and silver is likely over. Let's keep in mind that once the USDX takes off, it will likely serve as fuel to the fire-like decline in the PMs that's already underway. The similarity to mid-90s continues to support much lower gold prices in the following months. All in all, it seems that what we see right now is the beginning of the final stage of the prolonged decline in the precious metals sector that started in 2011. On a short-term basis, it seems that we might get some temporary strength once gold moves to about $1,330 - perhaps within the next several weeks.
As always, we'll keep you - our subscribers - informed.
To summarize:
Trading capital (supplementary part of the portfolio; our opinion): Full speculative short position (250% of the full position) in gold, silver, and mining stocks is justified from the risk/reward perspective with the following stop-loss orders and exit profit-take price levels:
- Gold: profit-take exit price: $1,332; stop-loss: $1,583; initial target price for the DGLD ETN: $39.87; stop-loss for the DGLD ETN: $25.17
- Silver: profit-take exit price: $14,62; stop-loss: $20,16; initial target price for the DSLV ETN: $32.96; stop-loss for the DSLV ETN: $11.67
- Mining stocks (price levels for the GDX ETF): profit-take exit price: $22.62; stop-loss: $32.37; initial target price for the DUST ETF: $17.28; stop-loss for the DUST ETF $5.48
In case one wants to bet on junior mining stocks' prices (we do not suggest doing so - we think senior mining stocks are more predictable in the case of short-term trades - if one wants to do it anyway, we provide the details), here are the stop-loss details and target prices:
- GDXJ ETF: profit-take exit price: $30.32; stop-loss: $45.42
- JDST ETF: profit-take exit price: $38.36 stop-loss: $11.26
Long-term capital (core part of the portfolio; our opinion): No positions (in other words: cash)
Insurance capital (core part of the portfolio; our opinion): Full position
Whether you already subscribed or not, we encourage you to find out how to make the most of our alerts and read our replies to the most common alert-and-gold-trading-related-questions.
Please note that the in the trading section we describe the situation for the day that the alert is posted. In other words, it we are writing about a speculative position, it means that it is up-to-date on the day it was posted. We are also featuring the initial target prices, so that you can decide whether keeping a position on a given day is something that is in tune with your approach (some moves are too small for medium-term traders and some might appear too big for day-traders).
Plus, you might want to read why our stop-loss orders are usually relatively far from the current price.
Please note that a full position doesn't mean using all of the capital for a given trade. You will find details on our thoughts on gold portfolio structuring in the Key Insights section on our website.
As a reminder - "initial target price" means exactly that - an "initial" one, it's not a price level at which we suggest closing positions. If this becomes the case (like it did in the previous trade) we will refer to these levels as levels of exit orders (exactly as we've done previously). Stop-loss levels, however, are naturally not "initial", but something that, in our opinion, might be entered as an order.
Since it is impossible to synchronize target prices and stop-loss levels for all the ETFs and ETNs with the main markets that we provide these levels for (gold, silver and mining stocks - the GDX ETF), the stop-loss levels and target prices for other ETNs and ETF (among other: UGLD, DGLD, USLV, DSLV, NUGT, DUST, JNUG, JDST) are provided as supplementary, and not as "final". This means that if a stop-loss or a target level is reached for any of the "additional instruments" (DGLD for instance), but not for the "main instrument" (gold in this case), we will view positions in both gold and DGLD as still open and the stop-loss for DGLD would have to be moved lower. On the other hand, if gold moves to a stop-loss level but DGLD doesn't, then we will view both positions (in gold and DGLD) as closed. In other words, since it's not possible to be 100% certain that each related instrument moves to a given level when the underlying instrument does, we can't provide levels that would be binding. The levels that we do provide are our best estimate of the levels that will correspond to the levels in the underlying assets, but it will be the underlying assets that one will need to focus on regarding the signs pointing to closing a given position or keeping it open. We might adjust the levels in the "additional instruments" without adjusting the levels in the "main instruments", which will simply mean that we have improved our estimation of these levels, not that we changed our outlook on the markets. We are already working on a tool that would update these levels on a daily basis for the most popular ETFs, ETNs and individual mining stocks.
Our preferred ways to invest in and to trade gold along with the reasoning can be found in the how to buy gold section. Additionally, our preferred ETFs and ETNs can be found in our Gold & Silver ETF Ranking.
As a reminder, Gold & Silver Trading Alerts are posted before or on each trading day (we usually post them before the opening bell, but we don't promise doing that each day). If there's anything urgent, we will send you an additional small alert before posting the main one.
=====
Latest Free Trading Alerts:
This week, Nancy Pelosi announced that the House would launch a formal impeachment inquiry. Is it a well-grounded argument, publicity stunt or reflection of the growing polarization inside the Democratic party? Storm in a tea cup or not, should Trump be worried? And gold?
Will Gold Benefit from Trump Impeachment Proceedings?
=====
Thank you.
Sincerely,
Przemyslaw Radomski, CFA
Editor-in-chief, Gold & Silver Fund Manager

