

Briefly: in our opinion, full (250% of the regular size of the position) speculative short position in gold, silver, and mining stocks are justified from the risk/reward point of view at the moment of publishing this Alert.
Friday's session brought us an informative sign for the precious metals. This development took place in the USD, as the world reserve currency initially declined only to reverse and close higher. Interestingly, the precious metals sector didn't react with a decline. Gold, silver and miners all closed higher, so this question naturally follows - what can we make of their upswing? Let's explore how the short- and long-term are affected exactly.
Let's start with the update on the short-term moves. The timely question is just how much did the latest upswing change.
Gold, Silver and Miners on Friday
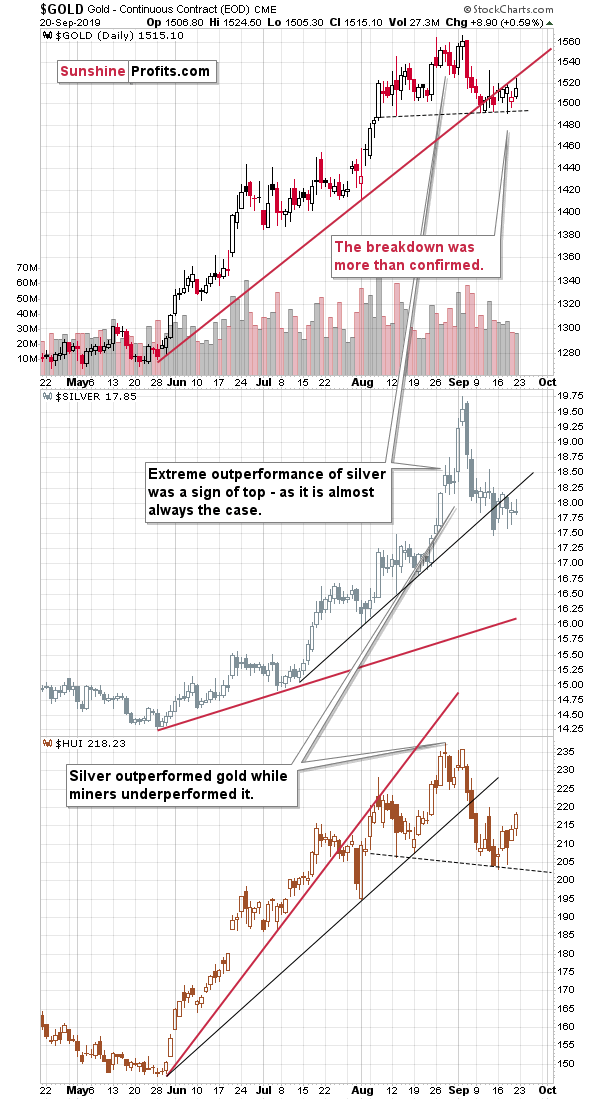
The timely reply is that even though gold moved visibly higher on Friday, it didn't really change anything. Since the support line that gold broke previously is a rising line, it is now higher than it was during the breakdown. Friday's upswing didn't take gold above the line, which means that the breakdown wasn't invalidated. This in turn means that nothing really changed from the short-term point of view in gold.
The same was the case with regard to silver. The white metal moved up just a little on Friday and it definitely didn't invalidate the previous breakdown on that day. Silver moved visibly higher in today's pre-market trading, but it didn't rally above the rising support line - only moved back to it. This means that both:
- The breakdown is being verified.
- The white metal is outperforming gold on a very short-term basis.
Both are bearish, not bullish, factors.
The gold stocks (HUI Index) closed relatively high, but still very far from their previously broken uptrend.
Please note that the current moves in gold and the HUI Index are relatively similar to what happened in the first half of August. Gold is moving back and forth at similar levels and so is the HUI Index. The miners' very short-term moves are bigger but the volume is lower this time, though. While the implications are not yet clear, the odds are that the current back and forth movement (a slight rally) is actually the right shoulder of the bearish head and shoulders formation. The volume should be relatively small during the right shoulder, and this has been the case recently. The implications are not clear yet, because the formation is not yet completed. Once gold confirms its breakdown below $1,490 and the HUI confirms its breakdown below (approximately) 200, the next big slide will follow. Given what is happening in the USD Index, the start of this slide is likely just around the corner.
The USD Index Reversal
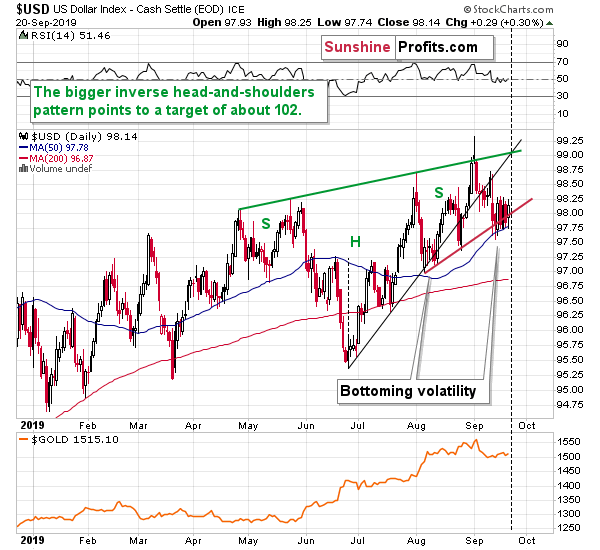
What our Friday's comments as well as the ones from Tuesday remain up-to-date (and if you haven't read Tuesday's analysis yet, we strongly encourage you to do so today for the long-term details):
It was yet another higher low. The ultimate low this year formed in early January. Then, we saw a higher low in late January. Then a higher low in March, then a higher low in June, then a higher low in mid-July, then two higher lows in August and finally the higher low that we saw this week. Higher lows mean uptrend. Trendlines are useful to detect the turnarounds and Fibonacci retracements tell us if the move in the opposite direction is significant enough to be viewed as a trend change. However, the underlying rule is simple. If the price is on average moving up, then the market is an uptrend. Looking at the relative placement of lows and highs tells us the same thing. By the way, the highs in the USD Index have also been increasing this year.
While the rising black support line was already broken, it didn't cause the USDX to decline below the previous local low. It didn't decline below the red line that's based on the August lows either. And that's despite Trump calling for zero percent rate policy or even negative interest rate policy.
In the previous Alerts we wrote that the market will be viewing the U.S. President's tweets and comments as less and less important, given how often Trump changes his mind (remember how quickly North Korean "fire and fury" threats turned into a handshake?). The higher USDX lows confirm that. It didn't matter that Trump demanded radically lower interest rates. The currency traders didn't care much.
What did all the above result in? We have the USD Index above 98, close to the yearly highs. It mostly doesn't react to bearish news and it comes back stronger after each of such news is presented.
The outlook for the USD Index remains bullish.
There's one more detail about the USD Index chart that we would like to discuss. It's the vertex of the triangle that's based on the rising green resistance line and the rising black resistance line. The vertex is on Monday. That's notable, because each line is based on three price extremes, which means that they both already proved to be important support / resistance lines. The vertexes of triangles tend to mark reversal dates, which means that the USD Index is likely to reverse its course on Monday or around it (perhaps even today).
Now, if the general trend is up, then the above is likely to mean a bottom in the USDX and then a rally. However, in order for the bottom to form, the price would have to come down. This means that the U.S. dollar could temporarily decline here, even despite all the bullish indications that we have right now.
This in turn means that gold, silver, and mining stocks could still move a bit higher before plunging. The emphasis goes on "could" and "a bit". In the last few weeks, gold and silver managed to decline on their own - so even if the USD declines, it's not a sure thing that the PMs will rally. And even if they do, they are unlikely to rally far. Still, it seems useful to know that such a possibility exists - so that a temporary upswing doesn't make one question all the bearish factors that remain in place. Speaking of the bearish factors, here they are. The links below include the analyses with discussions of these main points.
The USD Index moved lower on Friday and then reversed before the end of the session. Given the proximity of the triangle vertex reversal, it could be the case that this was the final bottom before the next upswing. Alternatively, it could be the case that the USDX bottoms today or tomorrow. Either way, the start of the next rally is most likely very close.
What about the long-term point of view? Let's check the current status.
The Long-Term Perspective in Precious Metals
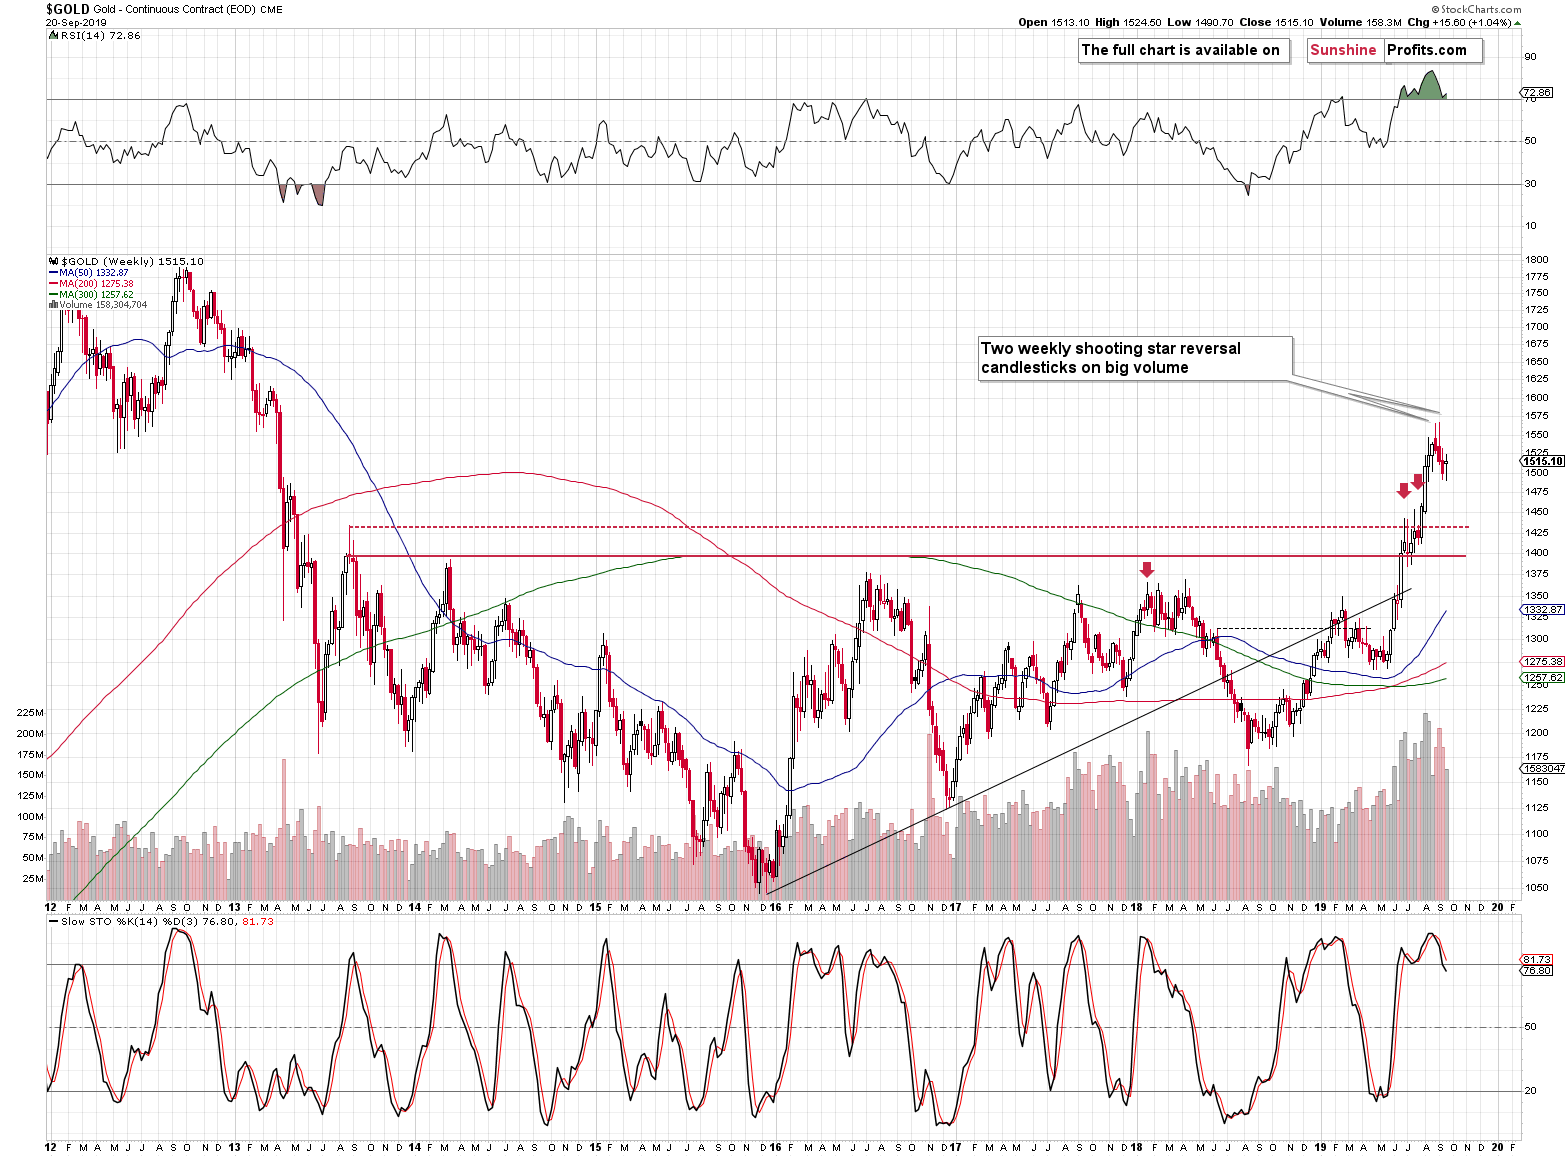
Gold moved higher last week, but it didn't entirely erase previous week's decline. The volume was relatively low. The last time that we saw relatively low volume during a weekly upswing was in mid-August, and that week's closing price was the top - most likely ending gold's 2019 rally (in terms of the weekly closes, that is). Just because gold formed the major top, it doesn't mean that it will now decline in a straight line. Conversely, please note that even the 2012-2013 decline had periodical 1-3-week-long corrections.
The RSI above 70 confirms gold's very overbought status and the need to decline in the following weeks. The sell signal from the Stochastic indicator remains intact as well, pointing to lower gold prices in the following weeks.
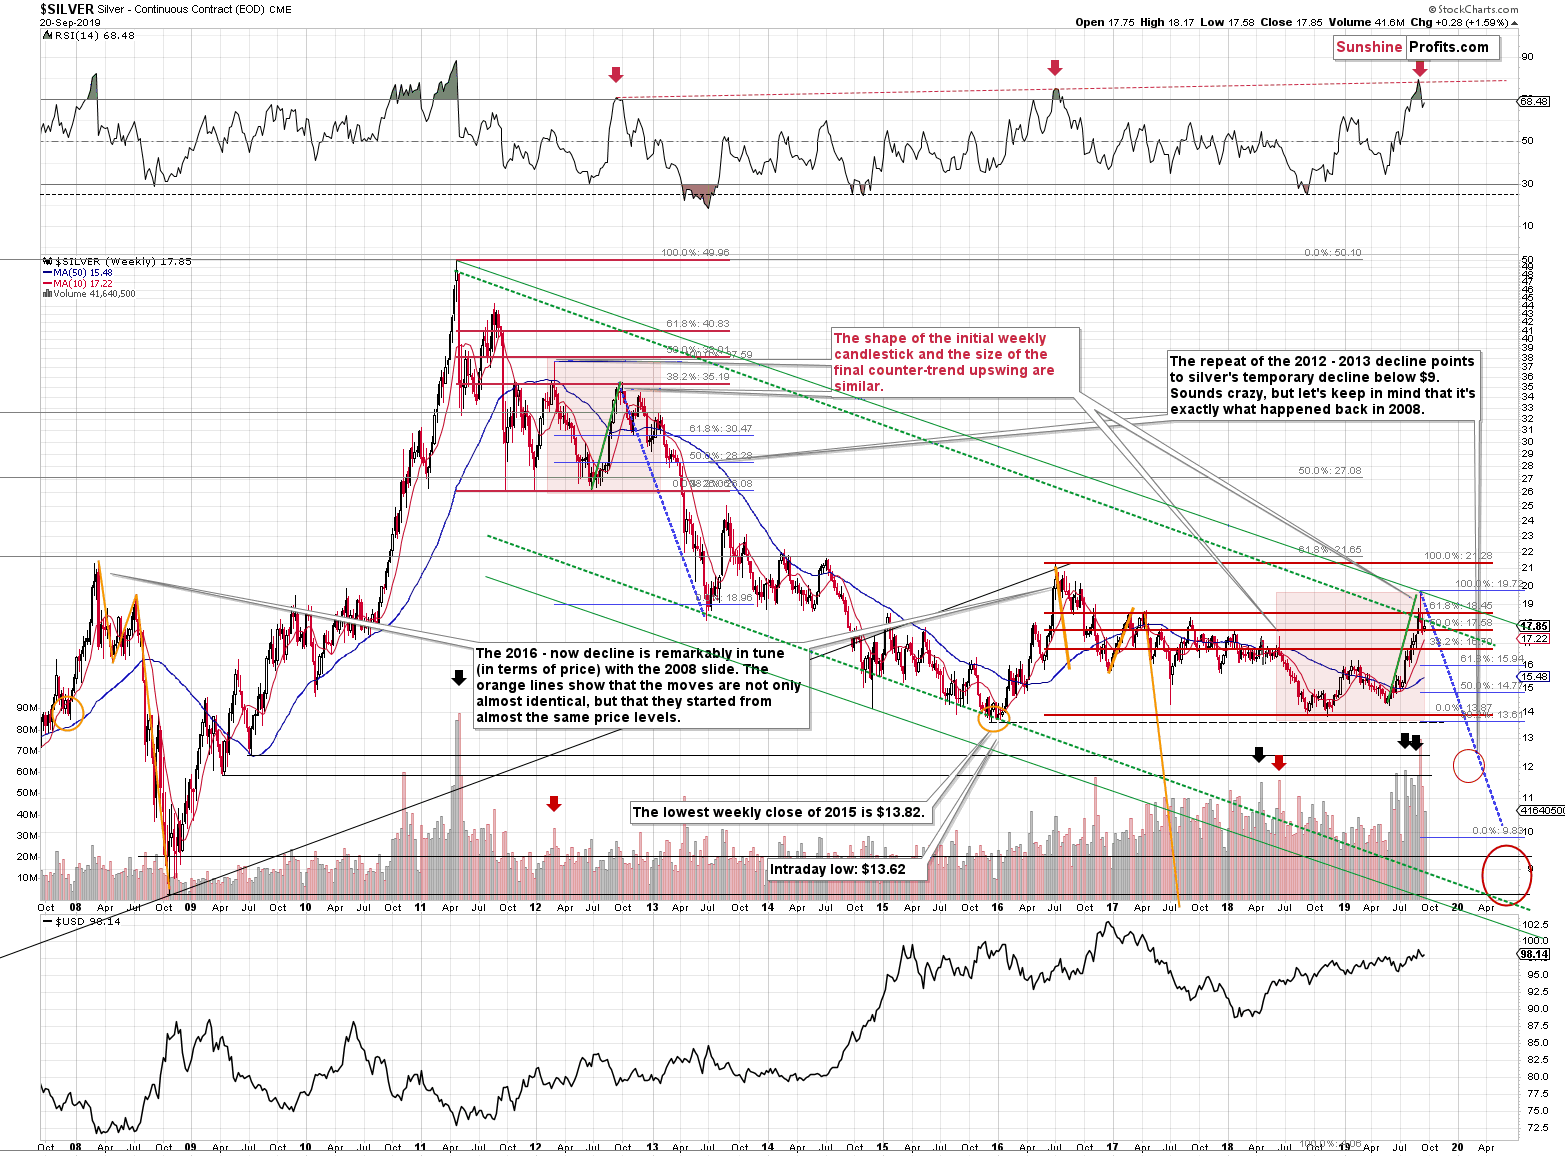
Silver did very little last week so everything that we wrote previously on the above chart remains up-to-date. Silver invalidated its temporary breakout above the 61.8% Fibonacci retracement level based on the 2016 - 2018 declines. It additionally formed a huge reversal candlestick and it took place on enormous volume. This is a very strong bearish combination for the following weeks and months.
The RSI moved below 70 after being extremely overbought. Since 2007, all but one (the 2010 rally) case when it happened were followed huge declines. The 2008 top, the 2011 top, the late-2012 top, and the 2016 top were all preceded by this development. Sure, silver's recent rally may appear bullish at first sight, but the history tends to rhyme. This time is unlikely to be different, and silver is likely to do what it's almost always done in these circumstances: decline heavily.
But What About the Gold Stocks' Strength?
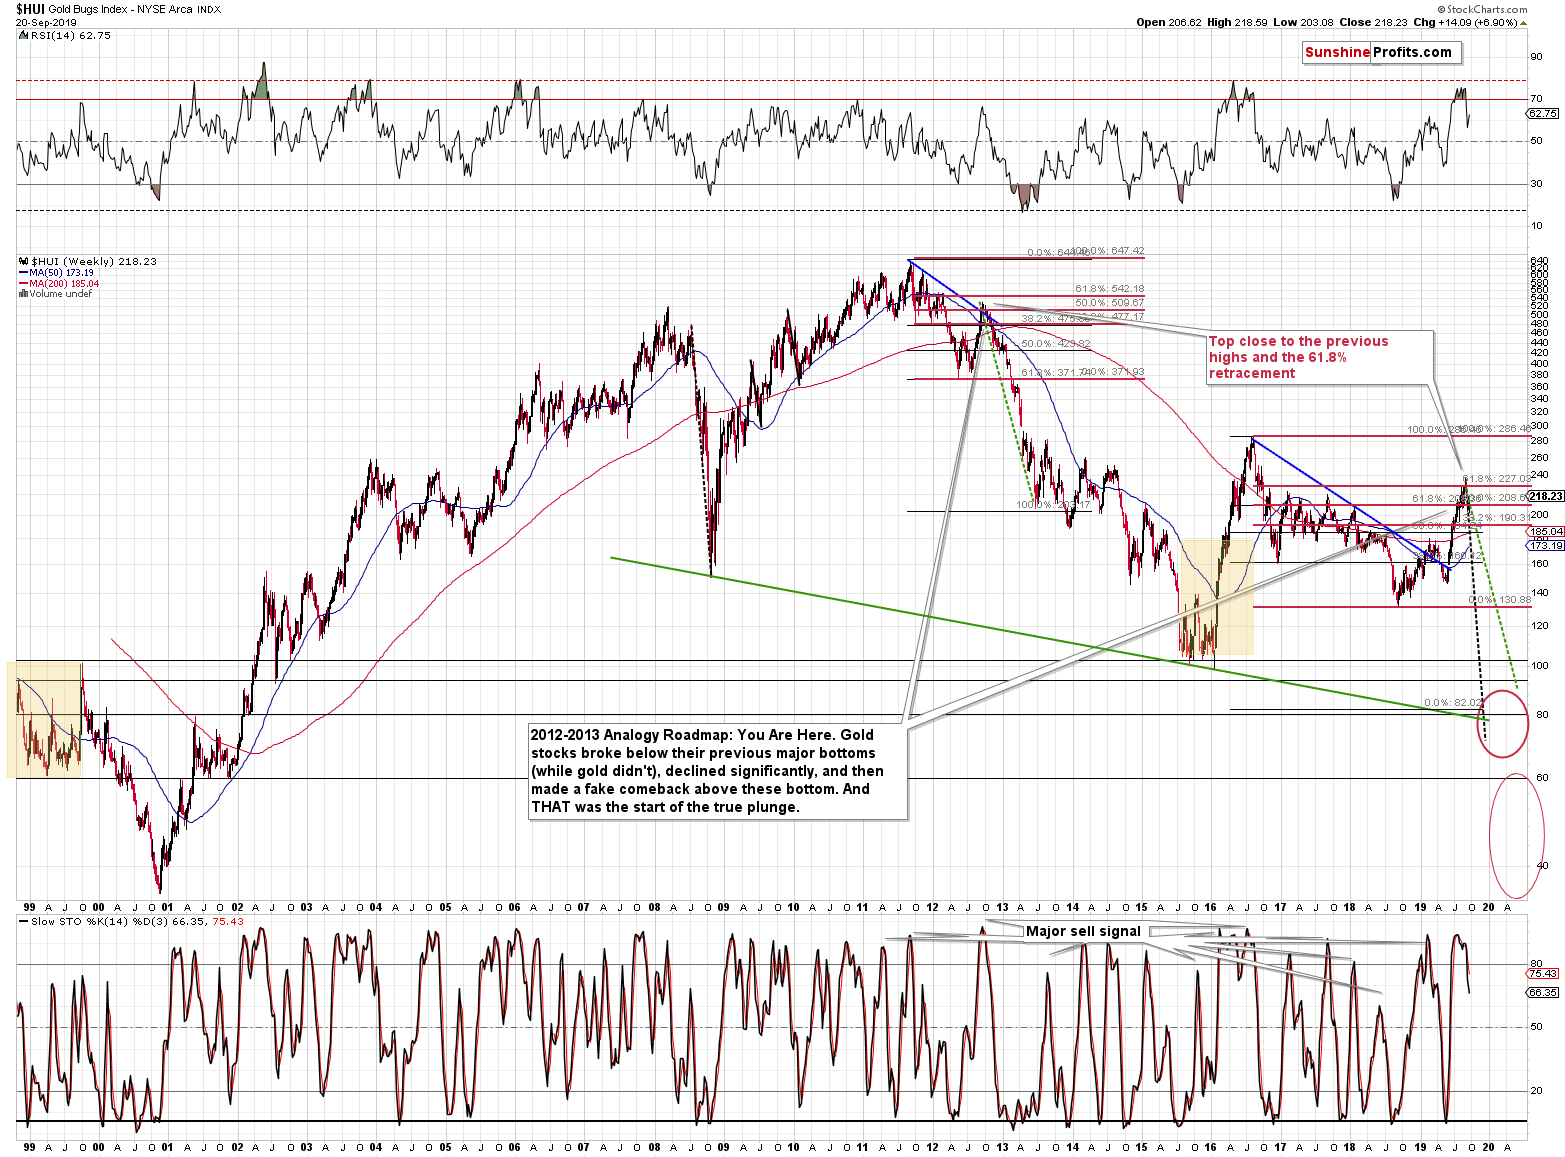
It is true that gold stocks recovered more visibly last week, but it is relatively common for them to be more volatile than gold on a short-term basis. The key question is whether this upswing was significant enough to change the trend. It wasn't. The black and green lines that we copied to the recent high represent the analogies to the 2008 and 2012-2013 declines. Did last week's rally make the current decline look any different? No. That's the kind of volatility and "strength" that was visible even during the biggest and sharpest declines of the past decades. This "strength" was not only not enough to make the outlook appear bullish. It wasn't even enough to make the outlook appear less bearish. Consequently, we don't view it as anything bullish.
Gold stocks invalidated their tiny breakout above the 61.8% Fibonacci retracement level, which means that the 2018-2019 upswing was just a correction within a bigger downtrend.
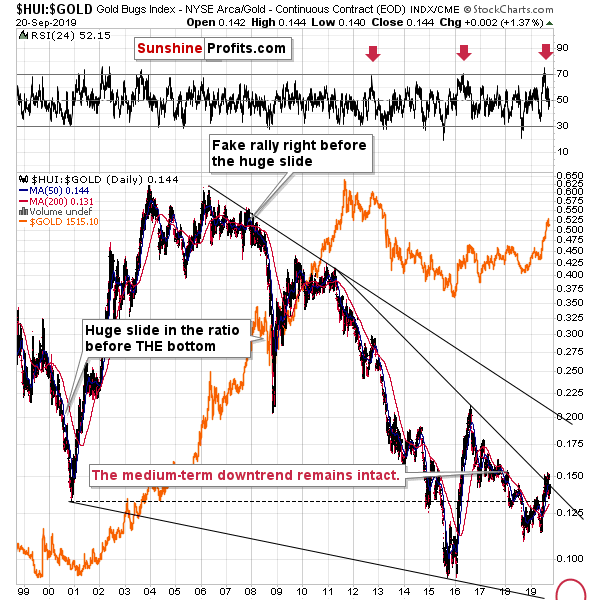
The situation in gold miners is particularly bearish because the gold stocks to gold ratio visible on the above chart recently invalidated its small breakout above the declining resistance line. Last week's upswing was just yet another move to the resistance line. There was no breakout and thus the implications of the previous invalidation remain in place. Gold miners were not strong enough to push the ratio above the resistance. They were not even strong enough to keep the previous gains. This shows that it was just the momentum that "accidentally" pushed the ratio higher, it was not the true strength of the precious metals sector.
We wrote about this earlier, but it's worth re-stating it again. It was practically only gold that rallied recently in any meaningful manner. In other words, most of the PM sector didn't rally significantly this year. Sure, the rest of the PM sector moved higher as well, but it was nothing to call home about when looking at the market from the long-term point of view. Neither silver, nor gold stocks, nor silver stocks managed to move to, let alone above, their 2016 highs.
Gold was almost forced to rally due to the exaggeration of the Twitter politics, but the market seems to have learned to pay less and less attention to what Trump is saying and to focus on the actions that really are taking place. Just look at the USD Index for confirmation. Trump is calling for zero or negative interest rates, and the USD Index is close to its yearly highs. Moreover, even though the USD declined after almost every dovish comment from Trump or the Fed, the reactions were smaller in each case and the rebounds were getting bigger. This resulted in an overall uptrend despite Trump's comments and despite the shift from rate hikes to rate cuts. The implications for the USD Index are tremendously bullish, and consequently bearish for gold. They are bearish for the gold market not only because of the rising USDX. They are bearish because the market is paying less attention to what Trump is saying and reacting in a less volatile way to it. Lower perceived risk means lower safe-haven demand for gold. The latter seems to have peaked a few weeks ago and how the trend has reversed.
Since we are discussing ratios, let's take a look at the one between gold and silver.
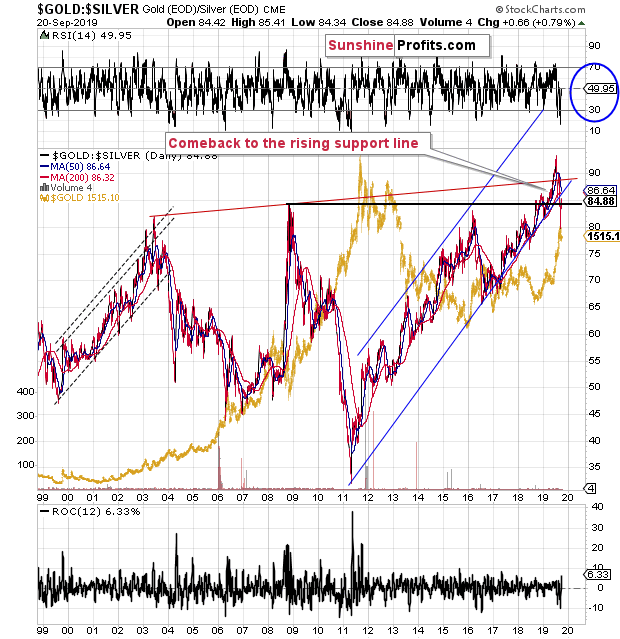
The gold to silver ratio first soared above the 2008 high and the rising red resistance line and then it invalidated the breakout, after which it declined sharply. The move was sharp, but it was not sustainable. The major trend remains up and the ratio is once again above the 2008 high. The decline in the ratio was fake, just like the early-2008 and mid-2012 declines were. The situation in the gold to silver ratio simply doesn't confirm any bullish silver forecasts.
On a short-term basis, the breakdown below the line based on the 2016 and 2018 lows was just invalidated, which bodes well for the ratio's rally. It also points to a decline in both precious metals in the following weeks, with silver leading the way. Today's strength in silver might be the final move against the trend, similar to shooting a slingshot. The following rally in the ratio is likely to take the ratio back above the lower border of the rising long-term trend channel, which would be a perfect way for the ratio to start its next medium-term upswing. Of course, this would imply a medium-term decline in the precious metals.
Key Factors to Keep in Mind
Critical factors:
- The USD Index broke above the very long-term resistance line and verified the breakout above it. Its huge upswing is already underway.
- The USD's long-term upswing is an extremely important and bearish factor for gold. There were only two similar cases in the past few decades, when USD Index was starting profound, long-term bull markets, and they were both accompanied by huge declines in gold and the rest of the precious metals market
- Out of these two similar cases, only one is very similar - the case when gold topped in February 1996. The similarity extends beyond gold's about a yearly delay in reaction to the USD's rally. Also the shape of gold price moves prior to the 1996 high and what we saw in the last couple of years is very similar, which confirm the analysis of the gold-USD link and the above-mentioned implications of USD Index's long-term breakout.
- The similarity between now and 1996 extends to silver and mining stocks - in other words, it goes beyond USD, gold-USD link, and gold itself. The white metal and its miners appear to be in a similar position as well, and the implications are particularly bearish for the miners. After their 1996 top, they erased more than 2/3rds of their prices.
- Many investors got excited by the gold-is-soaring theme in the last few months, but looking beyond the short-term moves, reveals that most of the precious metals sector didn't show substantial strength that would be really visible from the long-term perspective. Gold doesn't appear to be starting a new bull market here, but rather to be an exception from the rule.
- Gold's True Seasonality around the US Labor Day points to a big decline shortly.
Very important, but not as critical factors:
- Long-term technical signs for silver, i.a. the analogy in terms of price to what we saw in 2008, shows that silver could slide even below $10.
- Silver's very long-term cycles point to a major reversal taking place right now and since the most recent move was up, the implications are bearish (this is also silver's technical sign, but it's so important that it deserves its own point)
- Long-term technical signs for gold stocks point to this not being a new gold bull market beginning. Among others, it's their long-term underperformance relative to gold that hint this is rather a corrective upswing within a bear market that is not over yet.
- Record-breaking weekly volume in gold is a strong sign pointing to lower gold prices
Important factors:
- Extreme volume reading in the SIL ETF (proxy for silver stocks) is an effective indication that lower values of silver miners are to be expected
- Silver's short-term outperformance of gold, and gold stocks' short-term underperformance of gold both confirm that the precious metals sector is topping here
- Gold topped almost right at its cyclical turning point, which makes the trend reversal more likely
- Copper broke below its head-and-shoulders pattern and confirmed the breakdown. The last time we saw something similar was in April 2013, when the entire precious metals sector was on the verge of plunging lower.
Moreover, please note that while there may be a recession threat, it doesn't mean that gold has to rally immediately. Both: recession and gold's multi-year rally could be many months away - comparing what happened to bond yields in the 90s confirms that.
Copper moved above the neck level of its head-and-shoulders pattern that's based on the intraday lows, but it didn't invalidate the analogous level based on the weekly closing prices, so we don't think it's justified to say that this bearish formation was invalidated at this time.
Summary
Summing up, the big decline in the precious metals sector appears to be finally underway, and the temporary USD-reversal-caused rally in gold and silver is likely coming to an end. Let's keep in mind that once the USDX takes off, it will likely serve as fuel to the fire-like decline in the PMs that's already underway. The similarity to mid-90s continues to support much lower gold prices in the following months. All in all, it seems that what we see right now is the beginning of the final stage of the prolonged decline in the precious metals sector that started in 2011. On a short-term basis, it seems that we might get some temporary strength once gold moves to about $1,330 - perhaps within the next several weeks.
As always, we'll keep you - our subscribers - informed.
To summarize:
Trading capital (supplementary part of the portfolio; our opinion): Full speculative short position (250% of the full position) in gold, silver, and mining stocks is justified from the risk/reward perspective with the following stop-loss orders and exit profit-take price levels:
- Gold: profit-take exit price: $1,332; stop-loss: $1,583; initial target price for the DGLD ETN: $39.87; stop-loss for the DGLD ETN: $25.17
- Silver: profit-take exit price: $14,62; stop-loss: $20,16; initial target price for the DSLV ETN: $32.96; stop-loss for the DSLV ETN: $11.67
- Mining stocks (price levels for the GDX ETF): profit-take exit price: $22.62; stop-loss: $32.37; initial target price for the DUST ETF: $17.28; stop-loss for the DUST ETF $5.48
In case one wants to bet on junior mining stocks' prices (we do not suggest doing so - we think senior mining stocks are more predictable in the case of short-term trades - if one wants to do it anyway, we provide the details), here are the stop-loss details and target prices:
- GDXJ ETF: profit-take exit price: $30.32; stop-loss: $45.42
- JDST ETF: profit-take exit price: $38.36 stop-loss: $11.26
Long-term capital (core part of the portfolio; our opinion): No positions (in other words: cash)
Insurance capital (core part of the portfolio; our opinion): Full position
Whether you already subscribed or not, we encourage you to find out how to make the most of our alerts and read our replies to the most common alert-and-gold-trading-related-questions.
Please note that the in the trading section we describe the situation for the day that the alert is posted. In other words, it we are writing about a speculative position, it means that it is up-to-date on the day it was posted. We are also featuring the initial target prices, so that you can decide whether keeping a position on a given day is something that is in tune with your approach (some moves are too small for medium-term traders and some might appear too big for day-traders).
Plus, you might want to read why our stop-loss orders are usually relatively far from the current price.
Please note that a full position doesn't mean using all of the capital for a given trade. You will find details on our thoughts on gold portfolio structuring in the Key Insights section on our website.
As a reminder - "initial target price" means exactly that - an "initial" one, it's not a price level at which we suggest closing positions. If this becomes the case (like it did in the previous trade) we will refer to these levels as levels of exit orders (exactly as we've done previously). Stop-loss levels, however, are naturally not "initial", but something that, in our opinion, might be entered as an order.
Since it is impossible to synchronize target prices and stop-loss levels for all the ETFs and ETNs with the main markets that we provide these levels for (gold, silver and mining stocks - the GDX ETF), the stop-loss levels and target prices for other ETNs and ETF (among other: UGLD, DGLD, USLV, DSLV, NUGT, DUST, JNUG, JDST) are provided as supplementary, and not as "final". This means that if a stop-loss or a target level is reached for any of the "additional instruments" (DGLD for instance), but not for the "main instrument" (gold in this case), we will view positions in both gold and DGLD as still open and the stop-loss for DGLD would have to be moved lower. On the other hand, if gold moves to a stop-loss level but DGLD doesn't, then we will view both positions (in gold and DGLD) as closed. In other words, since it's not possible to be 100% certain that each related instrument moves to a given level when the underlying instrument does, we can't provide levels that would be binding. The levels that we do provide are our best estimate of the levels that will correspond to the levels in the underlying assets, but it will be the underlying assets that one will need to focus on regarding the signs pointing to closing a given position or keeping it open. We might adjust the levels in the "additional instruments" without adjusting the levels in the "main instruments", which will simply mean that we have improved our estimation of these levels, not that we changed our outlook on the markets. We are already working on a tool that would update these levels on a daily basis for the most popular ETFs, ETNs and individual mining stocks.
Our preferred ways to invest in and to trade gold along with the reasoning can be found in the how to buy gold section. Additionally, our preferred ETFs and ETNs can be found in our Gold & Silver ETF Ranking.
As a reminder, Gold & Silver Trading Alerts are posted before or on each trading day (we usually post them before the opening bell, but we don't promise doing that each day). If there's anything urgent, we will send you an additional small alert before posting the main one.
=====
Latest Free Trading Alerts:
Starting this week, we will publish the weekly economic news calendar. It will be released on Monday morning and will include the key news releases broken down into different markets for the convenience of readers. So let's take a look at the possible market-moving events in the coming week.
The Important Economic News Calendar: September 23 - September 27, 2019
=====
Thank you.
Sincerely,
Przemyslaw Radomski, CFA
Editor-in-chief, Gold & Silver Fund Manager

