

Briefly: in our opinion, full (250% of the regular size of the position) speculative short position in gold, silver, and mining stocks are justified from the risk/reward point of view at the moment of publishing this Alert.
The USD Index soared relentlessly in the previous months and it happened in the face of more and more bearish news that should have made it decline. The USD Index showed strength even in light of US President's calls for zero or negative interest rates! Is there anything that the USD Index can't do right now? When will it's rally finally end? And most importantly for us - gold and silver investors - how will that relate to the upcoming gold & silver price moves?
Let's start the USD discussion with the short-term changes and then zoom out to incorporate more details. In other words, we'll start with trees and then move to the forest.
The USD Index moved in a volatile manner this week, but that's not the most important thing about this market. The most important details are the price level that was reached during the intraday bottom, and how it relates to the previous lows.
In the Footsteps of the USD Index
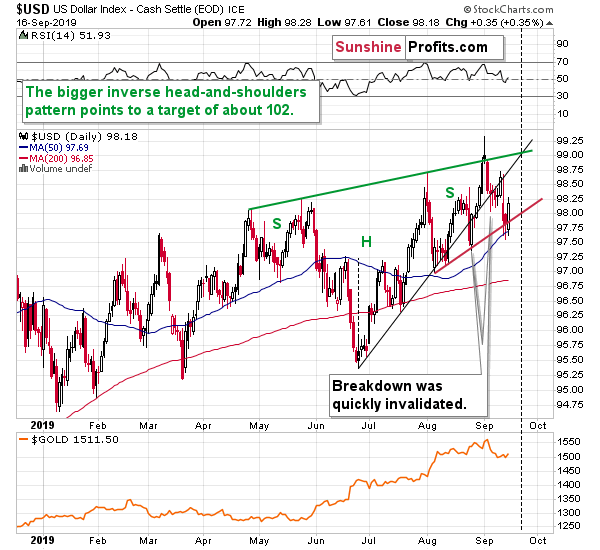
It was yet another higher low. The ultimate low this year formed in early January. Then, we saw a higher low in late January. Then a higher low in March, then a higher low in June, then a higher low in mid-July, then two higher lows in August and finally the higher low that we saw this week. Higher lows mean uptrend. Trendlines are useful to detect the turnarounds and Fibonacci retracements tell us if the move in the opposite direction is significant enough to be viewed as a trend change. However, the underlying rule is simple. If the price is on average moving up, then the market is an uptrend. Looking at the relative placement of lows and highs tells us the same thing. By the way, the highs in the USD Index have also been increasing this year.
While the rising black support line was already broken, it didn't cause the USDX to decline below the previous local low. It didn't decline below the red line that's based on the August lows either. And that's despite Trump calling for zero percent rate policy or even negative interest rate policy.
In the previous Alerts we wrote that the market will be viewing the U.S. President's tweets and comments as less and less important, given how often Trump changes his mind (remember how quickly North Korean "fire and fury" threats turned into a handshake?). The higher USDX lows confirm that. It didn't matter that Trump demanded radically lower interest rates. The currency traders didn't care much.
What did all the above result in? We have the USD Index above 98, close to the yearly highs. It mostly doesn't react to bearish news and it comes back stronger after each of such news is presented.
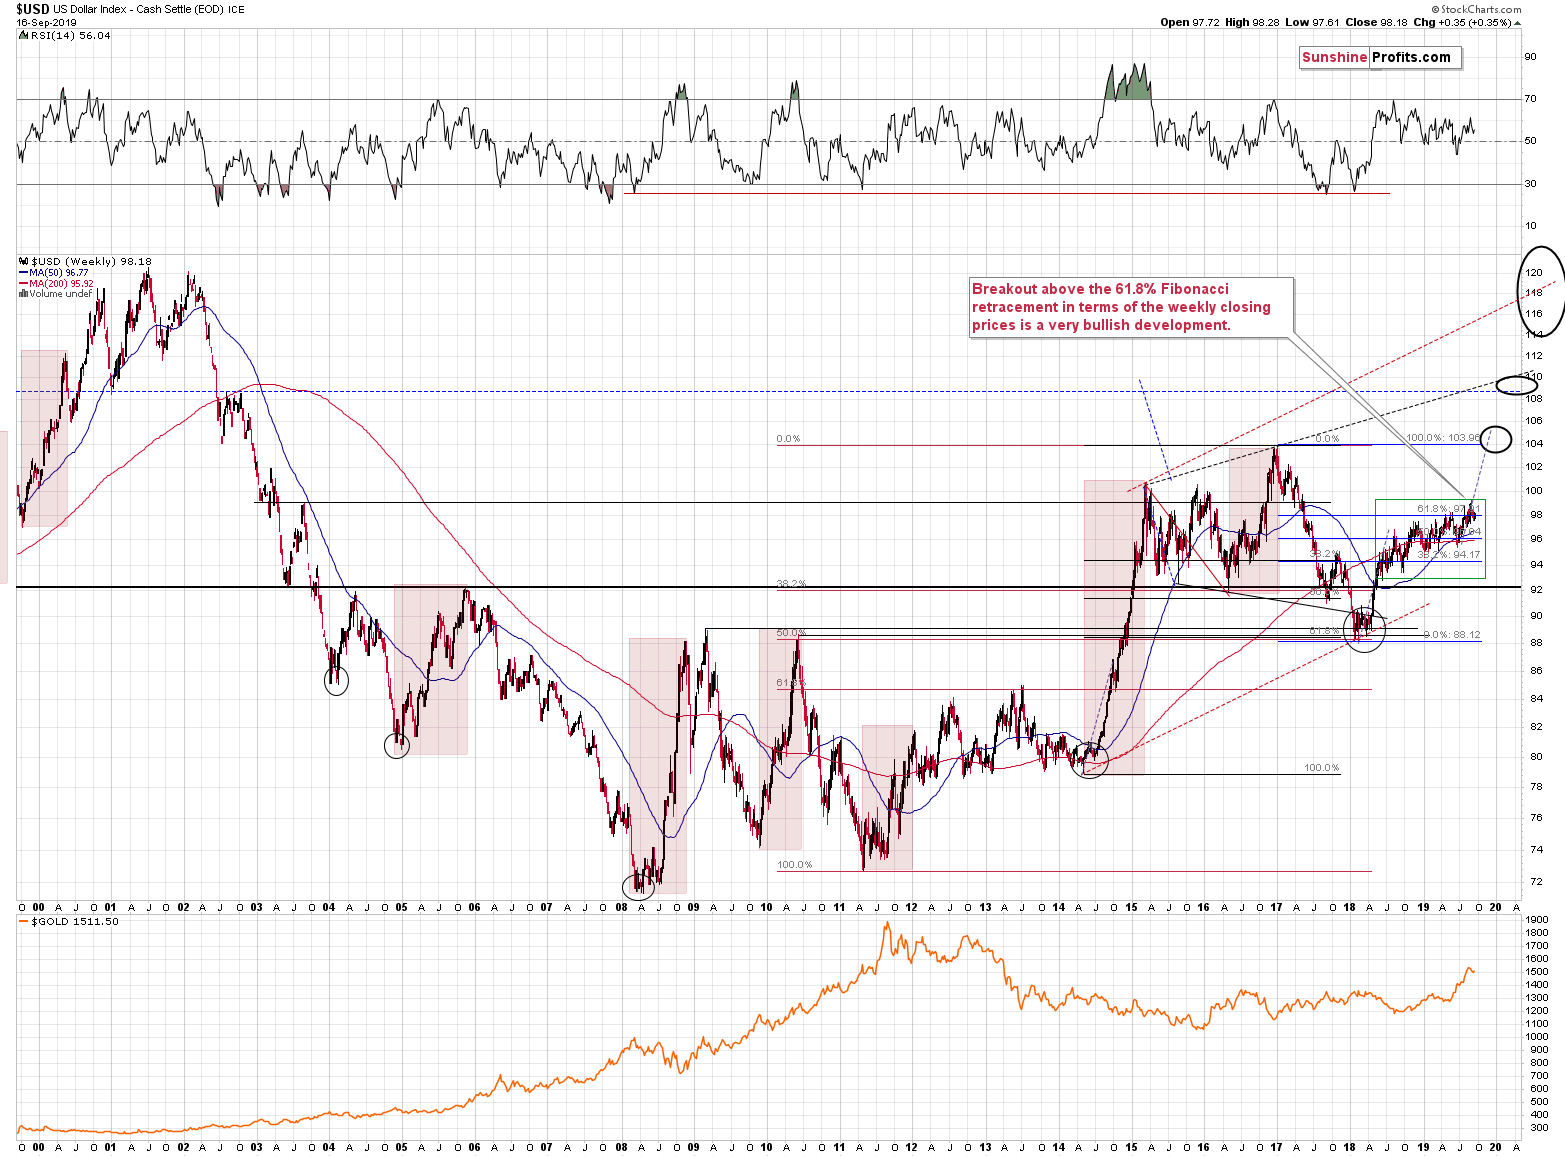
On the long-term chart it's clear that it resulted in a prolonged, but "running" correction, where USD forms higher lows and higher highs - the most bullish form of correction. USD's resilience to the negative news makes the breakout from the current consolidation very likely. Moreover, the USD Index managed to close the previous week above the May high (in weekly closing terms), thus verifying the breakout above it. It's also above the 61.8% Fibonacci retracement based on the 2017 - 2018 decline, which means that it's not just a corrective upswing that we're looking at. It's a new powerful rally.
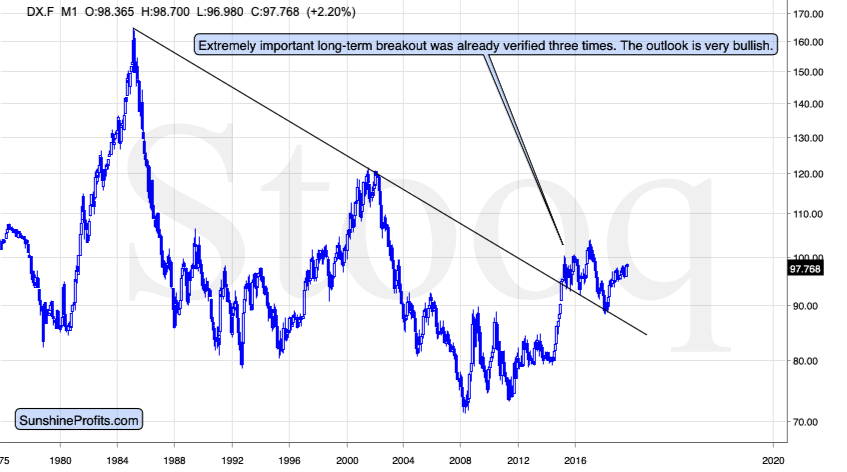
Most importantly, however, the USD Index is after a long-term breakout above the declining resistance line and its verification.
That's one of the most bullish combinations of very long-term, long-term and short-term factors that a market can get.
The question that we received recently from one of our subscribers is how long the rally in the USDX might take. The short answer is that we would measure it in years, not in months. The details are not clear, though. The history tends to repeat itself but it doesn't do so to the letter.
How long did the previous major rallies take? It depends on how one measures them. Is it the final bottom from which the rally starts, or is it the specific moment from which the USD Index takes off in a more volatile manner? It's easier to use the former approach, but we think the latter is more appropriate. Why? Because if the price just moves back and forth but in a very slow uptrend, then it causes next to no emotional engagement from investors and traders. That's why sharp rallies tend to burn out quicker than steady, boring uptrends. If we focus on the part of the rally that took place after the breakout was verified, we tap into this "emotional limit" and it should theoretically be comparable between the years. At least more so than the rallies that would be measured from the exact bottom to the exact top.
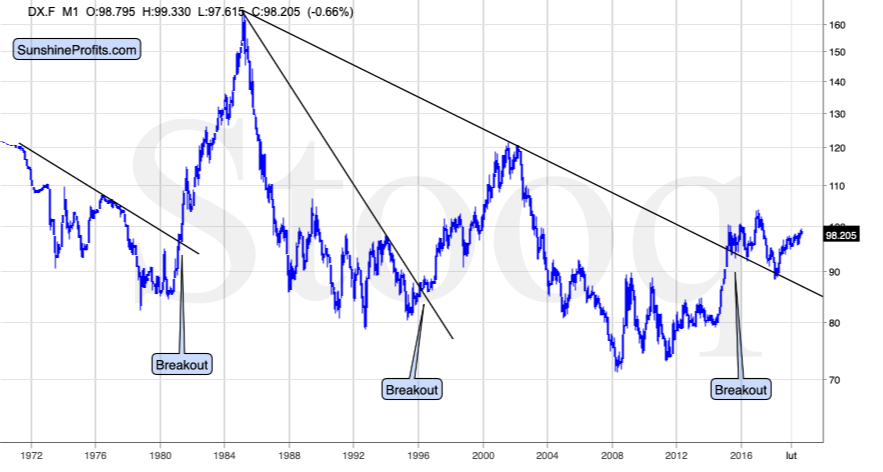
Let's check the major bottoming and topping dates:
Bottom: October 1978
Breakout's verification: April 1981
Top: February 1985
Difference between the bottom to top: 6 years and 4 months
Difference between the breakout and the top: 3 years and 10 months
Bottom: September 1992
Breakout's verification: July 1996
Top: July 2001
Difference between the bottom to top: 8 years and 10 months
Difference between the breakout and the top: 4 years
Indeed, the time from the exact bottom to the exact top varied more than the time between breakouts' verifications and the final tops. In fact, with only 2 months of difference, the latter was very much in tune. The average rally was 3 years and 11 months. The limit of this analysis is that we have just two comparable cases, but their alignment indicates that this technique could be quite useful.
Now, the recent breakout took place in 2015, but it was verified in February, 2018. Adding 3 years and 11 months to this time means that we should expect the USD Index's rally to end close to the end of 2021.
Let's see how the above fits the long-term USD chart.
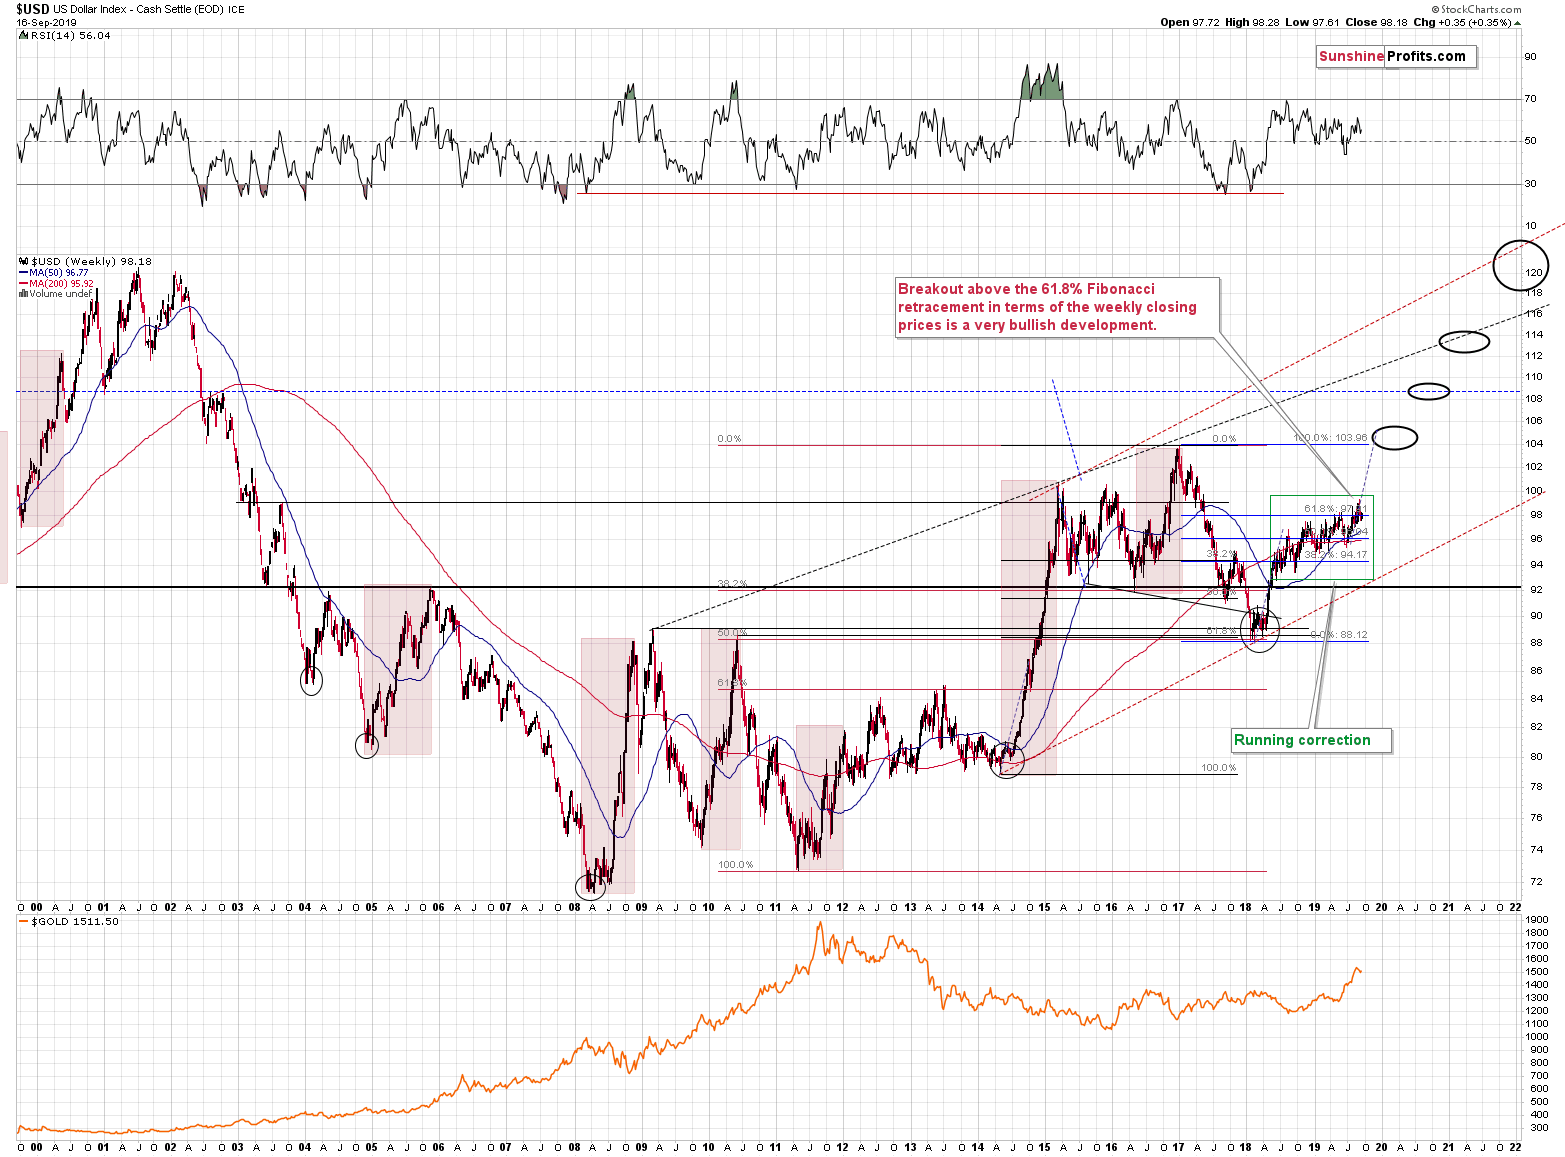
This prediction fits the technical picture very well. At the end of 2021, the USD Index could move to its all-time 2001 high, which was more or less when the precious metals sector bottomed.
Does it mean that gold, silver, and mining stocks will decline for more than 2 years?
It's one of the possibilities, but not the most likely one. While the big trends are likely to be aligned, the bottoms and tops in the USDX and in gold don't have to take place at exactly the same time. For instance, gold's bottom in late 2015 took place before the USD's top in early 2017 - about a year earlier. Gold's, silver's, and miners' bottom might be one year away, even though the USD Index's top might be over 2 years away. While we're not saying that gold will bottom exactly one year from now, we are saying that it's quite likely that gold will bottom before the USD tops.
Seeing how gold shows strength despite the rising USD will be one of the signs we will be looking for as confirmations of the epic buying opportunity in the precious metals sector. Of course, there are also other things that will need to be taken into account, like silver's and miners' performance. The latter is particularly important - for instance, the recent upswing in gold took place despite higher USD values, but silver and miners didn't show similar kind of strength - they didn't even manage to move above their 2016 highs. Consequently, the current situation is more like what we saw in mid-90s (start of the big decline) than what we saw in 2001 (start of the big rally).
As far as the short-term price changes are concerned, we have very little to comment on today.
Little Short-Term Change in PMs
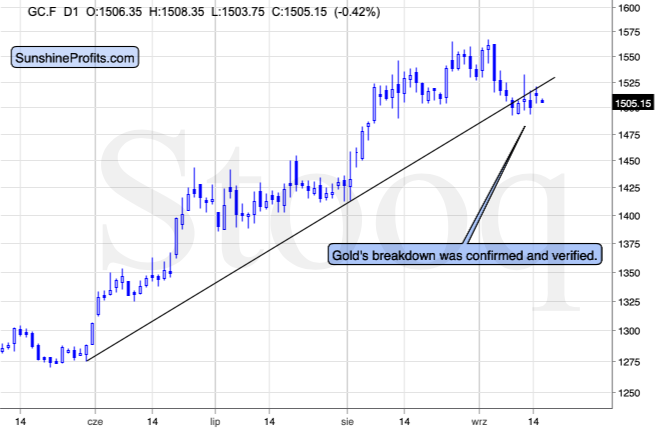
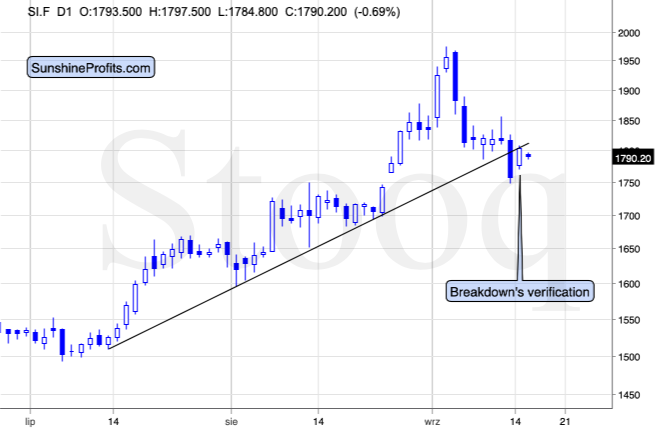
Gold and silver are verifying their breakdowns, which simply serves as a confirmation of the bearish factors that we see on the medium- and long-term charts.
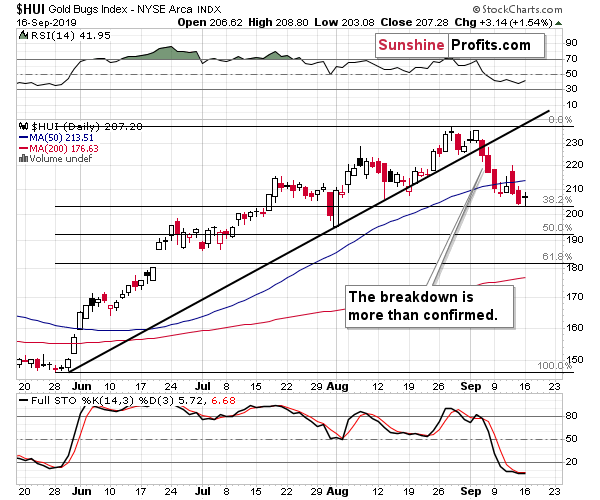
Moreover, even though gold's yesterday's upswing was relatively visible on a short-term basis, gold miners' reaction was negligible. The HUI Index moved only a bit higher. Gold's closing price that we saw yesterday was the highest closing price that we saw in 5 days. In case of gold miners, it was the second lowest closing price. The miners' underperformance continues to point to lower precious metals prices in the following days and weeks.
Before summarizing, we would like to once again quote the section with links to most important bearish factors that are currently in play:
Key Factors to Keep in Mind
Critical factors:
- The USD Index broke above the very long-term resistance line and verified the breakout above it. Its huge upswing is already underway.
- The USD's long-term upswing is an extremely important and bearish factor for gold. There were only two similar cases in the past few decades, when USD Index was starting profound, long-term bull markets, and they were both accompanied by huge declines in gold and the rest of the precious metals market
- Out of these two similar cases, only one is very similar - the case when gold topped in February 1996. The similarity extends beyond gold's about a yearly delay in reaction to the USD's rally. Also the shape of gold price moves prior to the 1996 high and what we saw in the last couple of years is very similar, which confirm the analysis of the gold-USD link and the above-mentioned implications of USD Index's long-term breakout.
- The similarity between now and 1996 extends to silver and mining stocks - in other words, it goes beyond USD, gold-USD link, and gold itself. The white metal and its miners appear to be in a similar position as well, and the implications are particularly bearish for the miners. After their 1996 top, they erased more than 2/3rds of their prices.
- Many investors got excited by the gold-is-soaring theme in the last few months, but looking beyond the short-term moves, reveals that most of the precious metals sector didn't show substantial strength that would be really visible from the long-term perspective. Gold doesn't appear to be starting a new bull market here, but rather to be an exception from the rule.
- Gold's True Seasonality around the US Labor Day points to a big decline shortly.
Very important, but not as critical factors:
- Long-term technical signs for silver, i.a. the analogy in terms of price to what we saw in 2008, shows that silver could slide even below $10.
- Silver's very long-term cycles point to a major reversal taking place right now and since the most recent move was up, the implications are bearish (this is also silver's technical sign, but it's so important that it deserves its own point)
- Long-term technical signs for gold stocks point to this not being a new gold bull market beginning. Among others, it's their long-term underperformance relative to gold that hint this is rather a corrective upswing within a bear market that is not over yet.
- Record-breaking weekly volume in gold is a strong sign pointing to lower gold prices
Important factors:
- Extreme volume reading in the SIL ETF (proxy for silver stocks) is an effective indication that lower values of silver miners are to be expected
- Silver's short-term outperformance of gold, and gold stocks' short-term underperformance of gold both confirm that the precious metals sector is topping here
- Gold topped almost right at its cyclical turning point, which makes the trend reversal more likely
- Copper broke below its head-and-shoulders pattern and confirmed the breakdown. The last time we saw something similar was in April 2013, when the entire precious metals sector was on the verge of plunging lower.
Moreover, please note that while there may be a recession threat, it doesn't mean that gold has to rally immediately. Both: recession and gold's multi-year rally could be many months away - comparing what happened to bond yields in the 90s confirms that.
Copper moved above the neck level of its head-and-shoulders pattern that's based on the intraday lows, but it didn't invalidate the analogous level based on the weekly closing prices, so we don't think it's justified to say that this bearish formation was invalidated at this time.
Summary
Summing up, the big decline in the precious metals sector appears to be finally underway as gold and silver are plunging even without a rallying USD Index. And the PMs' decline started right after the U.S. Labor Day, as we have described. Once the USDX takes off, it will likely serve as fuel to the fire-like decline that's already underway. The similarity to mid-90s continues to support much lower gold prices in the following months. All in all, it seems that what we see right now is the beginning of the final stage of the prolonged decline in the precious metals sector that started in 2011. On a short-term basis, it seems that we might get some temporary strength once gold moves to about $1,330 - perhaps within the next few weeks.
As always, we'll keep you - our subscribers - informed.
To summarize:
Trading capital (supplementary part of the portfolio; our opinion): Full speculative short position (250% of the full position) in gold, silver, and mining stocks is justified from the risk/reward perspective with the following stop-loss orders and exit profit-take price levels:
- Gold: profit-take exit price: $1,332; stop-loss: $1,583; initial target price for the DGLD ETN: $39.87; stop-loss for the DGLD ETN: $25.17
- Silver: profit-take exit price: $14,62; stop-loss: $20,16; initial target price for the DSLV ETN: $32.96; stop-loss for the DSLV ETN: $11.67
- Mining stocks (price levels for the GDX ETF): profit-take exit price: $22.62; stop-loss: $32.37; initial target price for the DUST ETF: $17.28; stop-loss for the DUST ETF $5.48
In case one wants to bet on junior mining stocks' prices (we do not suggest doing so - we think senior mining stocks are more predictable in the case of short-term trades - if one wants to do it anyway, we provide the details), here are the stop-loss details and target prices:
- GDXJ ETF: profit-take exit price: $30.32; stop-loss: $45.42
- JDST ETF: profit-take exit price: $38.36 stop-loss: $11.26
Long-term capital (core part of the portfolio; our opinion): No positions (in other words: cash)
Insurance capital (core part of the portfolio; our opinion): Full position
Whether you already subscribed or not, we encourage you to find out how to make the most of our alerts and read our replies to the most common alert-and-gold-trading-related-questions.
Please note that the in the trading section we describe the situation for the day that the alert is posted. In other words, it we are writing about a speculative position, it means that it is up-to-date on the day it was posted. We are also featuring the initial target prices, so that you can decide whether keeping a position on a given day is something that is in tune with your approach (some moves are too small for medium-term traders and some might appear too big for day-traders).
Plus, you might want to read why our stop-loss orders are usually relatively far from the current price.
Please note that a full position doesn't mean using all of the capital for a given trade. You will find details on our thoughts on gold portfolio structuring in the Key Insights section on our website.
As a reminder - "initial target price" means exactly that - an "initial" one, it's not a price level at which we suggest closing positions. If this becomes the case (like it did in the previous trade) we will refer to these levels as levels of exit orders (exactly as we've done previously). Stop-loss levels, however, are naturally not "initial", but something that, in our opinion, might be entered as an order.
Since it is impossible to synchronize target prices and stop-loss levels for all the ETFs and ETNs with the main markets that we provide these levels for (gold, silver and mining stocks - the GDX ETF), the stop-loss levels and target prices for other ETNs and ETF (among other: UGLD, DGLD, USLV, DSLV, NUGT, DUST, JNUG, JDST) are provided as supplementary, and not as "final". This means that if a stop-loss or a target level is reached for any of the "additional instruments" (DGLD for instance), but not for the "main instrument" (gold in this case), we will view positions in both gold and DGLD as still open and the stop-loss for DGLD would have to be moved lower. On the other hand, if gold moves to a stop-loss level but DGLD doesn't, then we will view both positions (in gold and DGLD) as closed. In other words, since it's not possible to be 100% certain that each related instrument moves to a given level when the underlying instrument does, we can't provide levels that would be binding. The levels that we do provide are our best estimate of the levels that will correspond to the levels in the underlying assets, but it will be the underlying assets that one will need to focus on regarding the signs pointing to closing a given position or keeping it open. We might adjust the levels in the "additional instruments" without adjusting the levels in the "main instruments", which will simply mean that we have improved our estimation of these levels, not that we changed our outlook on the markets. We are already working on a tool that would update these levels on a daily basis for the most popular ETFs, ETNs and individual mining stocks.
Our preferred ways to invest in and to trade gold along with the reasoning can be found in the how to buy gold section. Additionally, our preferred ETFs and ETNs can be found in our Gold & Silver ETF Ranking.
As a reminder, Gold & Silver Trading Alerts are posted before or on each trading day (we usually post them before the opening bell, but we don't promise doing that each day). If there's anything urgent, we will send you an additional small alert before posting the main one.
Thank you.
Sincerely,
Przemyslaw Radomski, CFA
Editor-in-chief, Gold & Silver Fund Manager

