

Briefly: in our opinion, full (300% of the regular position size) speculative short positions in mining stocks are justified from the risk/reward point of view at the moment of publishing this Alert.
In the previous days, I discussed the signals coming from the precious metals market or for the precious metals market, as they kept on emerging, and we just received yet another portion of indications. And yes, they also confirm the bearish outlook for the following weeks - or a few months.
Let’s start by looking at the USD Index.
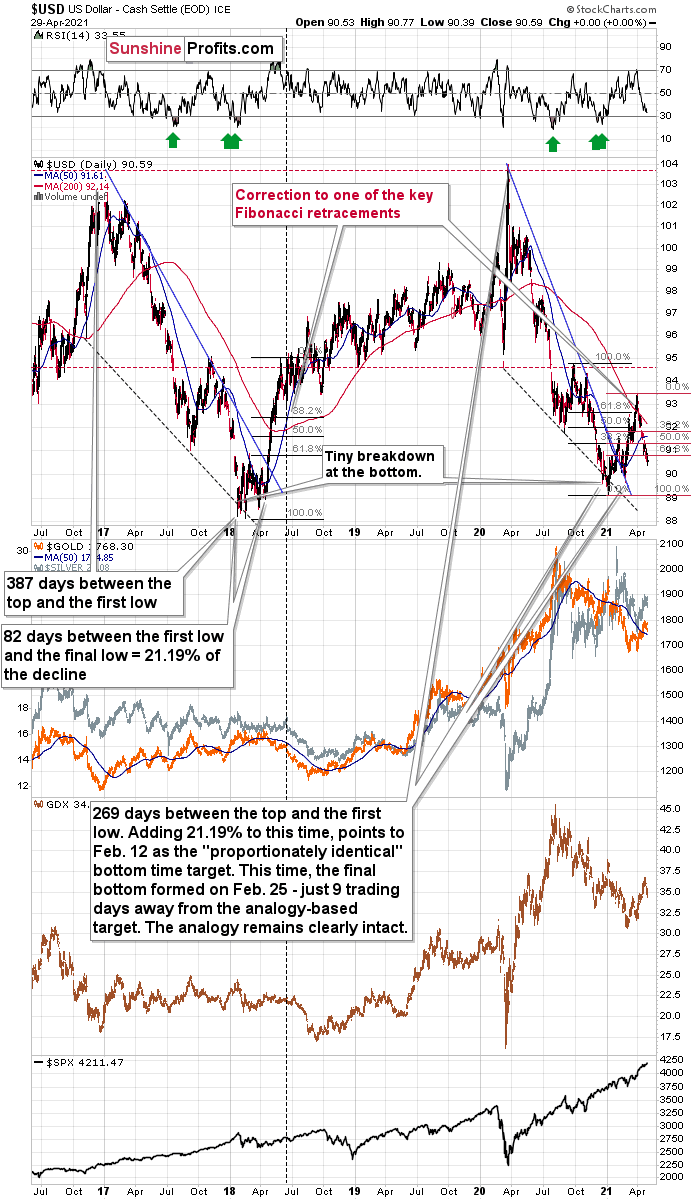
On the above chart you can see that this week, the USD Index broke to new monthly lows. And you can also see that gold didn’t move to a new monthly high. In fact, it was not even close to doing so – it just closed the day below $1,770. This is a clearly bearish sign for gold.
And what about the USD Index?
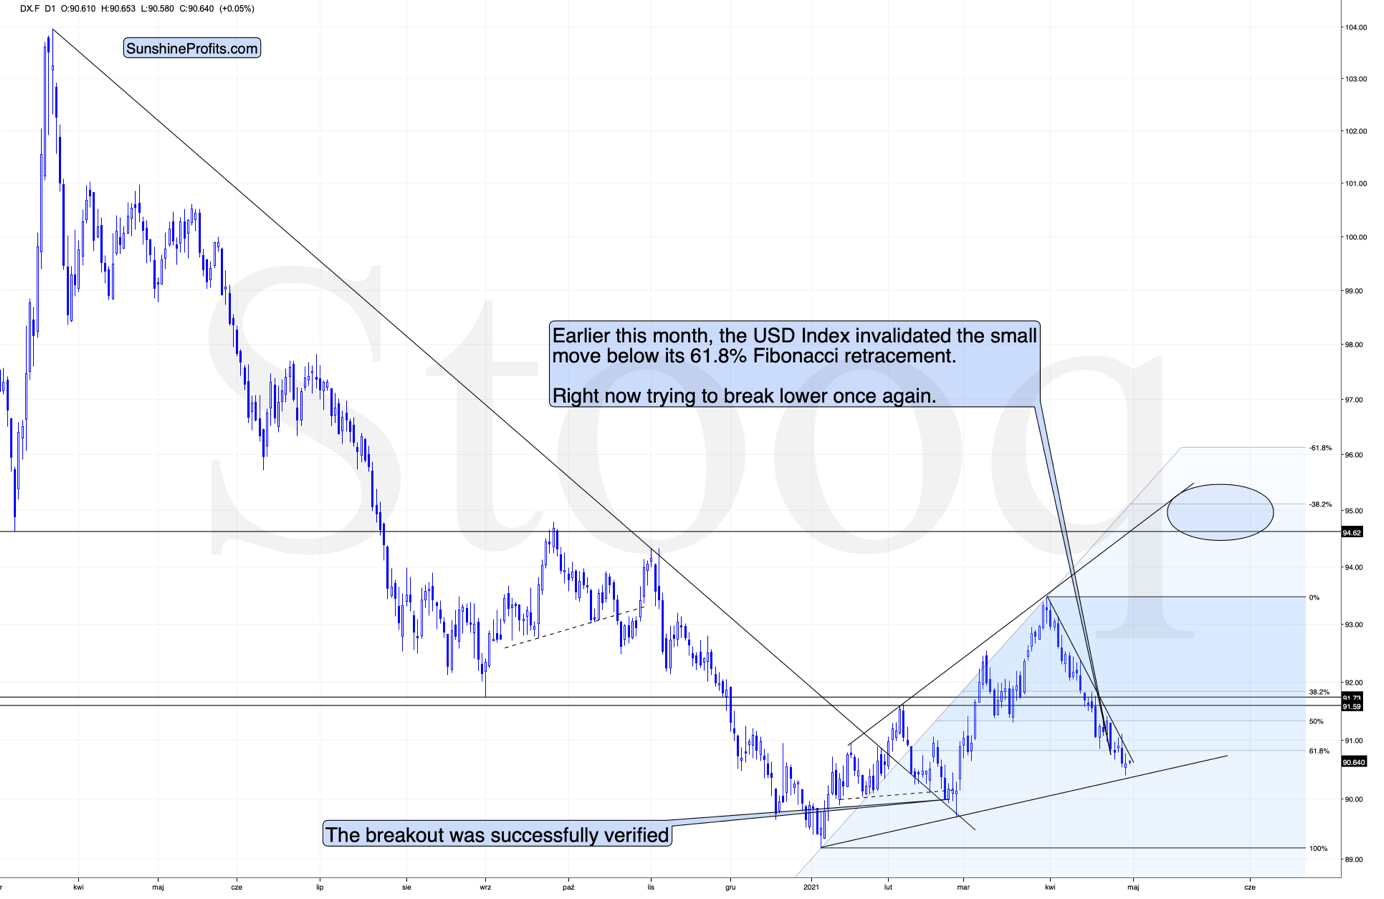
It’s making a second attempt to break below its 61.8% Fibonacci retracement level. Will it be successful? It might be, but… Another support level is just around the corner. Perhaps the proximity to the rising support line based on the January and February lows was actually enough to trigger the rebound yesterday. In this case, the bottom in the USDX is already in. But, we’ll know with much greater certainty when the USDX finally breaks above the declining resistance line and then confirms this breakout.
On the above 4-hour USD Index chart we see that the previous short-term breakout was invalidated, which triggered a substantial sell-off, but… Whatever was likely to happen based on this invalidation seems to have already happened. And it seems that we’re about to see another attempt to break higher. Will the USD Index be successful this time? That’s quite likely, but that’s not the most important thing from the precious metals investors’ and traders’ point of view.
The key thing is that during the recent declines in the USDX (and during the move to new highs in case of the general stock market), gold, silver, and mining stocks didn’t soar. They “should have” if the situation was normal or bullish. They declined instead, which means it’s highly likely that even if the USD Index doesn’t break out now (but a bit later), the decline in the PMs will not be avoided but only delayed.
In fact, to be more precise, it’s unlikely to be delayed as well – what might be delayed is the increase in the pace at which gold, silver, and miners are about to slide. After all, gold and gold stocks are already moving lower (while silver is trading sideways).
By the way, silver’s lack of movement recently is perfectly normal in the early stage of a decline – the white metal tends to catch up big-time in the final part of a given move.
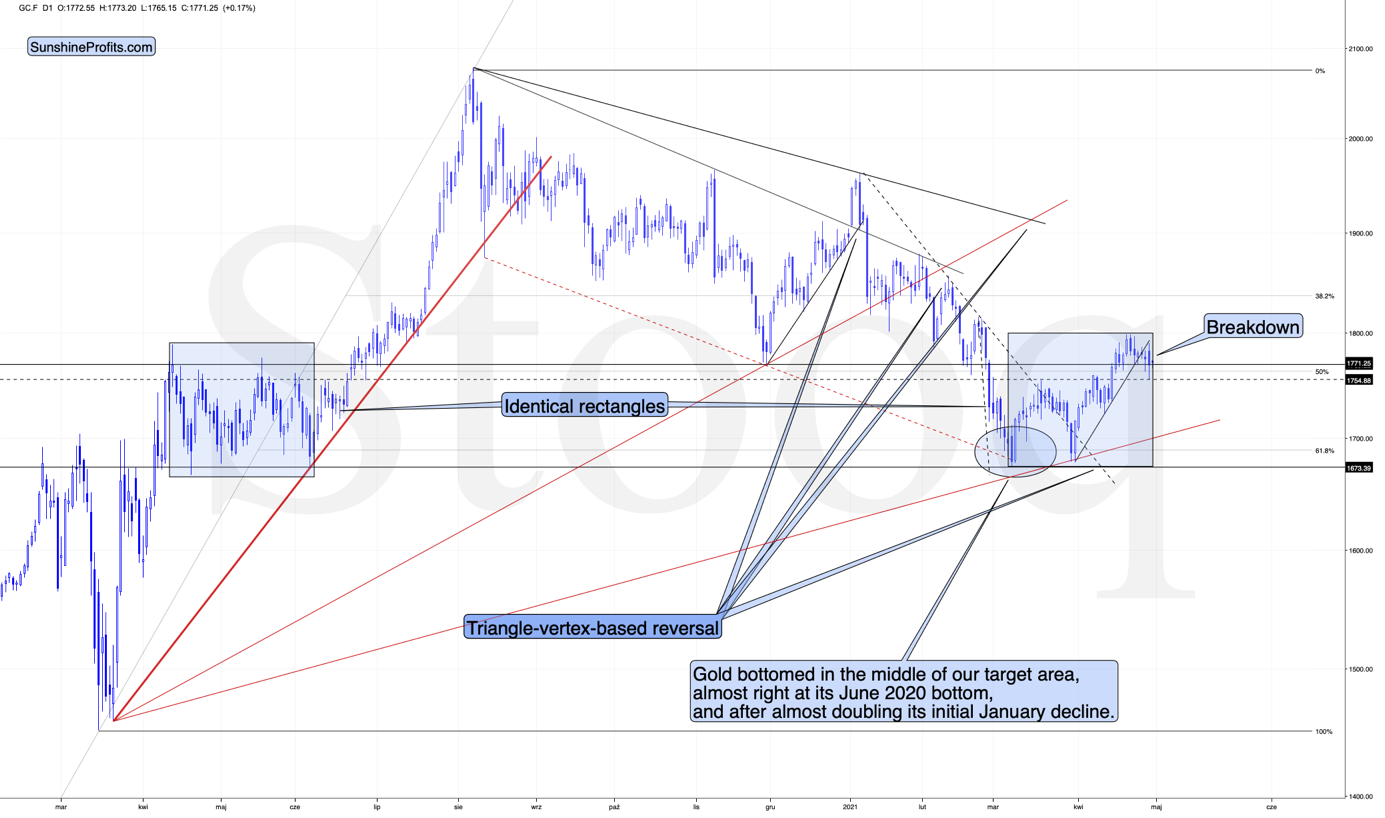
On the above gold chart, you can clearly see how gold moved back up to its rising short-term resistance line this week, and – instead of invalidating the breakdown – it bounced from it and declined once again. This is what verifications of breakdowns look like.
Also, let’s keep in mind that the situation now seems to be a mirror image of what we saw in April – June 2020, and at the same time it’s somewhat similar to what we saw at the beginning of the year. You can see the former (the rectangles are identical) on the above chart, and you can see the similarity to the early January action below.
Just like it was the case in early January, we first saw a pause – a rebound – and the decline continued only thereafter. It seems that the Jan. 7, 2021 price action is quite similar to what we saw yesterday (Apr. 29). Moreover, please note that both happened just above the declining blue support line. It was the final pause before the move higher was invalidated.
Having said the above, let’s move to gold stocks:
In yesterday’s analysis, I described GDX’s previous performance in the following way:
Gold stocks’ intraday recovery that we saw yesterday may seem profound, but not if we consider what happened in the USD Index and the general stock market. The former declined substantially while the latter was close to its all-time highs. This is a combination of factors that “should have” made gold miners move to new highs – and a daily gain of less than half percent is a sign of weakness, not strength.
In today’s pre-market trading the S&P 500 futures moved to new highs, and gold miners showed gains in the London trading, but they are nothing to write home about – and more importantly, nothing that would change the bearish forecast for gold I described more broadly previously.
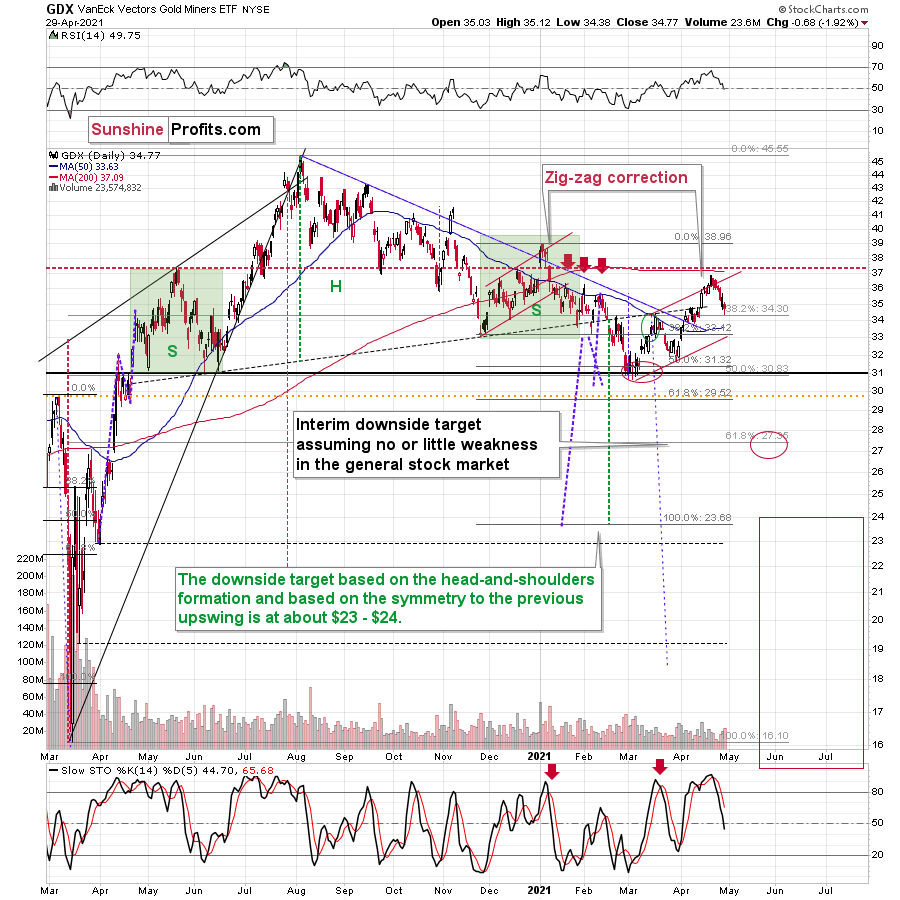
The bearish interpretation of the previous “strength” turned out to have been correct – the GDX ETF declined yesterday.
The decline was even more visible and important in the case of the GDXJ ETF, where we have trading positions.
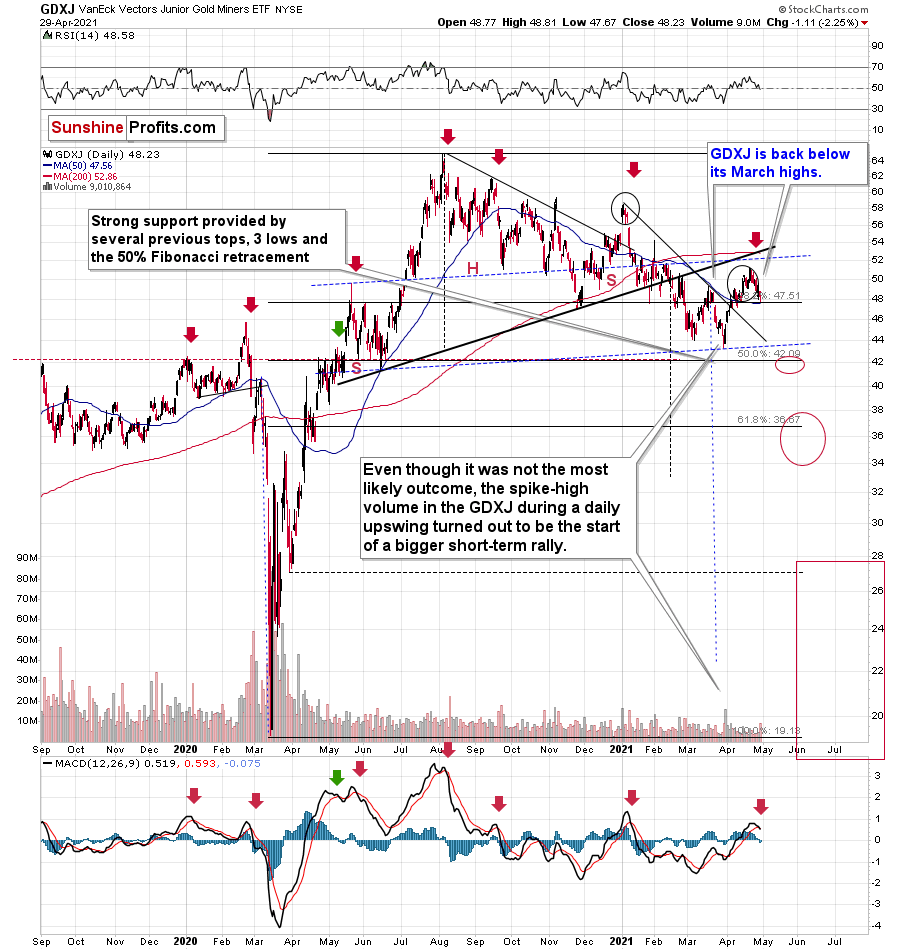
This ETF for junior gold and silver miners (gold miners have much bigger weight in it, though) moved and closed back below its March 2021 highs.
Consequently, we have a situation in which:
- The USD Index is about to reverse and rally.
- Gold signals that it just can’t wait for the USD Index to rally, and it’s already declining (the pace at which it declines is likely to greatly increase once the USD Index takes off).
- Gold miners behave relatively normally, which in this case means that they are declining more than gold does (GLD just closed 1.14% below the highest daily close of April, while the GDX just closed 5.59% below the highest daily close of April). Besides, their recent move back to the May 2020 highs and the subsequent decline further increases the odds that the decline is going to shape the right shoulder of a huge head and shoulders formation with extremely bearish implications (once completed).
- GDXJ is underperforming GDX just as I’ve been expecting it to. While GDX declined by 5.59% so far (in terms of the closing prices), GDXJ declined by 5.67%. This might seem an unimportant level of underperformance, but the perspective changes once one realizes that GDXJ is more correlated with the general stock market than GDX is. Consequently, GDXJ should be showing strength here, and it isn’t. If stocks don’t decline, GDXJ is likely to underperform by just a bit, but when (not if) stocks slide, GDXJ is likely to plunge visibly more than GDX.
The above combination tells me that we are very well positioned in case of our short position in the GDXJ.
Besides, as an analytical cherry on the bearish GDXJ cake, please note that we just saw a sell signal from the MACD indicator (lower part of the chart) while it was visibly above 0, and after a relatively big short-term rally. We saw this kind of performance only several times in the previous year, and it meant declines in almost all cases. We saw it only once before this year – in early January, and a sizable decline followed.
Having said that, let’s take a look at the markets from a more fundamental angle.
Pretend and Defend
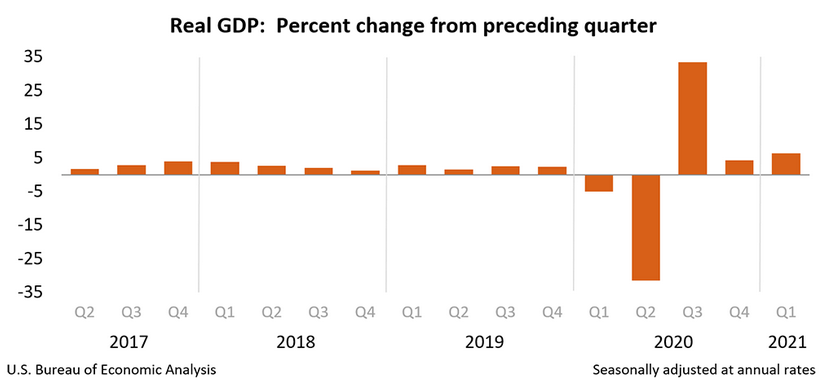
With first-quarter GDP (released on Apr. 29) rising by an annual rate of 6.4% – though coming in slightly below economists’ consensus estimate of 6.5% – it was the fastest growth rate for the U.S. economy since 2003 (excluding the reopening in Q3:2020).
Please see below:
Decomposing the data, the U.S. Bureau of Economic Analysis’s (BEA) release read:
“The increase in real GDP in the first quarter reflected increases in personal consumption expenditures (PCE), nonresidential fixed investment, federal government spending, residential fixed investment, and state and local government spending that were partly offset by decreases in private inventory investment and exports.”
Translation? Stimulus checks led to consumption-driven GDP growth, while dormant business investment and invisible exports – because no one is working – offset some of the strength.
However, what the BEA failed to mention is that the GDP Implicit Price Deflator recorded its largest quarter-over-quarter (QoQ) percentage increase since 1990. For context, the metric measures the change in price of goods and services included in the GDP. For example, if nominal GDP is $10 billion and real GDP (inflation-adjusted) is $9 billion, then the GDP Implicit Price Deflator (10/9) equals 11.1%. Analogous to inflation, the GDP Implicit Price Deflator reveals how much of nominal GDP is attributable to price increases.
Please see below:
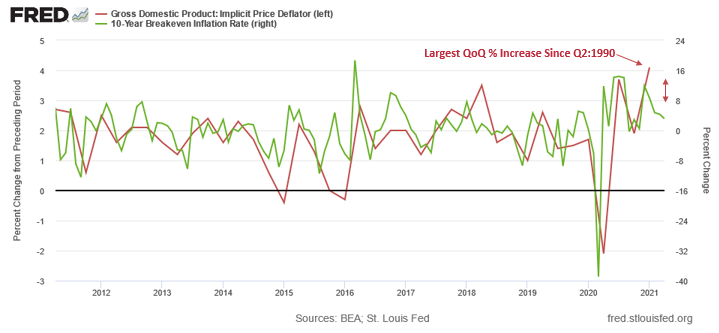
To explain, the red line above tracks the QoQ percentage change in the GDP Implicit Price Deflator, while the green line above tracks the month-over-month (MoM) percentage change in the U.S. 10-Year breakeven inflation rate. If you analyze the behavior of the two lines, you can see that the latter tends to follow in the formers’ footsteps. More importantly, though, if you focus on the right side of the chart, you can see that the 4.1% QoQ surge in the GDP Implicit Price Deflator contrasts the U.S. 10-Year breakeven inflation rate’s decelerating upward momentum. Thus, with Jerome Powell, Chairman of the U.S. Federal Reserve (FED), essentially endorsing another round of commodity speculation on Apr. 28, it likely won’t be long until the U.S. 10-Year breakeven inflation rate makes another sharp move higher.
In addition, I mentioned yesterday that Powell has dismissed recent inflation spikes as “temporary,” saying that “base effects carry no implication for the rate of inflation." However, while base effects distort data when the latest value is compared to an abnormally high or low value seen during the comparable period, it’s important to remember that the QoQ data above compares Q1:2021 to Q4:2020. As a result, there is no base effect.
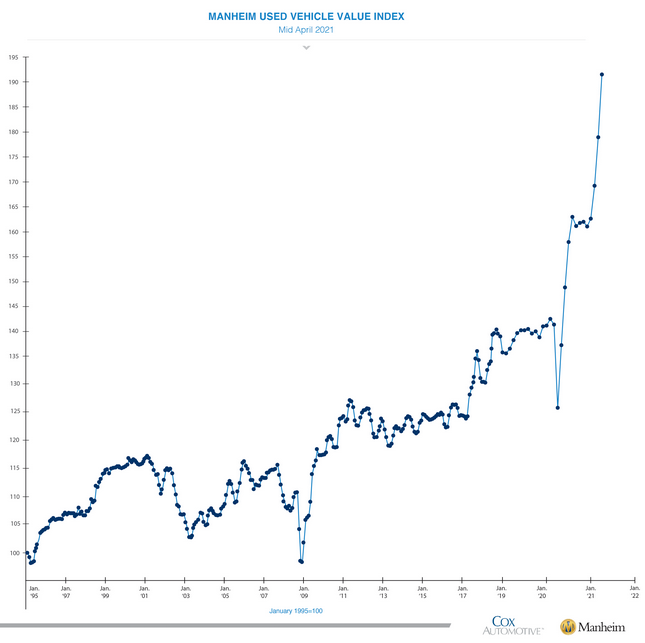
What Can Used Vehicles Tell Us?
On top of that, the Manheim Used Vehicle Index surged by another 6.81% during the first 15 days of April – relative to March 2021 (no base effect) – and the parabolic spike is unlike anything that we’ve ever witnessed before.
Please see below:
But even more revealing, notice the strong correlation between the Manheim Used Vehicle Index and the Used Cars and Trucks Consumer Price Index (CPI)?
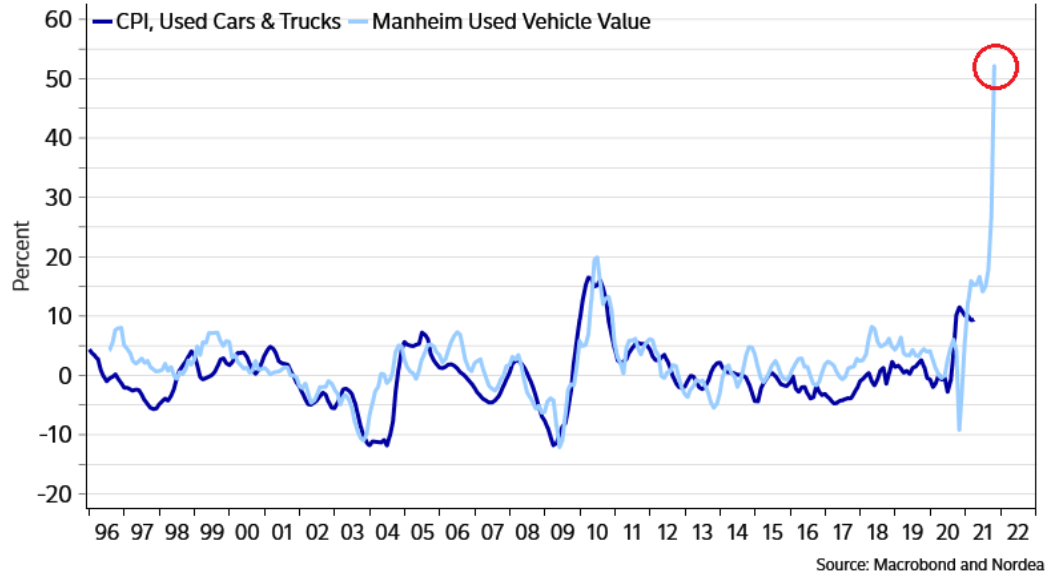 To explain, the light blue line above tracks the Manheim Used Vehicle Index, while the dark blue line above tracks the Used Cars and Trucks CPI (government-released data). And while it’s easy to see, please mind the monumental gap on the right side of the chart. Thus, with Powell changing his tune from not seeing any “unwelcome” inflation on Jan. 14 to “we are likely to see upward pressure on prices, but [it] will be temporary” on Apr. 28, can you guess where this story is headed next?
To that point, with the FED Chair committed to reverse-engineering a recovery, bond investors are increasingly looking like the fall guys. Case in point: by pumping up inflation expectations, Powell is essentially turning up the thermostat until the bond market finally revolts. Moreover, because buying more bonds in a bid to suppress interest rates will only increase the inflationary pressures, the FED’s gambit is quickly unraveling.
For context, I wrote on Jan. 15:
- If they let yields rise, the cost of borrowing rises, the cost of equity rises and the U.S. dollar is supported (all leading to shifts in the bond and stock markets and destroying the halcyon environment they worked so hard to create).
- To stop yields from rising, the U.S. Federal Reserve (FED) has to increase its asset purchases (and buy more bonds in the open market). However, the added liquidity should have the same net-effect because it increases inflation expectations, which a precursor to higher interest rates.
Furthermore, with inflation soaring and Powell unlikely to ramp-up bond purchases anytime soon (despite what he says, he likely understands the repercussions), he seems content to let long-term interest rates rise. And because of that, corporate bond fund managers have become increasingly anxious.
Please see below:
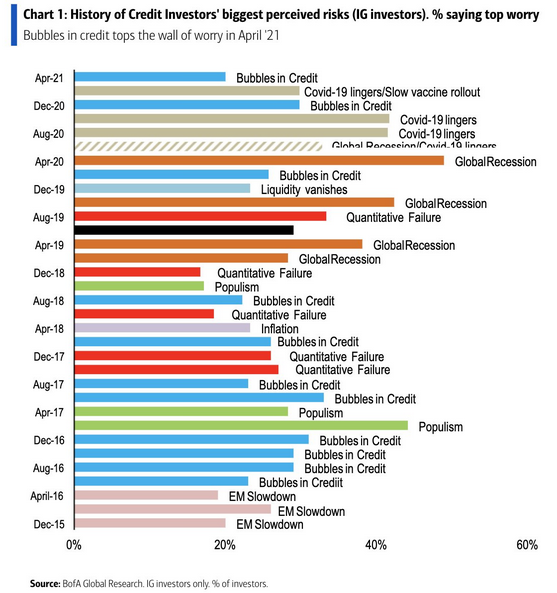
To explain, the above bars represent corporate bond fund managers’ greatest perceived risk (tallied as a percentage). And with the inflation story causing jitters in the Treasury market, corporate bond fund managers are worried (once again) about “bubbles” in the credit market.
As further evidence, investors’ belief in Powell’s ability to control interest rates has pushed the credit spread on CCC-rated corporate bonds to below 500 basis points (below 5%). More importantly, though, the last two times this occurred was before the dot-com bubble burst and in the lead-up to the 2008 Global Financial Crisis (GFC).
Please see below:
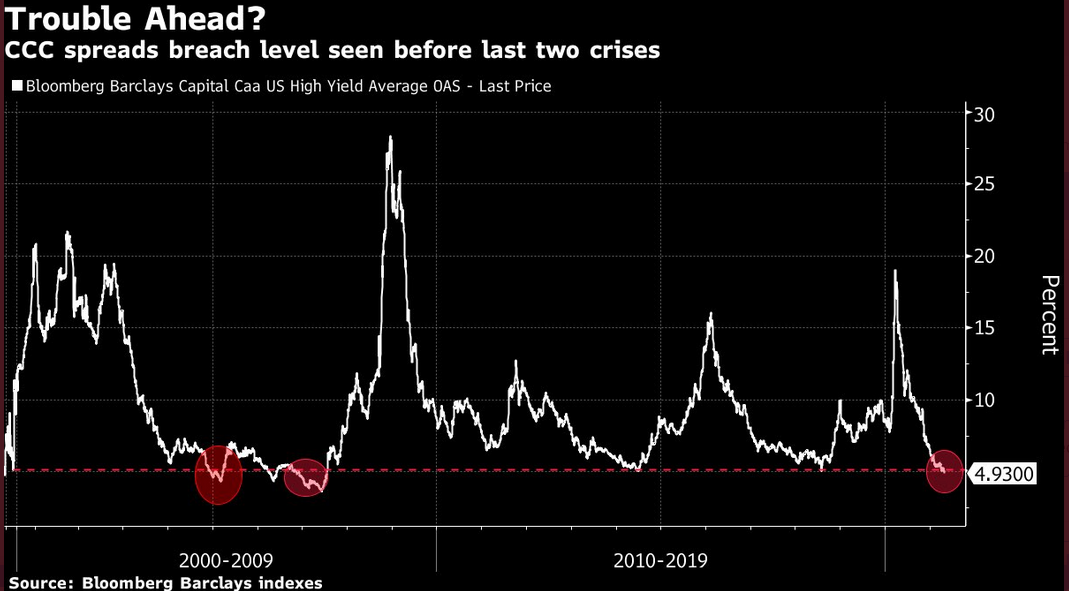
For context, Standard & Poor’s (S&P) classifies CCC-rated corporate bonds “as having significant speculative characteristics.” Furthermore, the U.S. ratings agency labels CCC companies as “dependent on favorable business, financial, and economic conditions.”
 Source: S&P Global Ratings
The bottom line?
With Powell dancing with the inflationary devil, the summer heat may sweat the FED chair into tapering his bond purchases and/or raising short-term interest rates. And if investors lose confidence in the FED Chair’s omniscience, look out below.
Who Believes the FED Chairman?
As an early warning sign, nearly 60% of economists surveyed by Bloomberg now believe that the FED will reduce its asset purchases – which Powell reaffirmed at $120 billion per month on Apr. 28 – by either the third or fourth quarter of 2021. For context, it’s a material shift, as economists originally believed that tapering was a 2022 event.
Please see below:
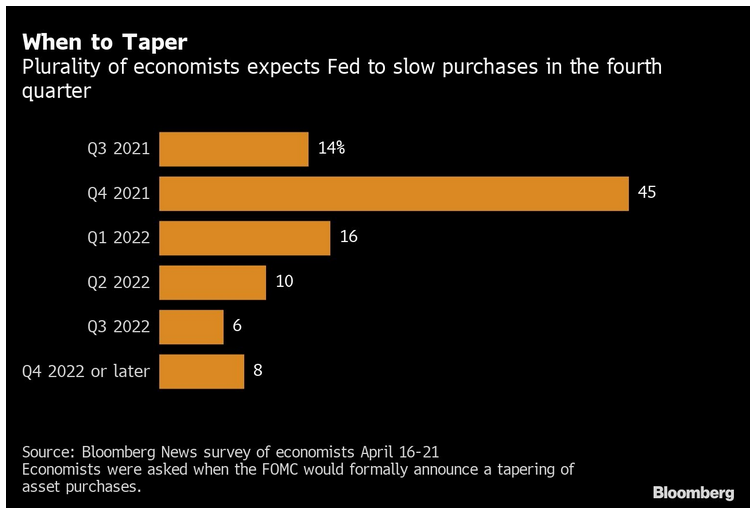
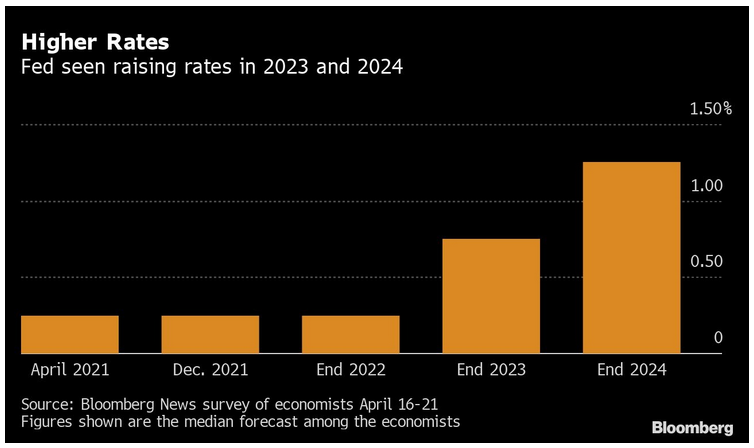
On the flip side, economists surveyed by Bloomberg still expect the FED to hold off on raising interest rates until sometime in 2023.
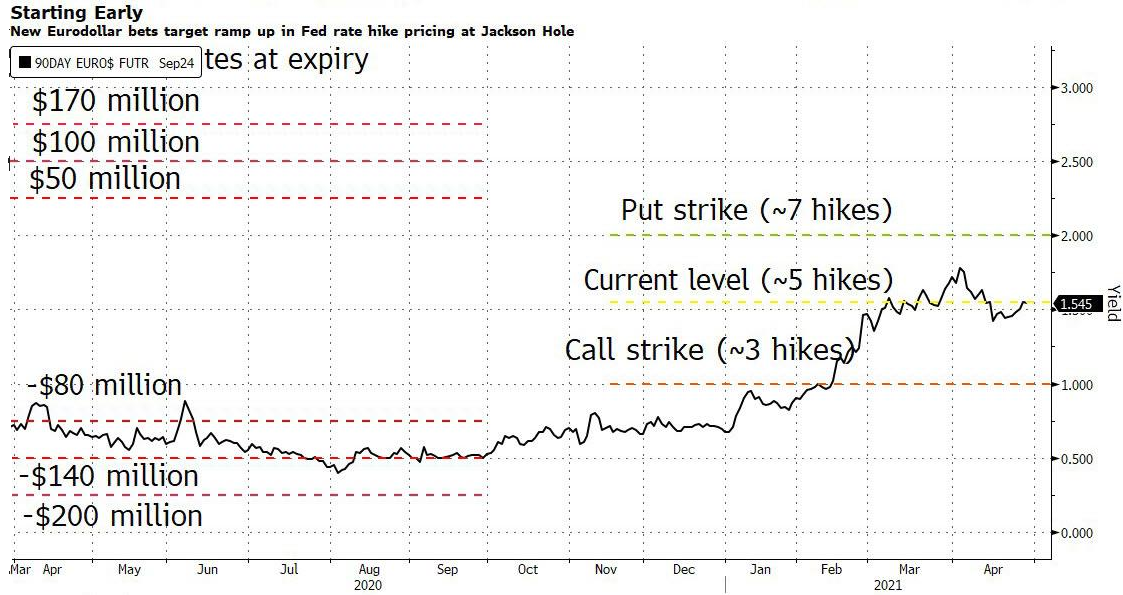
However, with the inflationary pressures building and the writing largely on the wall, a material Eurodollar options position signals that a hawkish shift could occur by late August. Case in point: with the options bet expiring on Sep. 10 – right before the FED’s Sep. 22 policy meeting – the date is rather peculiar. But with the FED’s annual Jackson Hole Symposium held in late August – where Powell unveiled a new policy framework for inflation in 2020 and then-FED Chair Ben Bernanke teased more bond purchases in 2012 – this year’s event could result in similar fireworks.
Please see below:
 Source: ZeroHedge
To explain, Eurodollar futures and options are used to speculate on short-term interest rates. More specifically, the contract reflects the implied 3-month U.S. dollar LIBOR (London Interbank Offered Rate). And with Eurodollar futures currently implying roughly five rate hikes by the FED by Mar. 2024 (contract settled at 98.7700 on Apr. 29), the large trader bought Eurodollar put options that imply roughly seven rate hikes by the FED by 2024 and sold Eurodollar put options that imply roughly three rate hikes by the FED by 2024. As a result, the "extremely high conviction" trade could be a $60 million windfall if Eurodollar futures fall sharply by Sept. 10.
The bottom line?
While speculation in the options market is nothing new, with inflation soaring and the FED denying, history has shown that central bankers often miss the forest through the trees (see Bernanke’s quote from 2007 within the Apr. 29 Gold & Silver Trading Alert).
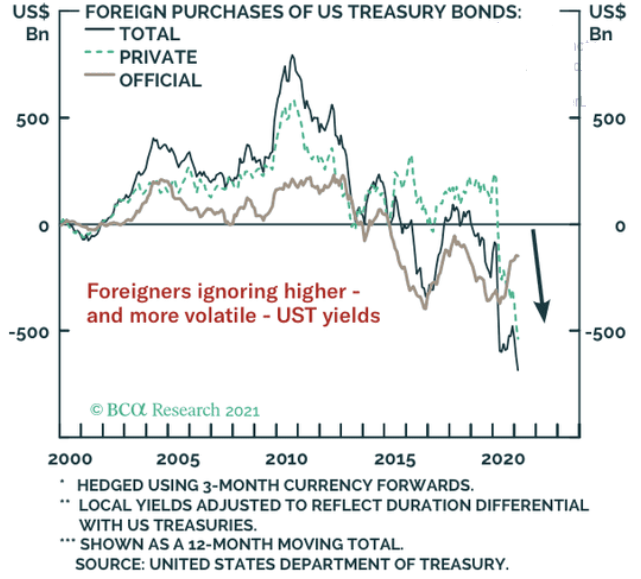
Sensing that something is amiss, while the U.S. 10-Year Treasury yield has moved higher in recent days, foreign investors remain net-sellers along the Treasury curve. Why so? Well, apparently the relative attractiveness of higher U.S. Treasury yields remains far from high enough.
Please see below:
Commodity Trading Advisors’ Insights
If that wasn’t enough, Commodity Trading Advisors (CTAs) are still positioned for a higher U.S. 10-Year Treasury yield. For context, CTAs manage professional futures portfolios and often employ computer-driven (quant) strategies in their attempts to deliver alpha.
Please see below:
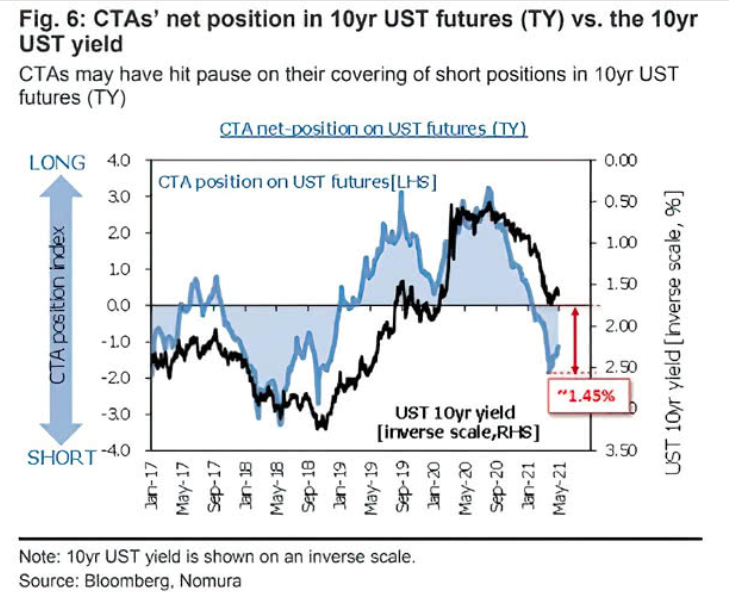
To explain, the light blue line above tracks CTAs’ net positioning, while the black line above tracks the inverted U.S. 10-Year Treasury yield. For context, inverted means that the latter’s scale is flipped upside down, and that a falling black line represents a rising U.S. 10-Year Treasury yield and that a rising black line represents a falling U.S. 10-Year Treasury yield. More importantly, though, while CTAs are no longer covering their short positions in the U.S. 10-Year Treasury (which moves inversely of the yield), both the blue and the black line still have plenty of room to move lower.
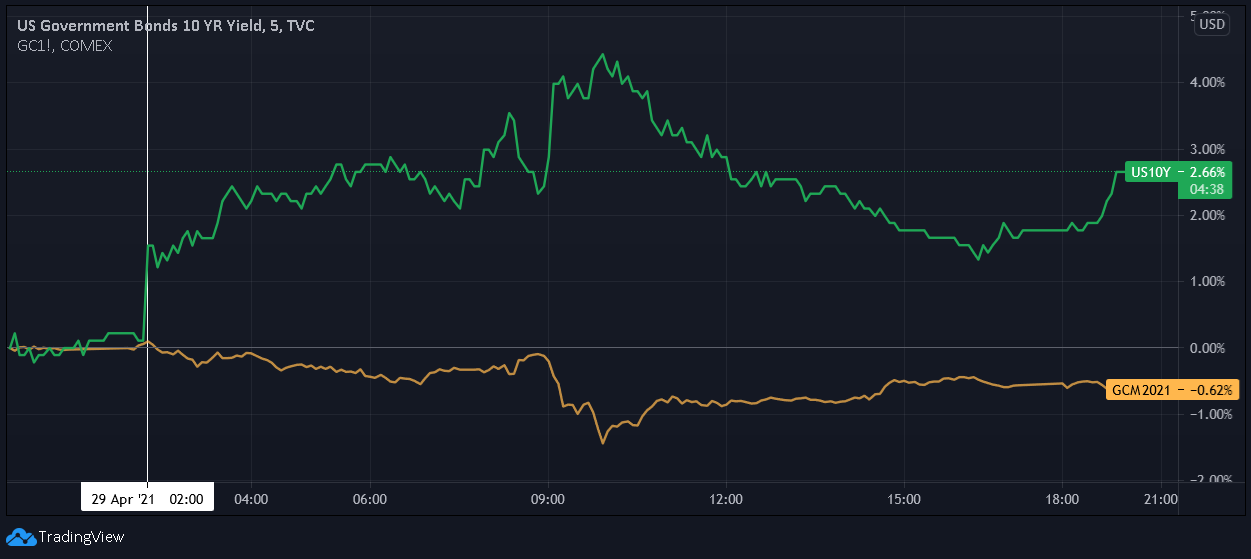
And why is the behavior of the U.S. 10-Year Treasury yield so important?
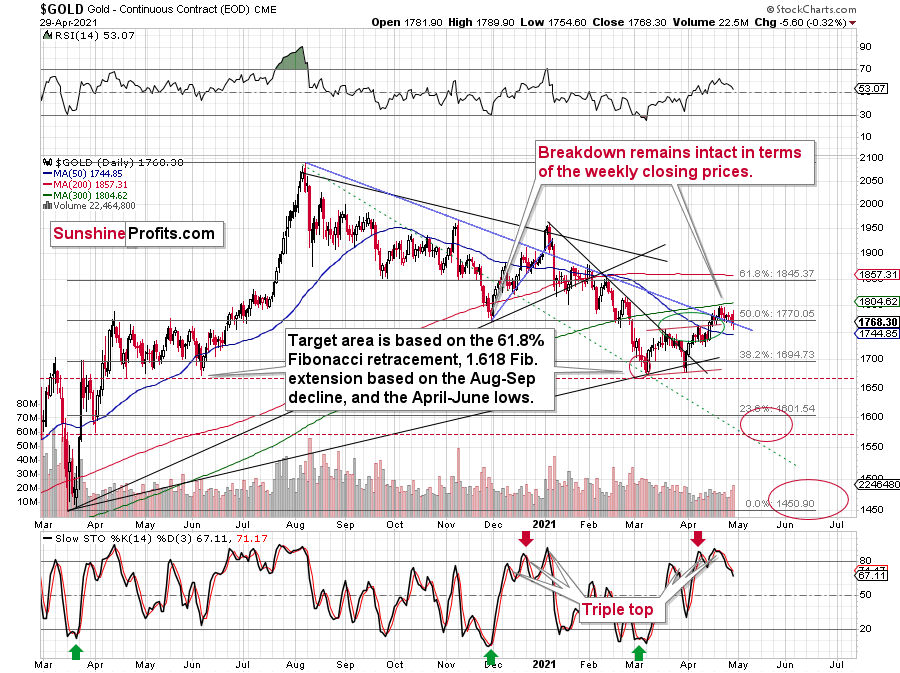
Well, as I’ve highlighted on several occasions, gold and the U.S. 10-Year Treasury yield have a strong negative correlation. If you analyze the chart below, you can see that while both variables were rather volatile on Apr. 29, the yellow metal is not a fan of a rising U.S. 10-Year Treasury yield.
In conclusion, with Powell’s playbook running out of X’s and O’s, the FED Chair is essentially daring the bond market to capitulate. Additionally, by endorsing speculation by refusing to reduce excess liquidity, whether it’s a slow burn or an epic climax, a higher U.S. 10-Year Treasury yield remains the path of least resistance. Moreover, while a severe correction of U.S. equities would likely derail the U.S. 10-Year Treasury yield’s upward momentum, the resulting surge in the USD Index would be just as damaging to the PMs. As a result, their medium-term outlook remains profoundly bearish and lower prices are likely in store before the PMs find a lasting bottom.
Overview of the Upcoming Part of the Decline
- It seems likely to me that the corrective upswing was already completed . Consequently, it seems that the next big move lower is already underway.
- After miners slide once again in a meaningful and volatile way, but silver doesn’t (and it just declines moderately), I plan to switch from short positions in miners to short positions in silver (this could take another 1-2 weeks to materialize). I plan to exit those short positions when gold shows substantial strength relative to the USD Index, while the latter is still rallying. This might take place with gold close to $1,450 - $1,500 and the entire decline (from above $1,700 to about $1,475) would be likely to take place within 1-12 weeks, and I would expect silver to fall hardest in the final part of the move. This moment (when gold performs very strongly against the rallying USD and miners are strong relative to gold – after gold has already declined substantially) is likely to be the best entry point for long-term investments, in my view. This might happen with gold close to $1,475, but it’s too early to say with certainty at this time. In other words, the entire decline could take between 1 and 12 weeks, with silver declines occurring particularly fast in the final 1-2 weeks.
- If gold declines even below $1,500 (say, to ~$1350 or so), then it could take another 10 weeks or so for it to bottom, but this is not what I view as a very likely outcome.
- As a confirmation for the above, I will use the (upcoming or perhaps we have already seen it?) top in the general stock market as the starting point for the three-month countdown. The reason is that after the 1929 top, gold miners declined for about three months after the general stock market started to slide. We also saw some confirmations of this theory based on the analogy to 2008. All in all, the precious metals sector would be likely to bottom about three months after the general stock market tops. If the mid-February 2020 top was the final medium-term top (based on NASDAQ’s top, then it seems that we might expect the precious metals sector to bottom in mid-May or close to May’s end. If, however, the upcoming (unless we just saw one) top in the S&P 500 is the key one, then it seems that we’re at least ~3 months from the final bottom.
- The above is based on the information available today, and it might change in the following days/weeks.
Please note that the above timing details are relatively broad and “for general overview only” – so that you know more or less what I think and how volatile I think the moves are likely to be – on an approximate basis. These time targets are not binding or clear enough for me to think that they should be used for purchasing options, warrants or similar instruments.
Letters to the Editor
Q: Is gold the only good investment in the Kondratiev cycle? Other things are not a good investment? Will you be recommending to us which gold stocks to buy or will you just tell us when the next bull market in gold begins, and we will have to select our own gold stocks? I have read many other articles saying the new gold bull market has begun, but I trust you more, so I am going to wait.
A: Thank you for your trust. Theoretically, in the Kondratiev Winter, the best performing assets are gold, cash, and bonds (after the credit crunch). While I’m still leaning toward the interpretation of the cycle that we’re about to enter the K-Winter, it’s also possible that we’re actually about to enter the Summer. Stocks top at the end of Autumn but also at the end of Spring. Precious metals are great investments during the K-Summer as well, along with other precious metals, commodities and real estate. The best thing about this uncertainty with regard to this cycle is that no matter which one is about to start – Summer or Winter, the implications for our investment and trading positions are alike, as falling stocks are still likely to initially take PMs with them – just like they did in 2020.
As far as gold stock selection is concerned, we’re providing two tools for that, based on algorithms I designed years ago (which continue to be useful today): Golden StockPicker and Silver StockPicker. They focus on selecting the mining stocks that are likely to provide the biggest bang for the buck (they were originally called “Leverage Calculators”). In the following months, we might be joined by more authors that specialize in gold miners and silver miners, so if you don’t want to follow algorithm’s the suggestions, but rather someone’s with personal reputation (with regard to mining stock selection), then it will likely be possible in the not-too-distant future.
Q: Beautiful analysis by PR as ever. I have a question in regard to DXY. Given his bearish narrative on Gold and its high correlation with DXY, I went long on DXY at 91.90 with 8 contracts which unfortunately is going against me. Despite good economic news and the 10-year yield inching higher, albeit at a slower speed, the US Dollar is ignoring it and moving further south. Can I please seek some guidance on how much further DXY can move down as I am reaching closer to my margin call, which is a nightmare?
A: Thank you – I’m very happy that you think highly of my analytical work. It’s a tough call to make with regard to the USD Index. It already fell more than I had been expecting it to. If we had positions in the USD Index, I would have likely entered a stop loss above the current price levels, and we would already be out of positions by now. And, in fact, I would be looking to re-enter them as soon as the USD Index confirms the breakout above the declining resistance line. At the moment of writing these words, the USDX is already trading back above this line, so the only thing that it needs to do now is to stay there. Still, given today’s pre-market movement, it seems that we might even see an invalidation of the move below the 61.8% Fibonacci retracement. A weekly close above both levels would be very bullish for the short term and a sign for me to get back to the long positions.
But – that is all based on the assumption that I would want to have any position in the USDX. And I don’t because I think that having a short position in mining stocks provides a much better risk-to-reward ratio. The list of factors below the GDXJ chart above provides more details.
Please note that the above are my general thoughts about the market – not an investment advice directed to any single individual.
Summary
To summarize, the PMs’ medium-term decline is well underway, and based on the recent performance of the USD Index, gold and mining stocks, it seems that the corrective upswing is close to being over. In fact, it seems very likely that it ended last week. Even if it didn’t (which seems relatively unlikely but still possible), the key thing here is that the really big move seems very close to starting, and when it does start, the recent upswing will likely seem to have been nothing more than a blip on the radar screen.
In addition, because we’re likely entering the “winter” part of the Kondratiev cycle (just like in 1929 and then the 1930s), the outlook for the precious metals’ sector remains particularly bearish during the very first part of the cycle, when cash is king.
The confirmed breakout in the USD Index is yet another confirmation of the bearish outlook for the precious metals market.
After the sell-off (that takes gold to about $1,450 - $1,500), we expect the precious metals to rally significantly. The final part of the decline might take as little as 1-5 weeks, so it's important to stay alert to any changes.
Most importantly, please stay healthy and safe. We made a lot of money last March and this March and it seems that we’re about to make much more on the upcoming decline, but you have to be healthy to enjoy the results.
As always, we'll keep you - our subscribers - informed.
By the way, we’re currently providing you with a possibility to extend your subscription by a year, two years or even three years with a special 20% discount. This discount can be applied right away, without the need to wait for your next renewal – if you choose to secure your premium access and complete the payment upfront. The boring time in the PMs is definitely over and the time to pay close attention to the market is here. Naturally, it’s your capital, and the choice is up to you, but it seems that it might be a good idea to secure more premium access now, while saving 20% at the same time. Our support team will be happy to assist you in the above-described upgrade at preferential terms – if you’d like to proceed, please contact us.
To summarize:
Trading capital (supplementary part of the portfolio; our opinion): Full speculative short positions (300% of the full position) in mining stocks are justified from the risk to reward point of view with the following binding exit profit-take price levels:
Mining stocks (price levels for the GDXJ ETF): binding profit-take exit price: $24.12; stop-loss: none (the volatility is too big to justify a stop-loss order in case of this particular trade)
Alternatively, if one seeks leverage, we’re providing the binding profit-take levels for the JDST (2x leveraged) and GDXD (3x leveraged – which is not suggested for most traders/investors due to the significant leverage). The binding profit-take level for the JDST: $39.87; stop-loss for the JDST: none (the volatility is too big to justify a SL order in case of this particular trade); binding profit-take level for the GDXD: $94.87; stop-loss for the GDXD: none (the volatility is too big to justify a SL order in case of this particular trade).
For-your-information targets (our opinion; we continue to think that mining stocks are the preferred way of taking advantage of the upcoming price move, but if for whatever reason one wants / has to use silver or gold for this trade, we are providing the details anyway.):
Silver futures upside profit-take exit price: unclear at this time - initially, it might be a good idea to exit, when gold moves to $1,512.
Gold futures upside profit-take exit price: $1,512.
Long-term capital (core part of the portfolio; our opinion): No positions (in other words: cash
Insurance capital (core part of the portfolio; our opinion): Full position
Whether you already subscribed or not, we encourage you to find out how to make the most of our alerts and read our replies to the most common alert-and-gold-trading-related-questions.
Please note that we describe the situation for the day that the alert is posted in the trading section. In other words, if we are writing about a speculative position, it means that it is up-to-date on the day it was posted. We are also featuring the initial target prices to decide whether keeping a position on a given day is in tune with your approach (some moves are too small for medium-term traders, and some might appear too big for day-traders).
Additionally, you might want to read why our stop-loss orders are usually relatively far from the current price.
Please note that a full position doesn't mean using all of the capital for a given trade. You will find details on our thoughts on gold portfolio structuring in the Key Insights section on our website.
As a reminder - "initial target price" means exactly that - an "initial" one. It's not a price level at which we suggest closing positions. If this becomes the case (like it did in the previous trade), we will refer to these levels as levels of exit orders (exactly as we've done previously). Stop-loss levels, however, are naturally not "initial", but something that, in our opinion, might be entered as an order.
Since it is impossible to synchronize target prices and stop-loss levels for all the ETFs and ETNs with the main markets that we provide these levels for (gold, silver and mining stocks - the GDX ETF), the stop-loss levels and target prices for other ETNs and ETF (among other: UGL, GLL, AGQ, ZSL, NUGT, DUST, JNUG, JDST) are provided as supplementary, and not as "final". This means that if a stop-loss or a target level is reached for any of the "additional instruments" (GLL for instance), but not for the "main instrument" (gold in this case), we will view positions in both gold and GLL as still open and the stop-loss for GLL would have to be moved lower. On the other hand, if gold moves to a stop-loss level but GLL doesn't, then we will view both positions (in gold and GLL) as closed. In other words, since it's not possible to be 100% certain that each related instrument moves to a given level when the underlying instrument does, we can't provide levels that would be binding. The levels that we do provide are our best estimate of the levels that will correspond to the levels in the underlying assets, but it will be the underlying assets that one will need to focus on regarding the signs pointing to closing a given position or keeping it open. We might adjust the levels in the "additional instruments" without adjusting the levels in the "main instruments", which will simply mean that we have improved our estimation of these levels, not that we changed our outlook on the markets. We are already working on a tool that would update these levels daily for the most popular ETFs, ETNs and individual mining stocks.
Our preferred ways to invest in and to trade gold along with the reasoning can be found in the how to buy gold section. Furthermore, our preferred ETFs and ETNs can be found in our Gold & Silver ETF Ranking.
As a reminder, Gold & Silver Trading Alerts are posted before or on each trading day (we usually post them before the opening bell, but we don't promise doing that each day). If there's anything urgent, we will send you an additional small alert before posting the main one.
Thank you.
Przemyslaw Radomski, CFA
Founder, Editor-in-chief

