

Briefly: in our opinion, full (300% of the regular position size) speculative short positions in mining stocks are justified from the risk/reward point of view at the moment of publishing this Alert.
The most bearish development for gold came from… the NASDAQ. And no, these are not six typos in a row. Let me explain.
The tech stocks were the strongest part of the stock market in the previous year or so, and for a good reason. Due to the lockdown-induced surge in remote work, the need for all sorts of tech improvements (in both: software and hardware) soared. So, it’s no wonder that the NASDAQ was the strongest part of the market. It was the sole leader.
Now, there’s a rule in every market that leaders… Well, lead. This makes perfect sense, no surprise yet. But, there’s a point after which the leaders stop leading and stocks that are relatively weak or have less favorable fundamentals are catching up, eventually rallying more than the leaders. Why would this be the case? Because those who understand the markets and what’s going on are already invested, and those who are neither as knowledgeable nor experienced – the investment public – enter the market.
The investment public makes purchases often without any regard to fundamentals (or technicals) – they buy because a given asset seems cheap compared to other assets. And what would be cheap in the final part of the upswing – after the market professionals have already established their positions in well-positioned assets? The poorly positioned assets. The stocks/markets that were – for a good reason – neglected previously. So, they start buying those, and the laggards become the new leaders.
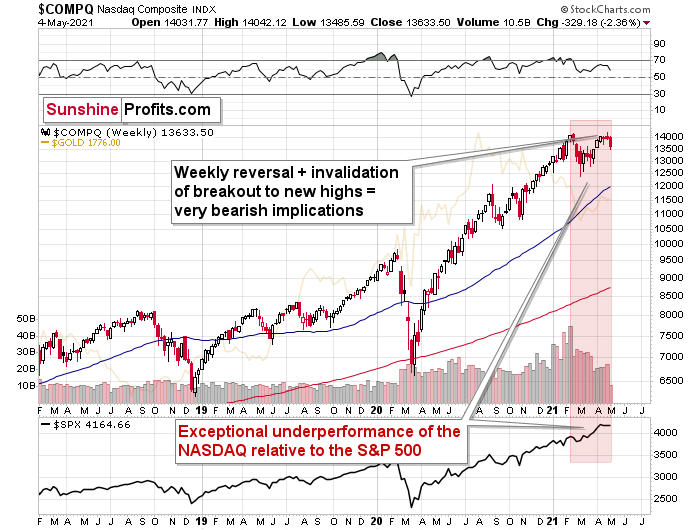
The NASDAQ was the leader that started to underperform while other stocks soared. The last few months were as clear as it gets in terms of emphasizing that. While the S&P 500 Index soared to new all-time highs, the only thing that the tech stocks managed to do was to attempt to break to new highs.
Attempt.
And fail.
Last week’s shooting-star-shaped weekly reversal was bearish on its own, but considering that it was also a failure to break to new highs, the bearish fire got gasoline poured over it.
Now, this could have been accidental, and it was prudent to wait for another decline before stating that the top in the stock market is most likely in…
Until we saw yesterday’s slide. The NASDAQ is already over 2% lower this week, and it’s only after two sessions.
Why is this important? Because if we have indeed seen a major top on the stock market, then it tells us a lot about the next moves on the precious metals market. And – in particular – about mining stocks.
The history might not repeat itself, but it does rhyme, and those who insist on ignoring it are doomed to repeat it.
And there’s practically only one situation from more than the past four decades that is similar to what we see right now.
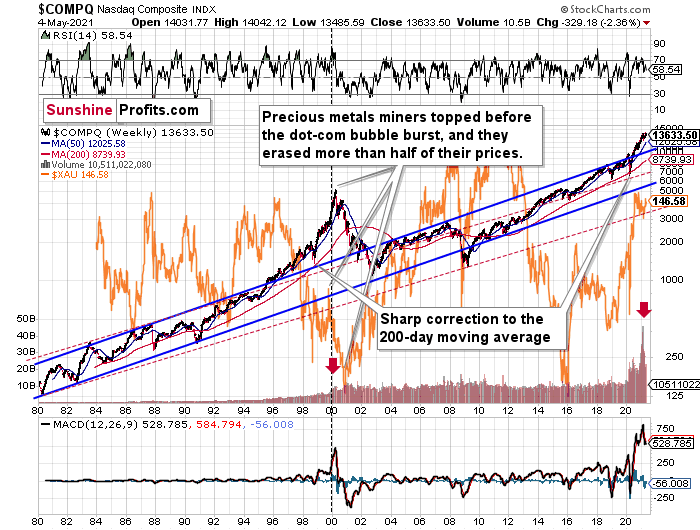
It’s the early 2000s when the tech stock bubble burst. It’s practically the only time when the tech stocks were after a similarly huge rally. It’s also the only time when the weekly MACD soared to so high levels (we already saw the critical sell signal from it). It’s also the only comparable case with regard to the breakout above the rising blue trend channel. The previous move above it was immediately followed by a pullback to the 200-week moving average, and then the final – most volatile – part of the rally started. It ended on significant volume when the MACD flashed the sell signal. Again, we’re already after this point.
The recent attempt to break to new highs that failed seems to have been the final cherry on the bearish cake.
Why should I – the precious metals investor care?
Because of what happened in the XAU Index (a proxy for gold stocks and silver stocks) shortly after the tech stock bubble burst last time.
What happened was that the mining stocks declined for about three months after the NASDAQ topped, and then they formed their final bottom that started the truly epic rally. And just like it was the case over 20 years ago, mining stocks topped several months before the tech stocks.
Mistaking the current situation for the true bottom is something that is likely to make a huge difference in one’s bottom line. After all, the ability to buy something about twice as cheap is practically equal to selling the same thing at twice the price. Or it’s like making money on the same epic upswing twice instead of “just” once.
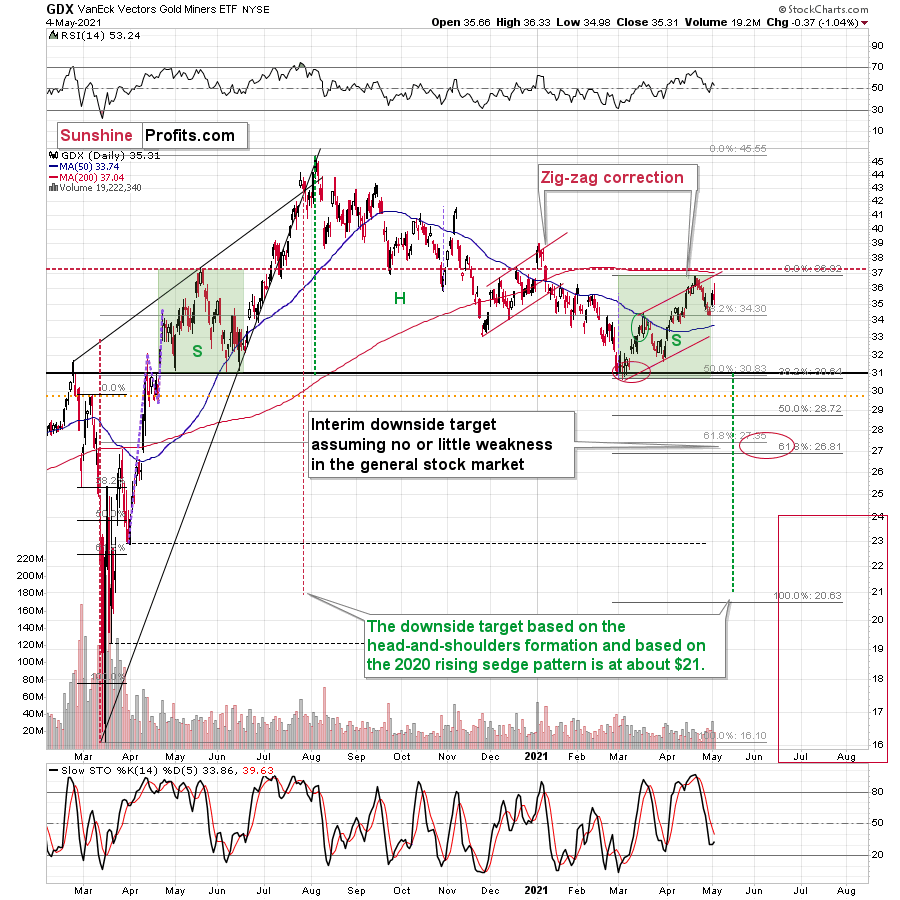
And why am I writing about “half” and “twice”? Because… I’m being slightly conservative, and I assume that the history is about to rhyme once again as it very often does (despite seemingly different circumstances in the world). The XAU Index declined from its 1999 high of 92.72 to 41.61 – it erased 55.12% of its price.
The most recent medium-term high in the GDX ETF (another proxy for mining stocks) was at about $45. Half of that is $22.5, so a move to this level would be quite in tune with what we saw recently.
And the thing is that based on this week’s slide in the NASDAQ that followed the weekly reversal and the invalidation, it seems that this slide lower has already begun.
Wait, you said something about three months?
Yes, that’s approximately how long we had to wait for the final buying opportunity in the mining stocks to present itself based on the stock market top.
The reason is that after the 1929 top, gold miners declined for about three months after the general stock market started to slide. We also saw some confirmations of this theory based on the analogy to 2008.
All in all, the precious metals sector would be likely to bottom about three months after the general stock market tops. If the last week’s highs in the S&P 500 and NASDAQ were the final highs, then we might expect the precious metals sector to bottom in the middle of the year – in late July or in August.
Yesterday’s clear reversal in the GDX and GDXJ ETFs clearly confirms the bearish outlook. Let’s see what it looked like.
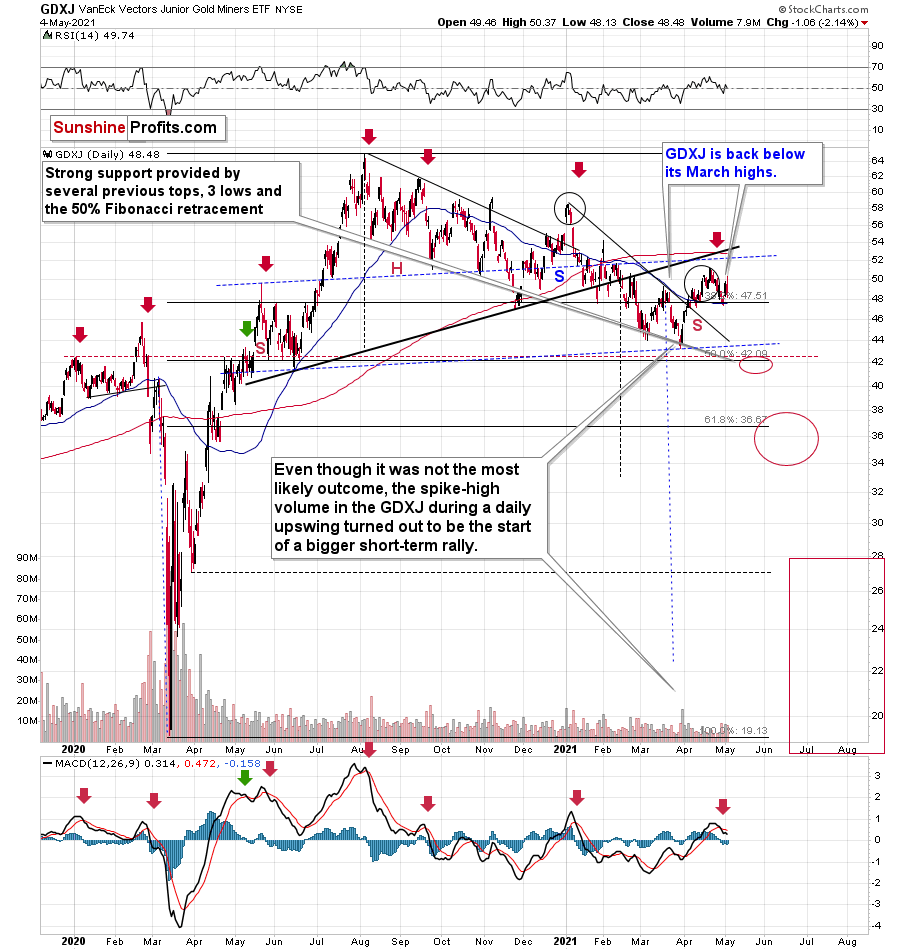
Senior and junior gold miners declined (juniors much more than seniors, just like they were likely to).
The reversal itself was profoundly bearish.
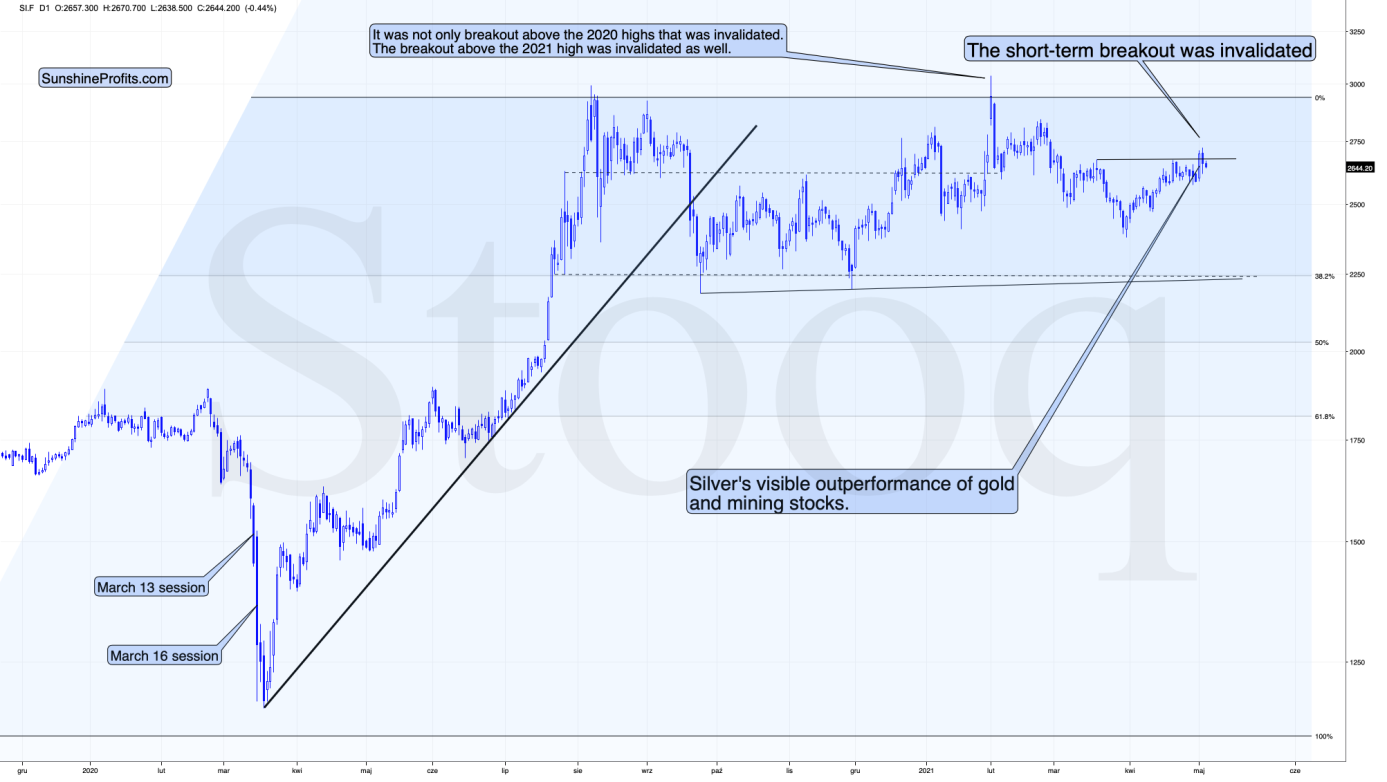
Silver even made another temporary attempt to break above the April highs before it became clear that it was not going to happen. We saw invalidation in terms of both: intraday and daily closing prices.
All the above happened right after silver’s very short-term outperformance of gold. The top seems to be in.
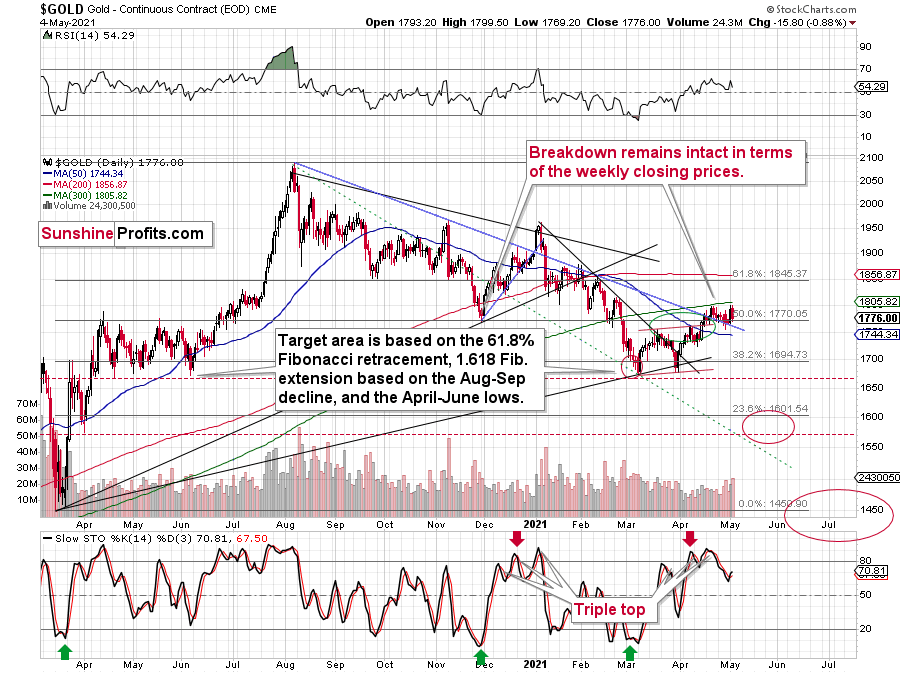
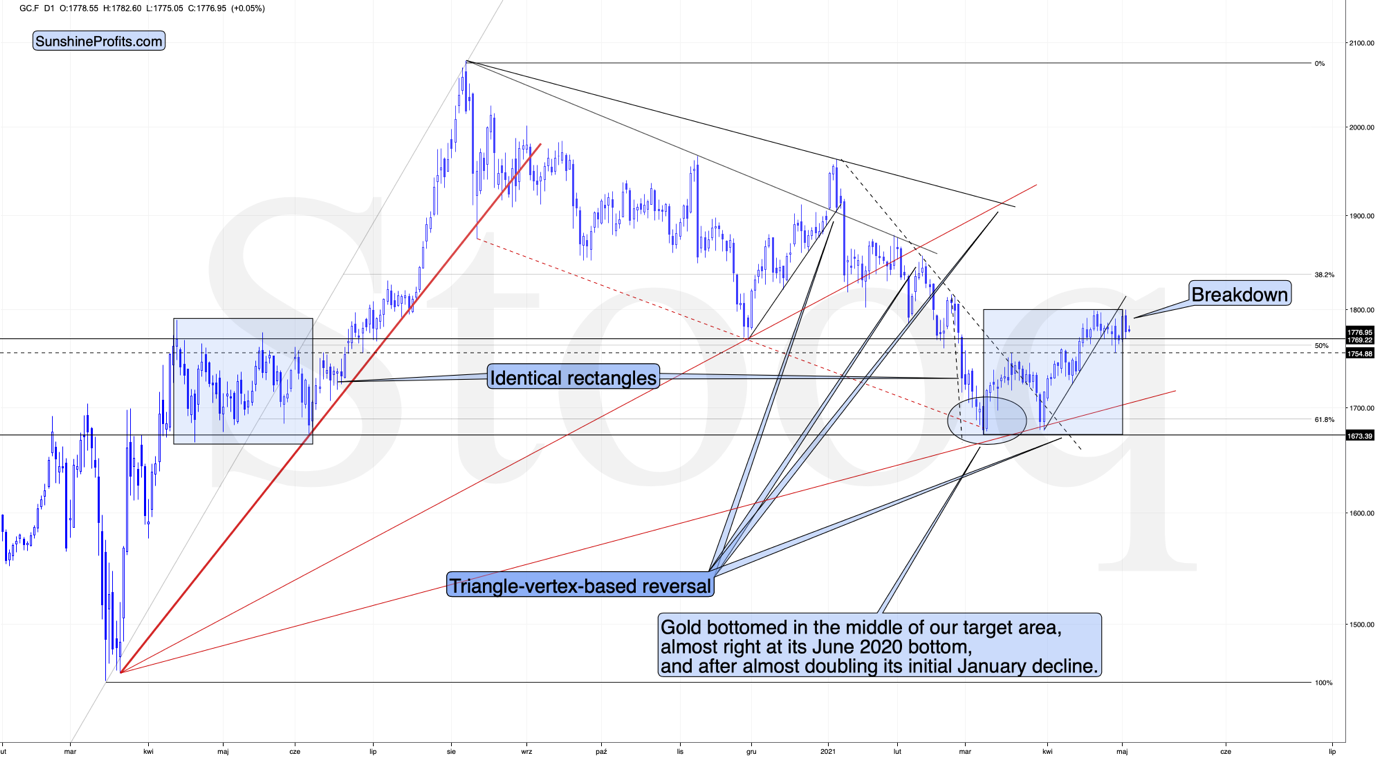
Gold moved slightly – ($1.10) – above its April high and then declined, invalidating this attempt. The $1,800 level and the 300-day moving average showed strong resistance once again.
The interesting – and important – thing about gold is that it moved lower (and invalidated the tiny breakout) on a big volume – bigger than what we saw throughout April. In fact, the price-volume link has bearish implications, as the volume on which gold rallied was lower than the volume on which gold has been declining recently.
In the pre-market trading, gold made another tiny attempt to move higher, and it’s now moving lower. The top seems to be in.
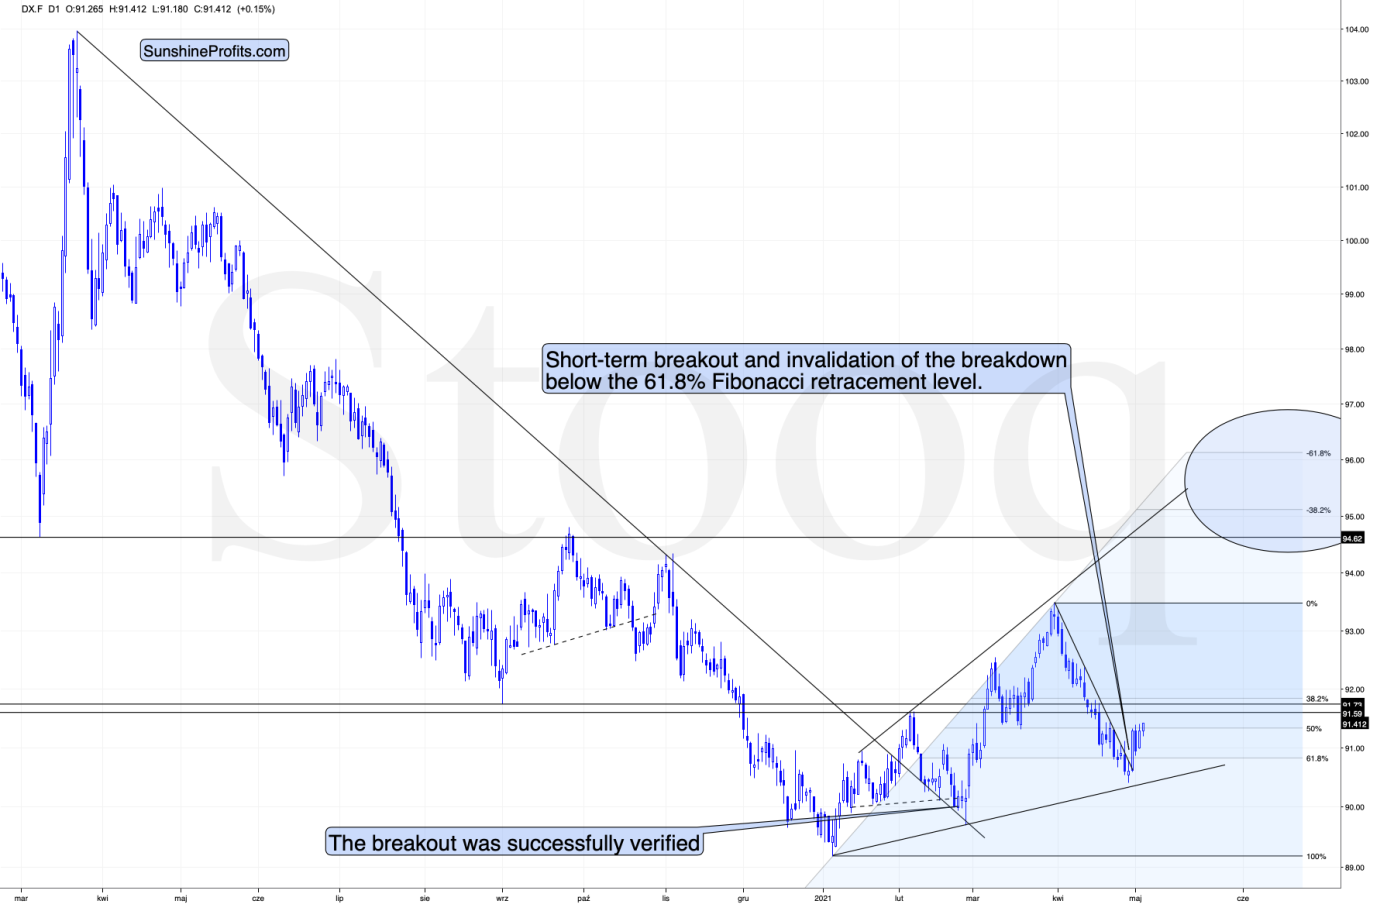
Moreover, the USD Index continues to move higher in today’s pre-market trading, so it seems that we’re about to see more declines in the PMs shortly.
Having said that, let’s take a look at the markets from a more fundamental angle.
Oh How the Tables Have Turned
(or, for The Office fans, “how the turntables…”)
For months, I’ve been warning that rampant inflation is a net negative for the PMs. With rising inflation, a precursor to higher interest rates, erratic responses from the bond market often leave the PMs with damaging whiplash. More importantly though, with the inflation surge becoming more and more ominous by the day, I warned on Apr. 30 that Jerome Powell, Chairman of the U.S. Federal Reserve (FED), remains materially behind the inflation curve.
I wrote:
With Powell changing his tune from not seeing any “unwelcome” inflation on Jan. 14 to “we are likely to see upward pressure on prices, but [it] will be temporary” on Apr. 28, can you guess where this story is headed next?
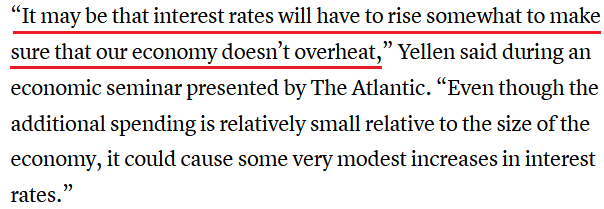
And while the man himself wasn’t the bearer of bad news, the U.S. Treasury Secretary Janet Yellen told an audience on May 4 what those of us who were paying attention already knew:
 Source: CNBC
More importantly, though, notice how she concluded with “very modest increases in interest rates?”
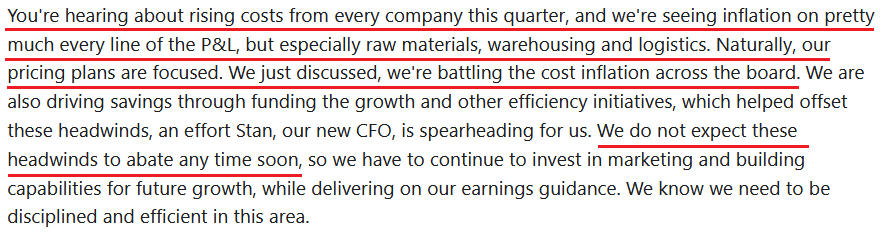
Highlighting their inability to comprehend the indirect effects of their policies, both Powell and Yellen fail to understand (or – much more likely – fail to admit) that the genie is already out of the bottle. Case in point: with the Commodity Producer Price Index (PPI) (released on Apr. 13) surging by 3.74% month-over-month (MoM) – the largest MoM percentage increase since July 1974 – cost-push inflation is already drowning businesses in the flood. As evidence, please have a look at what Colgate-Palmolive CEO Noel Wallace had to say during the company’s Q1 earnings call on Apr. 30:
 Source: Colgate-Palmolive/ The Motley Fool
On top of that, Warren Buffett – who held Berkshire Hathaway’s annual shareholder meeting on May 1 – said that “We’re seeing very substantial inflation.”
“I mean, we're raising prices. People are raising prices to us. And it's being accepted. It just won’t stop ….The costs are just up, up, up. Steel costs, you know, just every day, they're going up. And there hasn't yet been because the wage -- the wage stuff follows.”
Notice how he had to stop himself from sounding the alarm at the end?
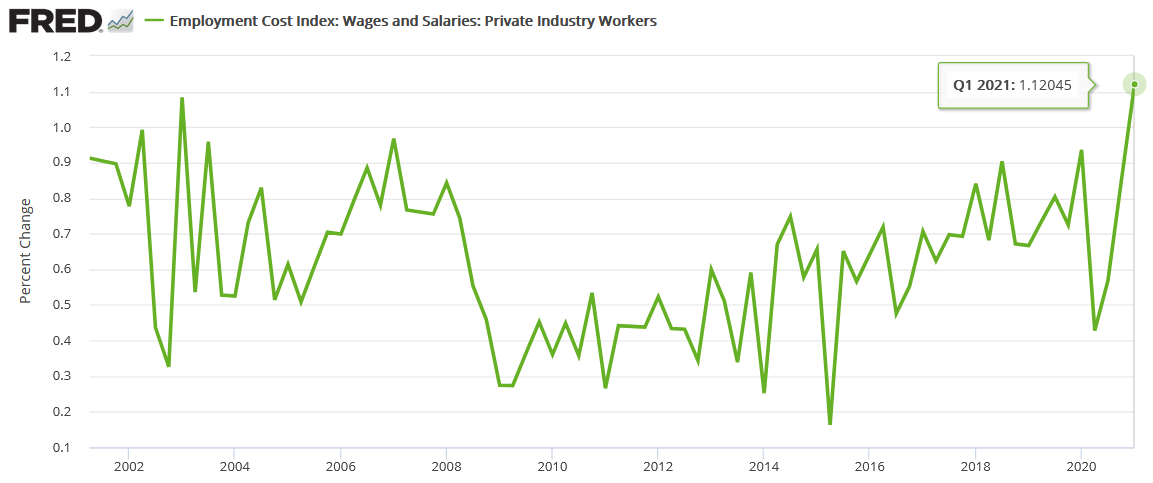
Released on Apr. 30, the U.S. Bureau of Labor Statistics (BLS) revealed that the Employment Cost Index (Wages and Salaries: Private Industry Workers) recorded its highest quarter-over-quarter (QoQ) percentage increase in its history.
Please see below:
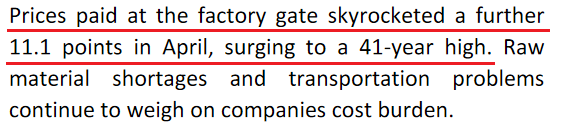
If that wasn’t enough, the Institute for Supply Management’s (ISM) Chicago Business Barometer (also released on Apr. 30) rose to 72.1 in April, the highest level since December 1983. And with “firms experiencing difficulties in getting certain components and raw materials,” can you guess what happened to their profit margins?
 Source: ISM Chicago Business Barometer
Commodity PPI vs Headline CPI
Furthermore, while Yellen’s solution of “very modest increases in interest rates” may be suitable for a “modest problem”, the ticking time bomb of cost-push inflation has already gone off. Case in point: while the commodity PPI increased by 3.74% MoM, the headline Consumer Price Index (CPI) – which includes the inflationary effects of food and energy – only increased by 0.62%.
Please see below:
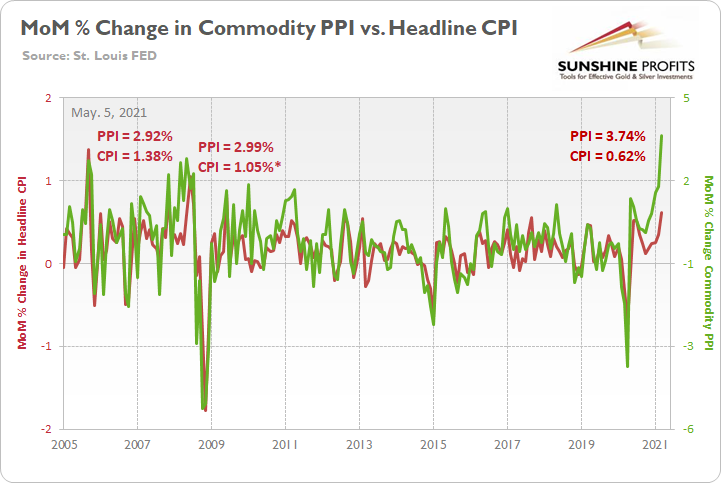
To explain, the green line above tracks the MoM percentage change in the commodity PPI, while the red line above tracks the MoM percentage change in the headline CPI. If you analyze the right side of the chart, you can see that a material gap has developed between the commodity PPI and the headline CPI. More importantly, though, if you analyze the left side of the chart, you can see that abnormal surges in the commodity PPI often coincide with abnormal surges in the headline CPI. For example, when the commodity PPI surged by 2.92% MoM in September 2005, the headline CPI jumped by 1.38%. Likewise, when the commodity PPI surged by 2.99% MoM in May 2008, the headline CPI rose by 1.05%* (one month later in June). And while a more than 1% MoM increase may seem rather modest, it’s important to remember that the headline CPI has only increased by more than 1% MoM twice since June 1982. As a result, with the match already lit, all Powell and Yellen can do is wait for the fire.
As further evidence, notice the strong correlation between year-over-year (YoY) percentage changes in the commodity PPI and the headline CPI?
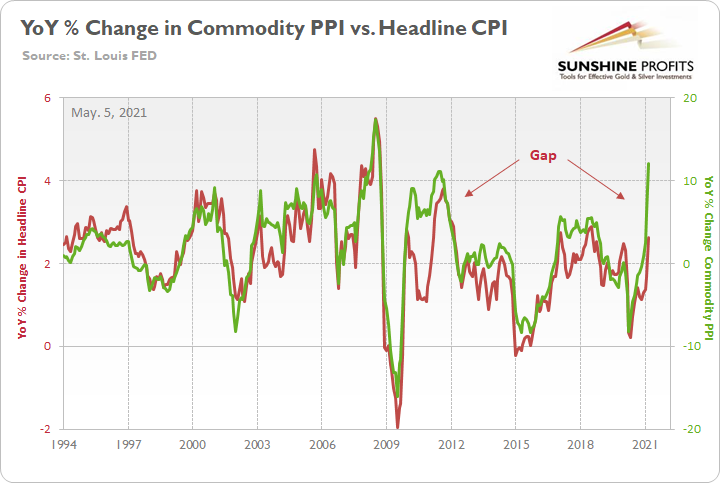
To explain, the green line above tracks the YoY percentage change in the commodity PPI, while the red line above tracks the YoY percentage change in the headline CPI. If you analyze the right side of the chart, you can see that a material gap is clearly visible. Moreover, when a similar divergence occurred following the Global Financial Crisis (GFC) in 2009, the headline CPI eventually followed the commodity PPI higher. Thus, if the former reconnects with the latter, it implies a ~4.5% YoY percentage increase in the headline CPI. More importantly, though, the headline CPI has only increased by 4.5% (or more) YoY in a month five times since 1991.
In addition, if you follow headline CPI’s surge off of the bottom in 2009, a pause ensued before the red line eventually ripped higher and reconnected with the commodity PPI in 2011. And while Powell believes that “base effects” will ensure a similar outcome this time, 2009 was an appetizer relative to the rampant speculation that is present in today’s commodities market. Case in point: the S&P Goldman Sachs Commodity Index (S&P GSCI) is racing well ahead of its 2009-2010 analogue.
Please see below:
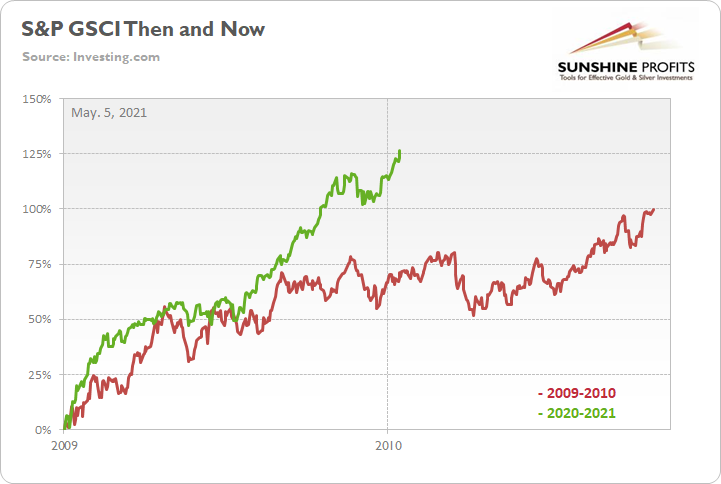
To explain, the green line above tracks the S&P GSCI’s current rally off of the bottom, while the red line above tracks the S&P GSCI’s rally off of the bottom in 2009-2010. For context, the S&P GSCI contains 24 commodities from all sectors: six energy products, five industrial metals, eight agricultural products, three livestock products and two precious metals. More importantly, though, notice how 2020-2021 has completely run away from 2009-2010? As evidence, back in 2009-2010, it took roughly 22 months for the S&P GSCI to double off of the bottom (increase by 100%). Conversely, in roughly 12 months, the S&P GSCI has already rallied by more than 126% since bottoming in late April 2020. The key takeaway? The impact of cost-push inflation is greater now than it was following the GFC.
Imbalances in Financial Markets
As further evidence, the J.P.Morgan Global Manufacturing PMI (released on May 3) rose to its highest level (55.8) since April 2010. For context, the survey tallies responses from roughly 13,500 companies in over 40 countries and accounts for 98% of global manufacturing value added.
Please see below:
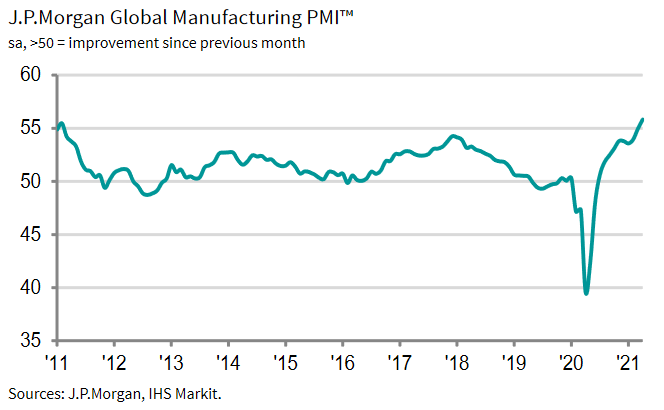
More importantly, though, notice a recurring theme?
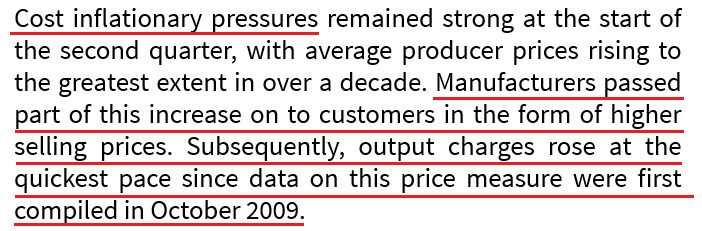 Sources: J.P.Morgan, IHS Markit
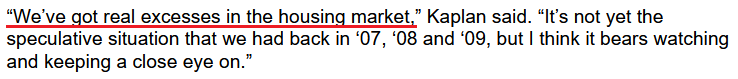
And because where there’s smoke there’s fire, Robert Kaplan, president of the Dallas FED, continues to voice his concerns over Powell’s inactivity. “We’re now at a point where I’m observing excesses and imbalances in financial markets,” he said on Apr. 30. “I’m very attentive to that, and that’s why I do think at the earliest opportunity I think [it] will be appropriate for us to start talking about adjusting those purchases.”
On top of that, he added:
 Source: Bloomberg
No, it’s nowhere near 2007, 2008 or 2009…
To explain, the blue line above tracks the YoY percentage change in U.S. housing prices. And while Powell will likely cry foul over “base effects”, as you can see, the 17% YoY increase is an all-time high.
The bottom line?
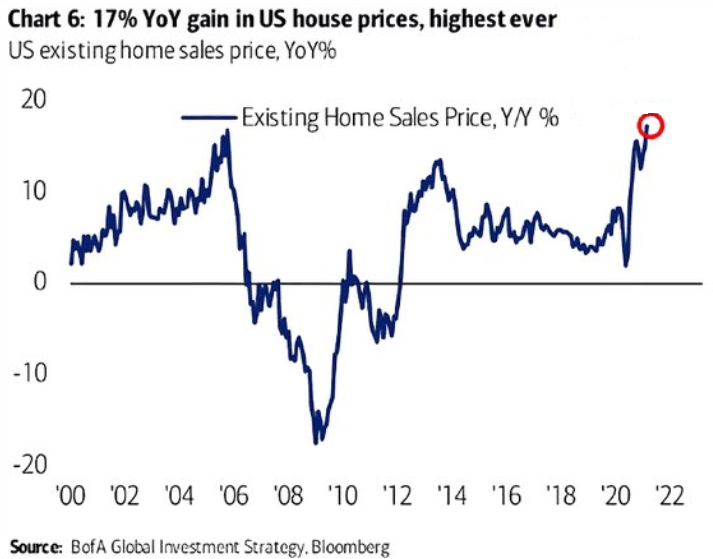
Central bankers now have a problem that money printing can’t solve. And with raging inflation likely to cause a sell-off in the bond market and/or the stock market (both are bearish for the PMs in the short and/or medium term), the former is likely the first shoe to drop. Case in point: short interest in the $12 billion iShares 20+ Year Treasury Bond ETF (TLT) just hit 25% – the highest level since early 2017.
Please see below:
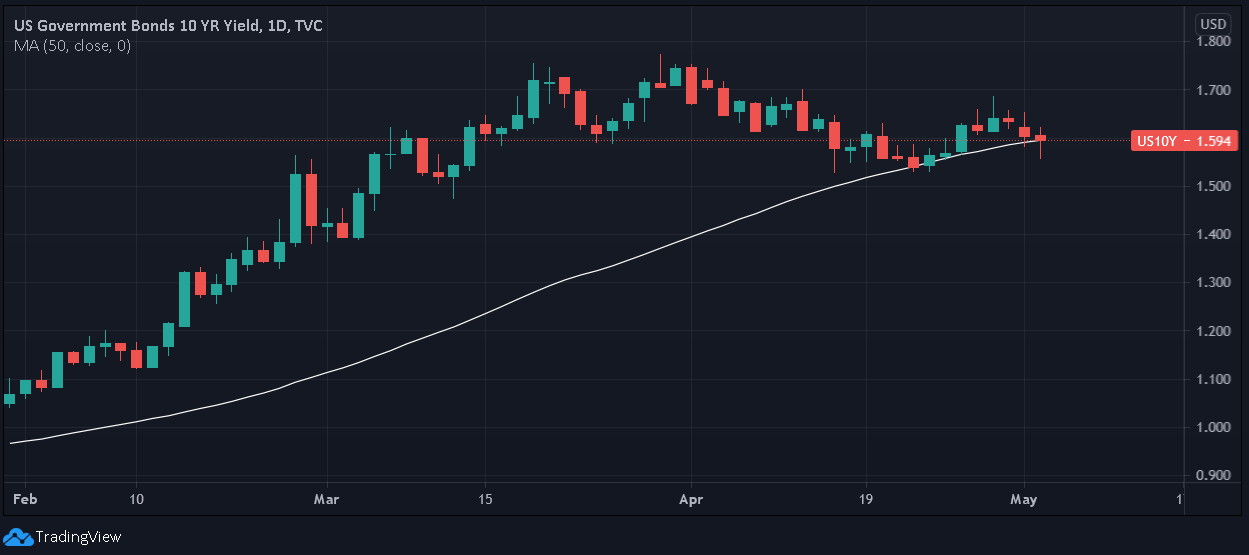
Moreover, with the U.S. 10-Year Treasury yield managing to close above its 50-day moving average on May 4 – despite the stock market sell-off causing a bid for safe-haven assets – higher interest rates remain the path of least resistance. Thus, absent a severe rout of U.S. equities – which would push down yields but result in a surge in the USD Index – it’s likely a matter of when, not if, the next bout of upward interest rate volatility occurs.
In conclusion, after more than a month of smooth sailing, a wave of volatility finally rocked the NASDAQ 100’s boat. And with the PMs often drowning in Big Tech’s sorrows, it was another reenactment on May 4. More importantly, though, with the USD Index bouncing hard and the U.S. 10-Year Treasury yield showcasing relative strength, the PMs remain on the defensive. Thus, with the inflation story moving from warm to hot, and even to sizzling, the PMs are liable to get burned over the medium term.
Overview of the Upcoming Part of the Decline
- It seems likely to me that the corrective upswing was already completed . Consequently, it seems that the next big move lower is already underway.
- After miners slide once again in a meaningful and volatile way, but silver doesn’t (and it just declines moderately), I plan to switch from short positions in miners to short positions in silver (this could take another 1-2 weeks to materialize). I plan to exit those short positions when gold shows substantial strength relative to the USD Index, while the latter is still rallying. This might take place with gold close to $1,450 - $1,500 and the entire decline (from above $1,700 to about $1,475) would be likely to take place within 1-12 weeks, and I would expect silver to fall hardest in the final part of the move. This moment (when gold performs very strongly against the rallying USD and miners are strong relative to gold – after gold has already declined substantially) is likely to be the best entry point for long-term investments, in my view. This might happen with gold close to $1,475, but it’s too early to say with certainty at this time. In other words, the entire decline could take between 1 and 12 weeks, with silver declines occurring particularly fast in the final 1-2 weeks.
- If gold declines even below $1,500 (say, to ~$1350 or so), then it could take another 10 weeks or so for it to bottom, but this is not what I view as a very likely outcome.
- As a confirmation for the above, I will use the (upcoming or perhaps we have already seen it?) top in the general stock market as the starting point for the three-month countdown. The reason is that after the 1929 top, gold miners declined for about three months after the general stock market started to slide. We also saw some confirmations of this theory based on the analogy to 2008. All in all, the precious metals sector would be likely to bottom about three months after the general stock market tops. If the last week’s highs in the S&P 500 and NASDAQ were the final highs, then we might expect the precious metals sector to bottom in the middle of the year – in late July or in August
- The above is based on the information available today, and it might change in the following days/weeks.
Please note that the above timing details are relatively broad and “for general overview only” – so that you know more or less what I think and how volatile I think the moves are likely to be – on an approximate basis. These time targets are not binding or clear enough for me to think that they should be used for purchasing options, warrants or similar instruments.
Letters to the Editor
Q: Gold tested 1800 for the third time this morning and retraced the move completely and is now negative. Have we now confirmed completely the resistance line of 1800 and that Gold will not exceed this value? On a personal note, I have been following your analysis on Gold for about a year. I have developed a level of confidence with you and have been pleased with the work. Thanks again for helping all of us.
A: I’m very happy to read that you think so highly of my work – thank you. As far as the $1,800 as unbreakable resistance is concerned, then it seems quite likely that gold won’t be able to break above the $1,800 before sliding profoundly, but I wouldn’t call it “certain”. Those engaging in gold day trading might want to use the level a few dollars above it as a stop-loss level, but I won’t be doing something like that with the current positions in the junior miners.
Q: I am glad to read your daily updates on the PMs market and that we are informed thanks to your newsletters - we are all lucky to have them.
I wanted to ask you some questions about one of your comments in today's Q&A section. You mentioned not being certain anymore if we are entering the winter part of the cycle, and we might be entering the summer part instead. You also mentioned the implications for stocks and gold are identical. So if gold is likely to perform very well but not initially, what are the PMs' consequences if we are entering summer instead? Based on your lecturing, I understand that until gold doesn't show relative strength with the $DXY, we haven't seen the bottom. But would entering the summer phase cause a shallow bottom instead of a deep one if this thesis is right? In case we were entering summer, would this change your projection of possible $1500 gold (or less)? And what needs to happen in the PMs market for you to be certain that we are entering the summer cycle?
Thanks for your time and dedication to your subscribers.
A: Thank you, I’m very happy that you enjoy the results of our work.
The short- and medium-term implications of both theories - K-Winter or K-Summer being upon us – are the same in my view as far as gold, silver and mining stocks are concerned. Actually, if it’s Summer that we’re about to enter, the implications, in the long run, would be more beneficial for silver – just like in the 1970s.
The downside targets, their timing, and the key thing that will help us determine the bottom (gold’s strength relative to the USD Index) are unaffected.
I will watch the inflation numbers for confirmation, and based on what we’re seeing right now, it’s getting more and more likely that it’s the Summer that we’re about to enter (or have already entered if stocks have just topped).
Summary
To summarize, the PMs’ medium-term decline is well underway and based on the recent performance of the USD Index, gold, and mining stocks, it seems that the corrective upswing is already over. The confirmed breakout in the USD Index is yet another confirmation of the bearish outlook for the precious metals market, and the same goes for the symmetric nature of the potential broad head-and-shoulders in gold and gold stocks.
After the sell-off (that takes gold to about $1,450 - $1,500), we expect the precious metals to rally significantly. The final part of the decline might take as little as 1-5 weeks, so it's important to stay alert to any changes.
Most importantly, please stay healthy and safe. We made a lot of money last March and this March, and it seems that we’re about to make much more on the upcoming decline, but you have to be healthy to enjoy the results.
As always, we'll keep you - our subscribers - informed.
By the way, we’re currently providing you with a possibility to extend your subscription by a year, two years or even three years with a special 20% discount. This discount can be applied right away, without the need to wait for your next renewal – if you choose to secure your premium access and complete the payment upfront. The boring time in the PMs is definitely over and the time to pay close attention to the market is here. Naturally, it’s your capital, and the choice is up to you, but it seems that it might be a good idea to secure more premium access now, while saving 20% at the same time. Our support team will be happy to assist you in the above-described upgrade at preferential terms – if you’d like to proceed, please contact us.
To summarize:
Trading capital (supplementary part of the portfolio; our opinion): Full speculative short positions (300% of the full position) in mining stocks are justified from the risk to reward point of view with the following binding exit profit-take price levels:
Mining stocks (price levels for the GDXJ ETF): binding profit-take exit price: $24.12; stop-loss: none (the volatility is too big to justify a stop-loss order in case of this particular trade)
Alternatively, if one seeks leverage, we’re providing the binding profit-take levels for the JDST (2x leveraged) and GDXD (3x leveraged – which is not suggested for most traders/investors due to the significant leverage). The binding profit-take level for the JDST: $39.87; stop-loss for the JDST: none (the volatility is too big to justify a SL order in case of this particular trade); binding profit-take level for the GDXD: $94.87; stop-loss for the GDXD: none (the volatility is too big to justify a SL order in case of this particular trade).
For-your-information targets (our opinion; we continue to think that mining stocks are the preferred way of taking advantage of the upcoming price move, but if for whatever reason one wants / has to use silver or gold for this trade, we are providing the details anyway.):
Silver futures upside profit-take exit price: unclear at this time - initially, it might be a good idea to exit, when gold moves to $1,512.
Gold futures upside profit-take exit price: $1,512.
Long-term capital (core part of the portfolio; our opinion): No positions (in other words: cash
Insurance capital (core part of the portfolio; our opinion): Full position
Whether you already subscribed or not, we encourage you to find out how to make the most of our alerts and read our replies to the most common alert-and-gold-trading-related-questions.
Please note that we describe the situation for the day that the alert is posted in the trading section. In other words, if we are writing about a speculative position, it means that it is up-to-date on the day it was posted. We are also featuring the initial target prices to decide whether keeping a position on a given day is in tune with your approach (some moves are too small for medium-term traders, and some might appear too big for day-traders).
Additionally, you might want to read why our stop-loss orders are usually relatively far from the current price.
Please note that a full position doesn't mean using all of the capital for a given trade. You will find details on our thoughts on gold portfolio structuring in the Key Insights section on our website.
As a reminder - "initial target price" means exactly that - an "initial" one. It's not a price level at which we suggest closing positions. If this becomes the case (like it did in the previous trade), we will refer to these levels as levels of exit orders (exactly as we've done previously). Stop-loss levels, however, are naturally not "initial", but something that, in our opinion, might be entered as an order.
Since it is impossible to synchronize target prices and stop-loss levels for all the ETFs and ETNs with the main markets that we provide these levels for (gold, silver and mining stocks - the GDX ETF), the stop-loss levels and target prices for other ETNs and ETF (among other: UGL, GLL, AGQ, ZSL, NUGT, DUST, JNUG, JDST) are provided as supplementary, and not as "final". This means that if a stop-loss or a target level is reached for any of the "additional instruments" (GLL for instance), but not for the "main instrument" (gold in this case), we will view positions in both gold and GLL as still open and the stop-loss for GLL would have to be moved lower. On the other hand, if gold moves to a stop-loss level but GLL doesn't, then we will view both positions (in gold and GLL) as closed. In other words, since it's not possible to be 100% certain that each related instrument moves to a given level when the underlying instrument does, we can't provide levels that would be binding. The levels that we do provide are our best estimate of the levels that will correspond to the levels in the underlying assets, but it will be the underlying assets that one will need to focus on regarding the signs pointing to closing a given position or keeping it open. We might adjust the levels in the "additional instruments" without adjusting the levels in the "main instruments", which will simply mean that we have improved our estimation of these levels, not that we changed our outlook on the markets. We are already working on a tool that would update these levels daily for the most popular ETFs, ETNs and individual mining stocks.
Our preferred ways to invest in and to trade gold along with the reasoning can be found in the how to buy gold section. Furthermore, our preferred ETFs and ETNs can be found in our Gold & Silver ETF Ranking.
As a reminder, Gold & Silver Trading Alerts are posted before or on each trading day (we usually post them before the opening bell, but we don't promise doing that each day). If there's anything urgent, we will send you an additional small alert before posting the main one.
Thank you.
Przemyslaw Radomski, CFA
Founder, Editor-in-chief

