
tools spotlight

-
FED: U.S. Economy Still "A Ways Off"
July 15, 2021, 8:28 AMLet’s not get too excited. Whenever Powell delivers dovish signals, as yesterday, the cheers often turn into jeers over the medium term.
Rinse, Repeat
With Jerome Powell, Chairman of the U.S. Federal Reserve (FED), telling Congress on Jul. 14 that the U.S. economy is “still a ways off,” investors rejoiced as the rhetoric implies that tapering is “still a ways off.” However, while Powell repeated his classic lines and maintained his classic stance, his short-term suppression of U.S. Treasury yields and the USD Index will likely result in even more violent upswings over the medium term.
Case in point: while Powell painted an ominous portrait of the U.S. economy, the FED also released its Beige Book on Jul. 14. For context, the report consolidates data from 12 regional FED banks ranging from the New York FED to the San Francisco FED.
Excerpts from the report read:
“The U.S. economy strengthened further from late May to early July, displaying moderate to robust growth. Sectors reporting above-average growth included transportation, travel and tourism, manufacturing, and nonfinancial services. Energy markets improved slightly, and agriculture had mixed results.”
“Healthy labor demand was broad-based but was seen as strongest for low-skilled positions. Wages increased at a moderate pace on average, and low-wage workers enjoyed above-average pay increase.... All Districts noted an increased use of non-wage cash incentives to attract and retain workers.”
More importantly, though:
 Source: U.S. FED
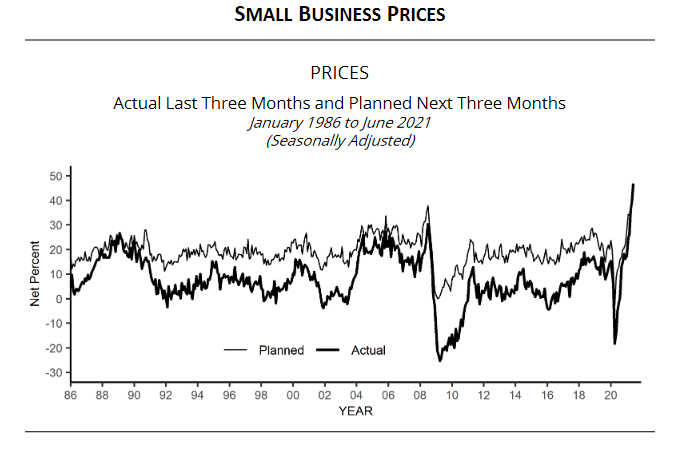
What’s more, the NFIB Small Business Optimism Index (released on Jul. 13) increased by 2.9 points in June (to 102.5) and rose above 100 for the first time since November 2020. For context, the FED’s latest Small Business Credit Survey (SBCS) included the following tidbit: “The SBCS is an annual survey of firms with fewer than 500 employees. These types of firms represent 99.7% of all employer establishments in the United States.” The bottom line? The behavior of U.S. small businesses has a profound impact on the U.S. economy.
The NFIB report revealed:
“The net percent of owners raising average selling prices increased seven points to a net 47% (seasonally adjusted), the highest reading since January 1981.”
“A net 39% (seasonally adjusted) reported raising compensation, a record high. A net 26% plan to raise compensation in the next three months.”
“Owners’ plans to fill open positions continue, with a seasonally adjusted net 28 percent planning to create new jobs in the next three months, up 1 point from May. Job creation plans remain at record high levels.”
Quite the contradiction from Powell’s assessment, huh?
 Source: NFIB
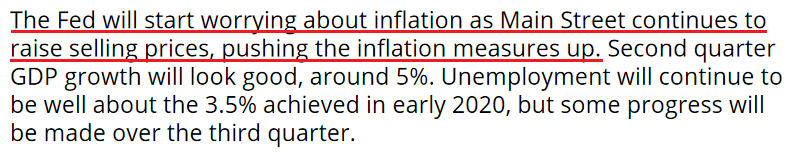
Moreover, while Powell’s dovish comments uplifted the PMs on Jul. 14, the NFIB’s commentary included an ominous warning:
 Source: NFIB
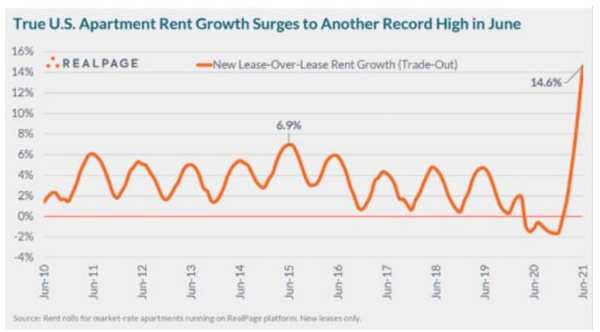
On top of that, I’ve been warning that rent inflation could add further upward pressure to the Consumer Price Index (CPI) in the coming months. And on Jul. 7, RealPage – a technology platform that serves over 19 million rental units worldwide – revealed that “rents are climbing at the fastest pace seen in decades.”
Please see below:
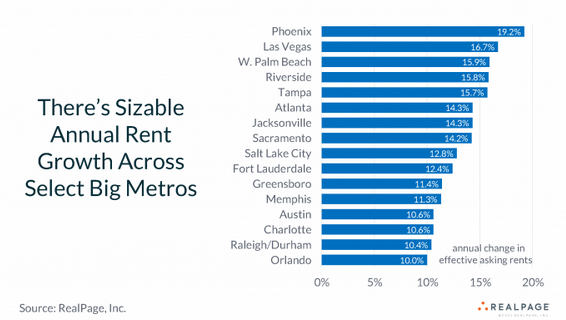
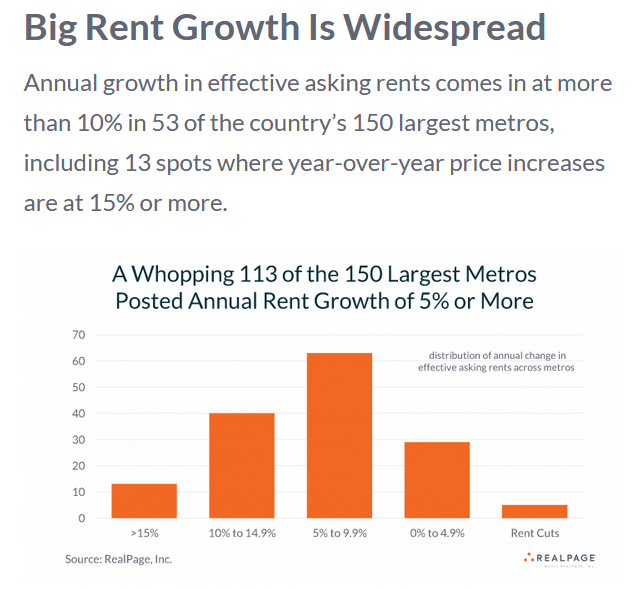 Furthermore, if we isolate the large U.S. areas with “at least 100,000 apartment units,” the situation is even worse: ranging from 10% year-over-year (YoY) growth in Orlando, Florida to 19.2% YoY growth in Phoenix, Arizona, the FED is sitting on an inflationary time bomb.
 Please see below:
In addition, while Powell cites “base effects” as the reasons for the inflationary surge, new rental agreements are already tracking ahead of their pre-pandemic counterparts. And with the Shelter CPI accounting for more than 30% of the movement of the headline CPI, used cars and trucks should be the least of Powell’s concerns.
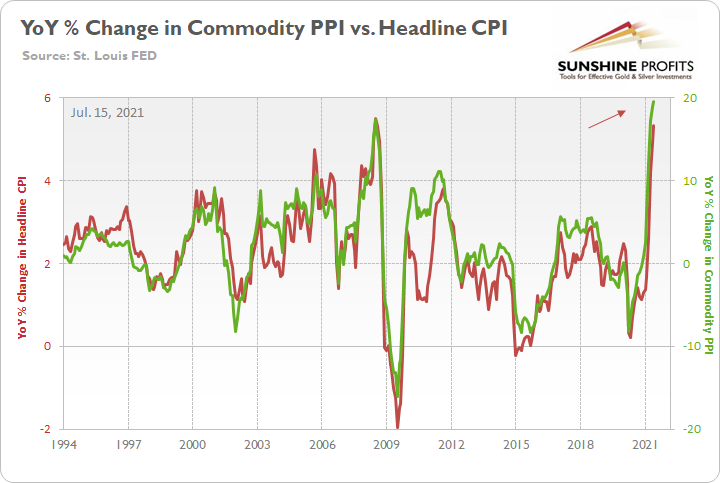
But even more revealing, the commodity PPI surged by 19.51% YoY on Jul. 14 – the highest YoY percentage increase since 1974. For context, the commodity PPI has increased by 15% or more YoY six times since 1994. And with 330 monthly observations recorded over that span, it amounts to 1.8% of historical readings. Furthermore, with the commodity PPI also rising by 1.83% month-over-month (MoM), Powell will likely regret his patience over the medium term.
To explain, I wrote on Jun. 15:
The commodity PPI often leads the headline CPI and that’s why tracking its movement is so important. If we analyze the performance of the pair during the inflationary surges of the 1970s and the early 1980s, it’s clear that the relationship has stood the test of time.
Please see below:
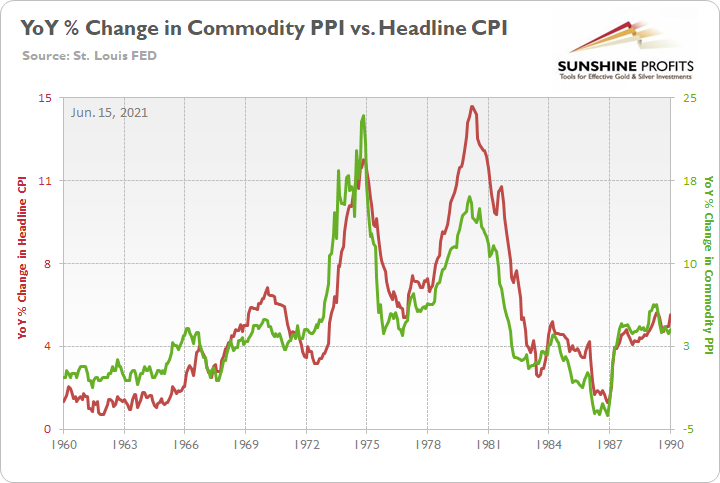
To explain, the green line above tracks the year-over-year (YoY) percentage change in the commodity PPI, while the red line above tracks the YoY percentage change in the headline CPI. If you analyze the relationship, you can see that the pair have a close connection.
More importantly, though, during the historical inflationary downpour, the month-over-month (MoM) percentage change in the commodity PPI never declined by more than 1.68%.
Please see below:
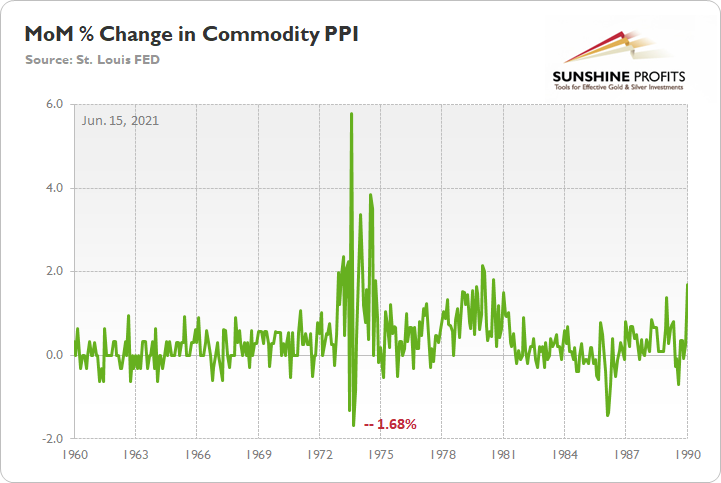
To explain, the green line above tracks the MoM percentage change in the commodity PPI. And if you compare the two MoM spikes in the commodity PPI to the two YoY spikes in the first chart above (focus your attention on the highs between 1972-1975 and 1978-1981), you can see that MoM resiliency helped sustain the YoY surges. In addition,, during the roughly nine-year bout of inflation, the commodity PPI dipped in-and-out of negative territory but never fell off of a cliff.
Now, if we circle back to the present, the YoY increase in the commodity PPI implies a headline CPI print of roughly 5.15% to 5.65% in July (when the data is released in August).
Please see below:
Finally, BlackRock CEO Larry Fink – who heads the world’s largest asset manager – told CNBC on Jul. 14 that “I worry about inflation [and] I do not believe inflation is going to be transitory.”
“I’m not trying to suggest that it’s going to be a straight-line upward, and there could be disappointments going forward. But overall, with the amount of fiscal stimulus and monetary stimulus, and more importantly with the amount of cash that is looking to be put to work, I believe the trend line is still going to be upward.”
More importantly, though, when speaking with Reuters on Jul. 14, he also predicted the following:
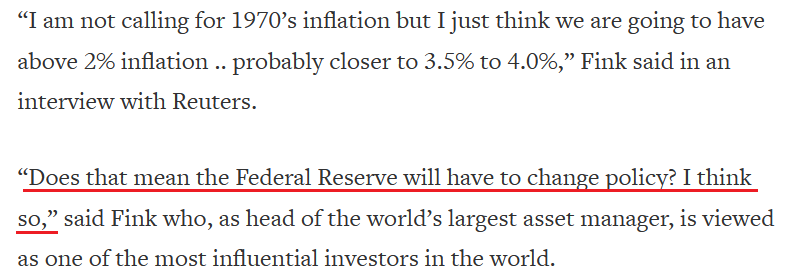 Source: Reuters
In conclusion, while the PMs applauded Powell’s performance on Jul. 14, history has shown that the cheers often turn into jeers over the medium term. For example, nearly every dovish speech from Powell results in ‘PMs up, USD Index down.’ However, once the short-term high wears off and reality returns, the reversal of fortunes often ushers the precious metals lower than they were initially. Moreover, while taunting inflation may seem amusing in the short run, the FED’s nonchalance will likely result in an even faster taper once the pressure mounts. And with gold’s largest 2021 daily loss more than 1.58x its largest daily gain, the precious metals will likely run for cover once the drama unfolds.
Moreover, let’s keep in mind that gold stocks didn’t “buy” yesterday’s strength in gold. Their exceptional underperformance continues to suggest that the medium-term trend is down and that what we saw recently is nothing more than a prolonged breather before another downswing.
Thank you for reading our free analysis today. Please note that the above is just a small fraction of the full analyses that our subscribers enjoy on a regular basis. They include multiple premium details such as the interim targets for gold and mining stocks that could be reached in the next few weeks. We invite you to subscribe now and read today’s issue right away.
Sincerely,
Przemyslaw Radomski, CFA
Founder, Editor-in-chief -
Gold: Ominous Clouds Gather Above the Metals
July 14, 2021, 8:10 AMThe news hitting the market is clouding the precious metals outlook – higher U.S. Treasuries and a hawkish FED are turning into a dangerous concoction.
Running Out of Excuses
With investors’ attention span rivaling that of a young child, the inflationary carousel has gone from hot to cold and to hot once again. For example, after short-covering, the Delta variant and the FED’s hawkish shift dropped the guillotine on the U.S. 10-Year Treasury yield, the long-term benchmark languished in defeat. However, with inflation’s reincarnation once again shifting the narrative, I warned on Jul. 9 that investors are still underestimating the inflationary fervor.
I wrote:
With the Consumer Price Index (CPI) scheduled for release on Jul. 13, another dose of reality could be forthcoming. Case in point: with the Commodity Producer Price Index (PPI) surging by 18.98% year-over-year (YoY) in May – the highest YoY percentage increase since 1974 – the print implies a roughly 5% to 5.5% YoY increase in the headline CPI. To explain, when the commodity PPI increased by 17.4% YoY in July 2008, the headline CPI rose by 5.3% in August. Thus, with the commodity PPI surging by 18.98% in May, all signs point to another ‘surprising’ headline CPI print for June.
To that point, with the headline CPI surging by 5.32% YoY on Jul. 13 (vs. 4.90% expected), the “transitory” narrative suffered another body blow. For context, all inflation is transitory. However, there is a profound difference between three months of transitory inflation and 12 months of transitory inflation.
Please see below:
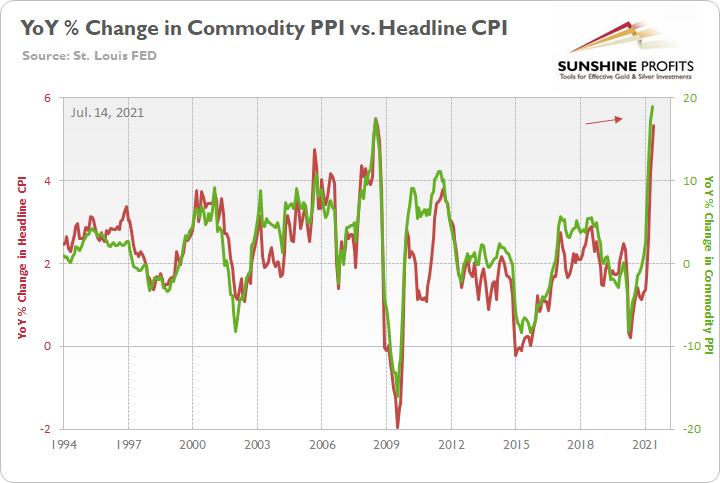
To explain, the green line above tracks the YoY percentage change in the commodity PPI, while the red line above tracks the YoY percentage change in the headline CPI. If you analyze the relationship, you can see that the pair have a close connection.
Likewise, while investors comb through the print and search for aberrations that support their outlook, they’re missing the most important link. For example, with the Used Cars and Trucks CPI surging by 45.2% YoY in June, disbelievers suggest that once the outlier recedes, it will quell the inflationary momentum. For context, I’ve been warning since April that the Manheim Used Vehicle Index signaled a profound jump in the Used Cars and Trucks CPI.
Despite that, while investors lament the obvious (of course the Used Cars and Trucks CPI will decelerate in the coming months), the commodity PPI is still the most important indicator of where the inflation story is headed next.
Please see below:
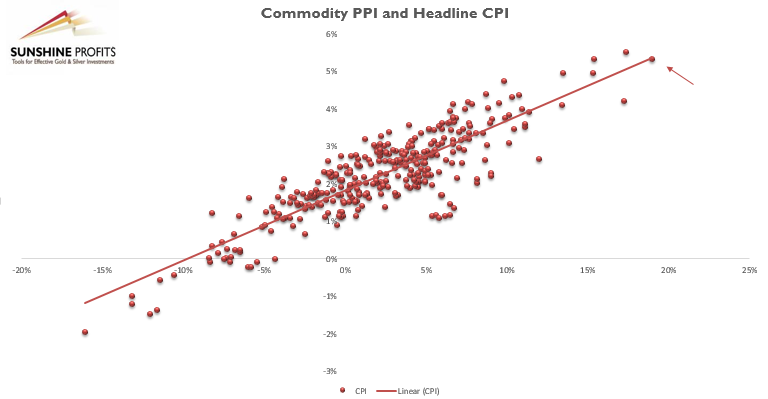
To explain, the scatterplot above depicts the relationship between the headline CPI and the commodity PPI (since 1994). For context, the headline CPI is plotted on the vertical axis, while the commodity PPI is plotted on the horizontal axis. If you analyze their movement, you can see that the pair have a strong linear relationship (correlation). Moreover, if you focus your attention on the right side of the chart, you can see that the commodity PPI has only risen by 15% YoY or more (for a month) five times since 1994. On top of that, if you follow the red arrow, you can see that the PPI/CPI relationship remains on trend. The bottom line? If the commodity PPI (which is scheduled for release today) remains hot, then expect the headline CPI to follow suit.
The Economy Growing… Too Much?
Furthermore, while the Used Cars and Trucks CPI is poised to slow over the medium term, I warned on Jun. 3 that rent inflation could easily take its place. For context, the Shelter CPI accounts for more than 30% of the movement of the headline CPI. And with The Federal National Mortgage Association (Fannie Mae) projecting that the Shelter CPI will increase from “2.0%annualized to about 4.5%” and “last through at least 2022,” the “‘transitory’ increases to the rate of overall inflation may be more prolonged than many are expecting.”
Please see below:
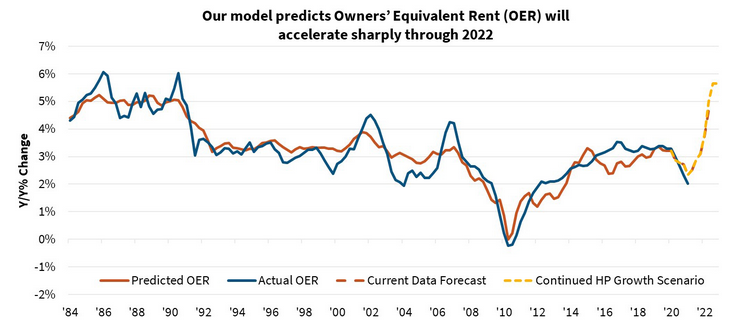 Source: Fannie Mae
Likewise, with inflation surging and the U.S. Federal Reserve (FED) pouring gasoline on the fire, St. Louis FED President James Bullard told the Wall Street Journal (WSJ) on Jul. 12 (released on Jul. 13) that “I am a little bit concerned that we’re feeding into an incipient housing bubble ... [and] I think we don’t need to be doing that with the economy growing at 7%.”
Please see below:
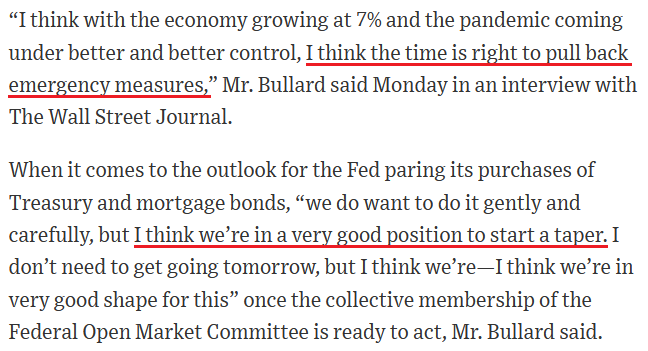 Source: WSJ
In addition, Conagra Brands CEO Sean Connolly also warned on Jul. 13 that “this is an atypical level of inflation [and] it’s the highest inflation level our company has seen in as many years as we can remember.” For context, Conagra Brands is an American food manufacturer and is home to well-known brands such as Marie Callender’s, Healthy Choice and Slim Jim.
Please see below:
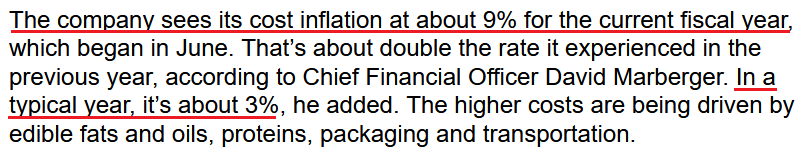 Source: Bloomberg
If that wasn’t enough, JPMorgan CEO Jamie Dimon was asked during the company’s Q2 earnings call on Jul. 13 about how the current recovery compares to the recovery following the global financial crisis (GFC). He responded:
“I think they're completely different fundamentally…. The consumer, their house value is up, their stock rises up, their incomes are up, their savings are up, their confidence are up. The pandemic is kind of in the rearview mirror. Hopefully, nothing gets worse with it. And they're ready to go.”
He added:
“Jobs are plentiful, wages are going up. These are all good things. And so, obviously, if the inflation can be worse than people think, I think it will be a little bit worse with these kinds of things. I don't think it's all temporary, but that doesn't matter if we have very strong growth.”
Even more revealing, while Dimon said that he’s “not predicting” that the U.S. 10-Year Treasury yield “goes to 3%,” he mentioned that “you may have growth in the second half this year [that’s] stronger than it's ever been in the United States of America.” Furthermore, CFO Jeremy Barnum said that the largest bank in the U.S. is putting its money where its mouth is and that’s why the cash on its balance sheet has not been invested in U.S. Treasuries.
Please see below:
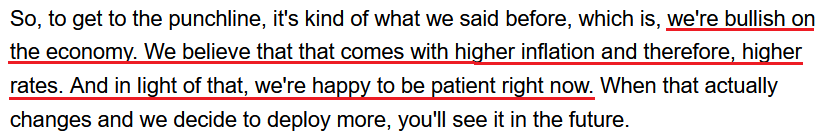 Source: JPMorgan/Seeking Alpha
Finally, with the Chicago FED releasing its Survey of Business Conditions (CFSBC) on Jul. 13, its labor cost index is now at an all-time high and its non-labor cost index remains materially elevated. Thus, the FED is running out of excuses for not scaling back its bond-buying program.
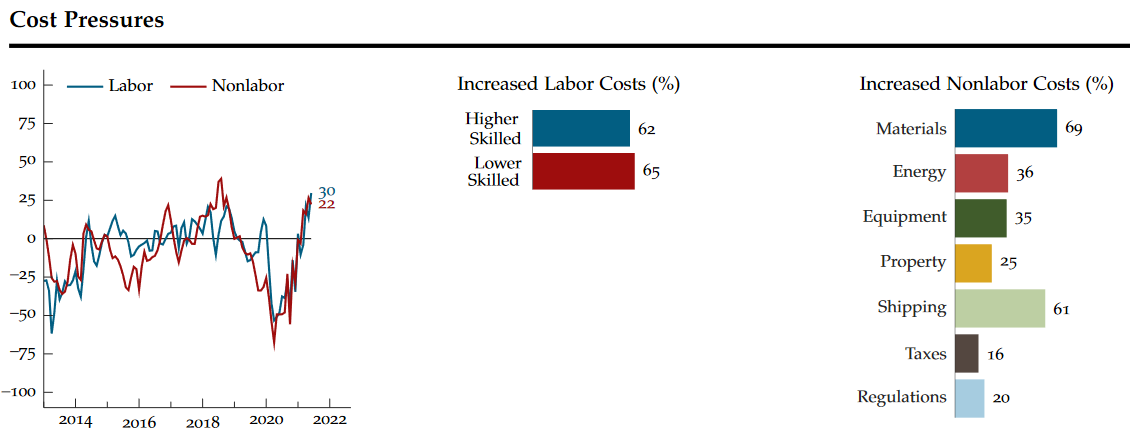 Source: Chicago FED
In conclusion, the PMs continue to hope for a bullish catalyst, but the news hitting the market is clouding their outlook. While conventional wisdom suggests that surging inflation is bullish for the gold, silver, and mining stocks, the cocktail of higher U.S. Treasury yields and a hawkish FED more than offsets the optimistic long-term argument. As a result, while the PMs may generate short-term bursts of strength, and their very long-term outlook remains favorable, their medium-term outlook is extremely ominous. With the USD Index gunning for 93, and surging inflation likely to force the FED’s hand, a September taper is unlikely to elicit a positive response from the metals.
Thank you for reading our free analysis today. Please note that the above is just a small fraction of the full analyses that our subscribers enjoy on a regular basis. They include multiple premium details such as the interim targets for gold and mining stocks that could be reached in the next few weeks. We invite you to subscribe now and read today’s issue right away.
Sincerely,
Przemyslaw Radomski, CFA
Founder, Editor-in-chief -
Another Day, Another Sell Sign from the Gold Miners
July 13, 2021, 2:58 AMAvailable to premium subscribers only.
-
Gold: High Time to Move Out of the Penthouse
July 10, 2021, 12:19 PMGold’s days in a glamorous apartment at the top of the PMs’ building are numbered. We’d better prepare for a rapid elevator ride to the first floor.
The Gold Miners
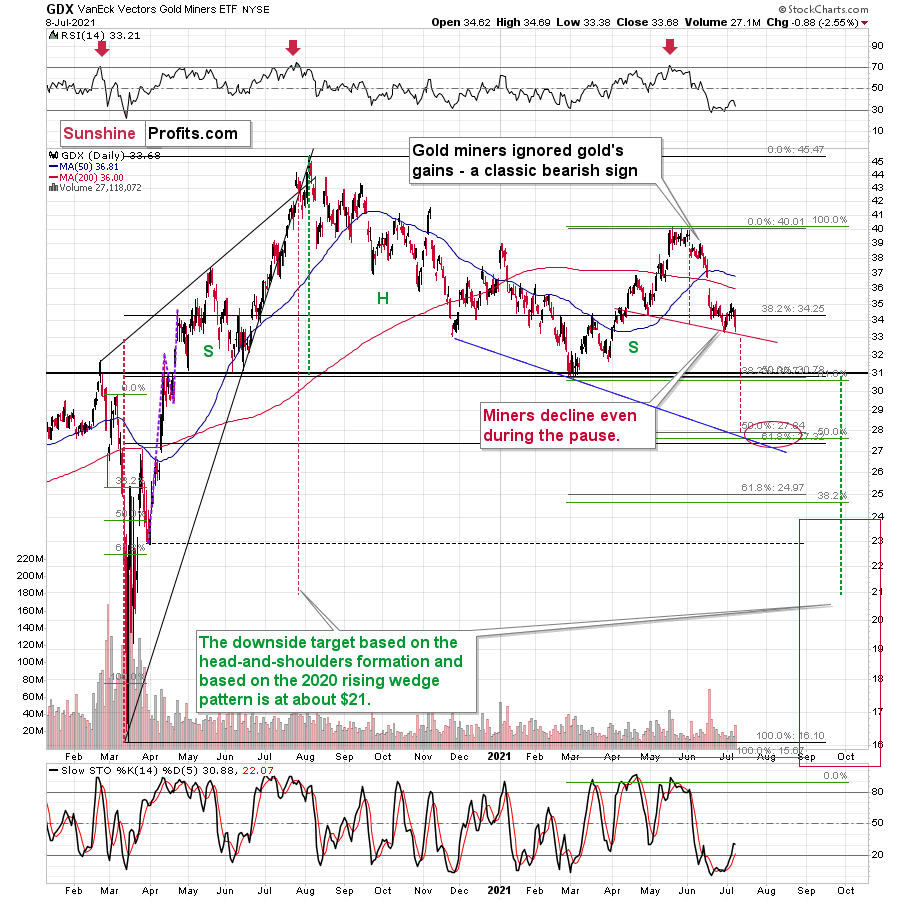
With the gold miners essentially running laps on the treadmill, the HUI Index, the GDX ETF, and the GDXJ ETF are working extremely hard but making little progress. And with the gambit resulting in ‘one step forward, two steps back,’ frustrating exhaustion has mining stocks questioning their every move. To that point, even though the trio transitioned from the conveyor belt to the stairs in recent weeks, history shows that slow climbs often culminate with elevator rides lower. Should we expect a different outcome this time around?
Gold ended the week in the green (up by $27.30), but the HUI Index was stuck in the red (down by 1.39). This is extremely noteworthy, as a similar divergence occurred at the end of May. For context, when the yellow metal rallied by $28.60 in a week back then, the HUI Index fell by 1.37 index points.
In the following weeks, the HUI Index declined by about 50 index points, while gold declined by about $150.
And with the ominous imbalance preceding the pair’s precipitous declines, again, should we expect a different outcome this time around?
Please see below:
To explain, with the HUI Index unable to muster any meaningful relief rallies, I warned that the recent plunge was weeks in the making:
I wrote the following about the week beginning on May 24:
What happened three weeks ago was that gold rallied by almost $30 ($28.60) and at the same time, the HUI – a flagship proxy for the gold stocks… Declined by 1.37. In other words, gold stocks completely ignored gold’s gains. That shows exceptional weakness on the weekly basis and is a very bearish sign for the following weeks.
To that point, with the HUI Index’s ominous signals only increasing, if history rhymes (as it tends to), medium-term support will likely materialize in the 100-to-150 range. For context, high-end 2020 support implies a move back to 150, while low-end 2015 support implies a move back to 100. And yes, it could really happen, even though such predictions seem unthinkable.
Furthermore, with the junior miners often suffering the most during medium-term drawdowns, short positions in the GDXJ ETF will likely offer the best risk-reward ratio. For context, if you held firm in 2008 and 2013 and maintained your short positions, you almost certainly realized substantial profits. And while there are instances when it’s wise to exit one’s short positions, the prospect of missing out on the forthcoming slide makes it quite risky.
Even more bearish, a drastic underperformance by the HUI Index also preceded the bloodbath in 2008. To explain, right before the huge slide in late September and early October, gold was still moving to new intraday highs; the HUI Index was ignoring that, and then it declined despite gold’s rally. However, it was also the case that the general stock market suffered materially. If stocks didn’t decline back then so profoundly, gold stocks’ underperformance relative to gold would have likely been present but more moderate.
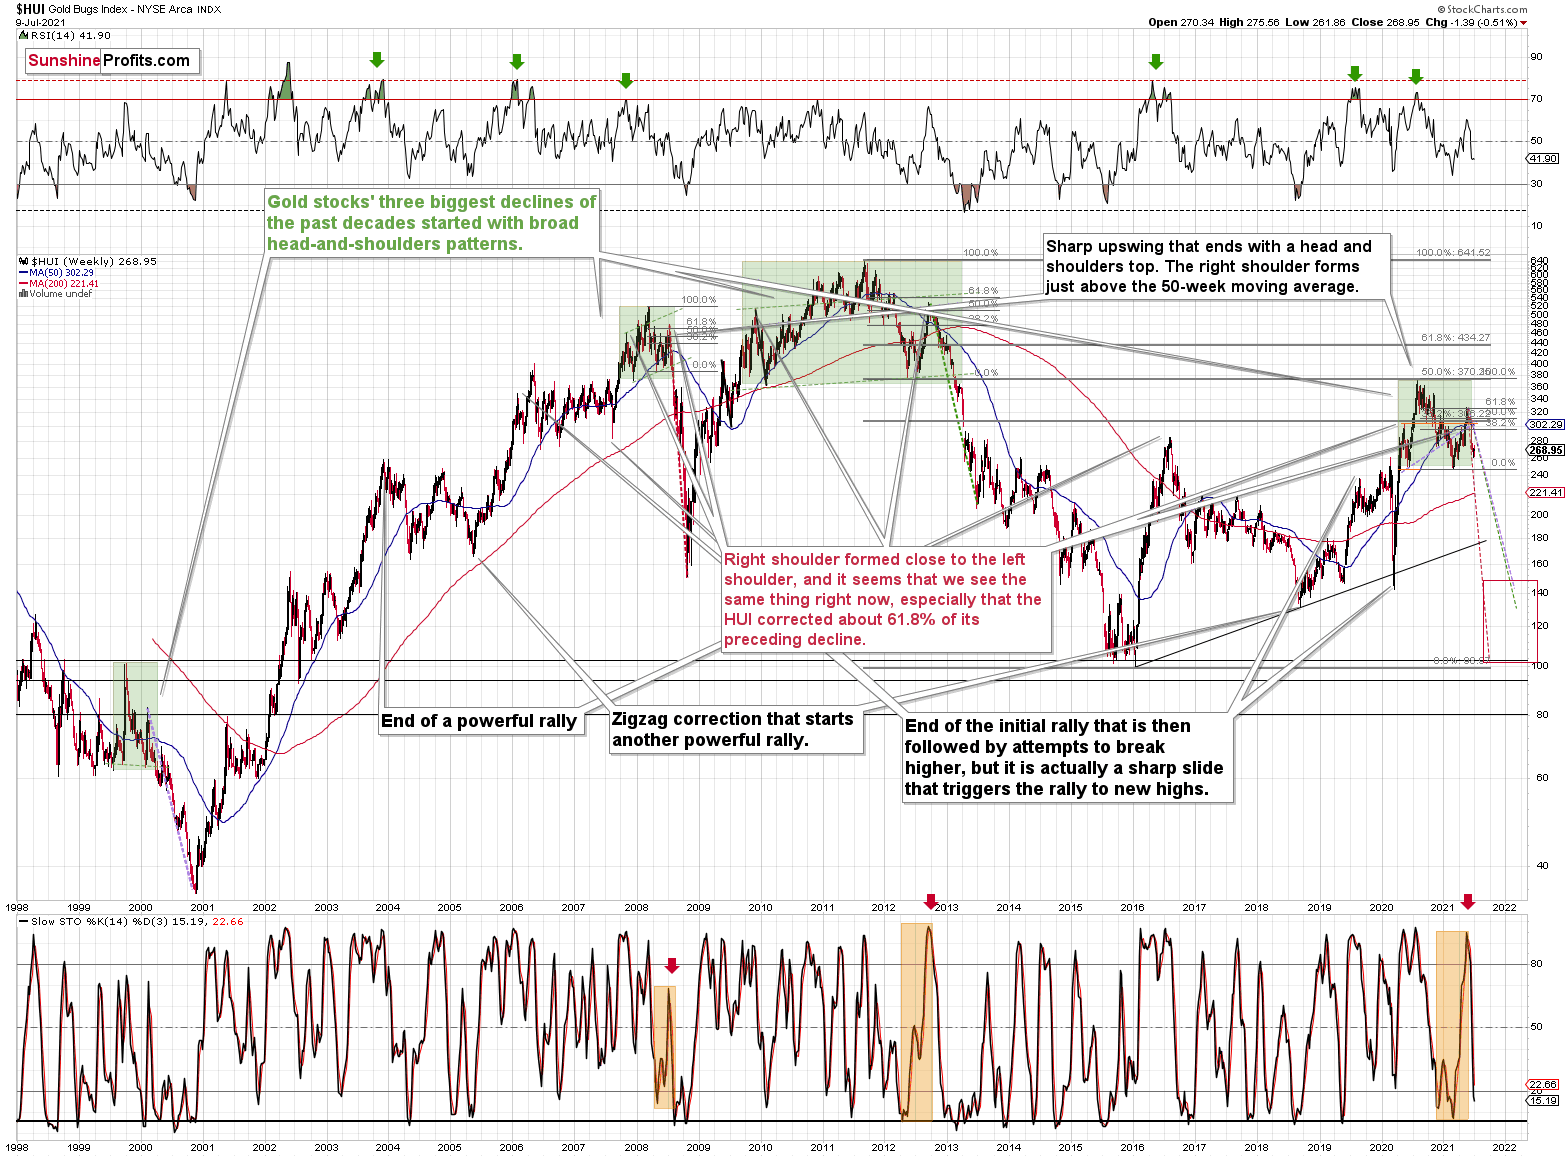
Nonetheless, the HUI Index’s bearish head-and-shoulders pattern is already sounding the alarm. When the HUI Index retraced a bit more than 61.8% of its downswing in 2008 and in between 50% and 61.8% of its downswing in 2012 before eventually rolling over, in both (2008 and 2012) cases, the final top – the right shoulder – formed close to the price where the left shoulder topped. And in early 2020, the left shoulder topped at 303.02. Thus, three of the biggest declines in the mining stocks (I’m using the HUI Index as a proxy here), all started with broad, multi-month head-and-shoulders patterns. And in all three cases, the size of the declines exceeded the size of the head of the pattern.
In addition, when the HUI Index peaked on Sep. 21, 2012, that was just the initial high in gold. At that time, the S&P 500 was moving back and forth with lower highs. And what was the eventual climax? Well, gold made a new high before peaking on Oct. 5. In conjunction, the S&P 500 almost (!) moved to new highs, and despite bullish tailwinds from both parties, the HUI Index didn’t reach new heights. The bottom line? The similarity to how the final counter-trend rally ended in 2012 (and to a smaller extent in 2008) remains uncanny.
As a result, we’re confronted with two bearish scenarios:
- If things develop as they did in 2000 and 2012-2013, gold stocks are likely to bottom close to their early-2020 low.
- If things develop like in 2008 (which might be the case, given the extremely high participation of the investment public in the stock market and other markets), gold stocks could re-test (or break slightly below) their 2016 low.
Keep in mind though: scenario #2 most likely requires equities to participate. In 2008 and 2020, sharp drawdowns in the HUI Index coincided with significant drawdowns of the S&P 500. However, with the Fed turning hawkish and investors extremely allergic to higher interest rates, the likelihood of a three-peat remains relatively high.
As further evidence, let’s analyze the behavior of the GDX ETF and the GDXJ ETF. Regarding the former, the senior miners celebrated gold’s strength by falling to their previous lows on Jul. 8. If this is not a shocking proof of extreme underperformance, then I don’t know what would be one.
Please see below:

Regarding the latter, on Jun. 29 (the June low), the GDXJ ETF closed at $45.83. And on Jul. 8, it closed at $45.53. Ladies and gentlemen, we had a breakdown.
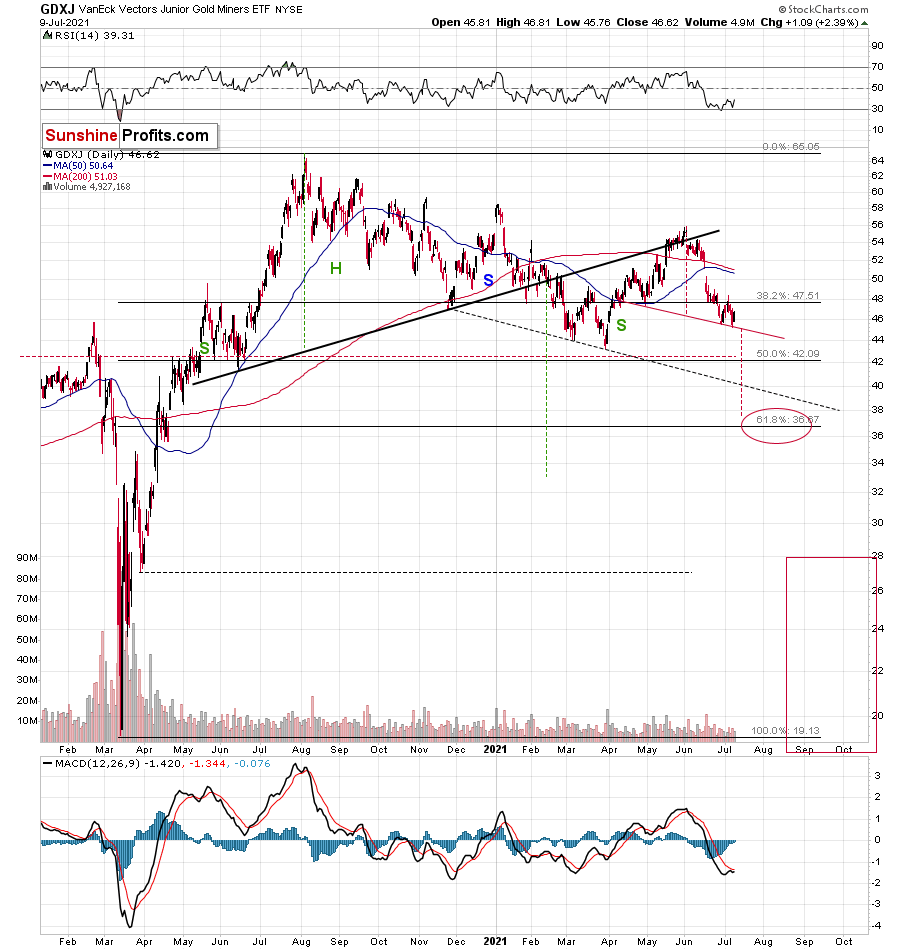
Of course, we see that the breakdown was invalidated, but the fact that it moved to new lows while gold rallied is extremely bearish. It seems like the junior miners simply can’t wait to break to new lows.
The bottom line?
If gold repeats its June slide, it will decline by about $150. Taking the entire decline into account (since August 2020), for every $1 that gold fell, on average, the GDX was down by about 4 cents (3.945 cents) and GDXJ was down by about 6.5 cents (6.504 cents).
This means that if gold was to fall by about $150 and miners declined just as they did so far in the past year (no special out- or underperformance), they would be likely to fall by $5.92 (GDX) and $9.76 (GDXJ). Given the Jul. 8 closing prices, this would imply price moves to $27.76 (GDX) and $35.78 (GDXJ). So, the profits on the current short position are likely to soar.
In conclusion, while the HUI Index, the GDX ETF and the GDXJ ETF are likely to have some small breathers along the way, their sprints lower are likely far from finished. When we combine their extreme underperformance relative to gold with the bearish 2008 and 2012 analogues, the gold miners might just huff and puff and blow their own houses down. As a result, while 2021 has already delivered two desperate pleas for more oxygen, the trio will likely require a third ventilator in the coming months. The outlook for the following weeks remains very bearish.
Thank you for reading our free analysis today. Please note that the above is just a small fraction of the full analyses that our subscribers enjoy on a regular basis. They include multiple premium details such as the interim targets for gold and mining stocks that could be reached in the next few weeks. We invite you to subscribe now and read today’s issue right away.
Sincerely,
Przemyslaw Radomski, CFA
Founder, Editor-in-chief -
Gold Miners: The Underperformance Screams “Bearish!”
July 9, 2021, 9:01 AMWhile gold moved slightly above its recent highs yesterday, the gold stocks moved to their previous lows. Can you hear the bears approaching?
Gold made another reversal yesterday, and the miners declined profoundly – also once again. Just as in early 2013 – that’s extremely bearish.
Gold futures moved to new intraday highs yesterday, but they ended the session $1.90 lower, creating yet another shooting star reversal candlestick. Seeing just one reversal is bearish on its own, but seeing more than one in a row is profoundly bearish.
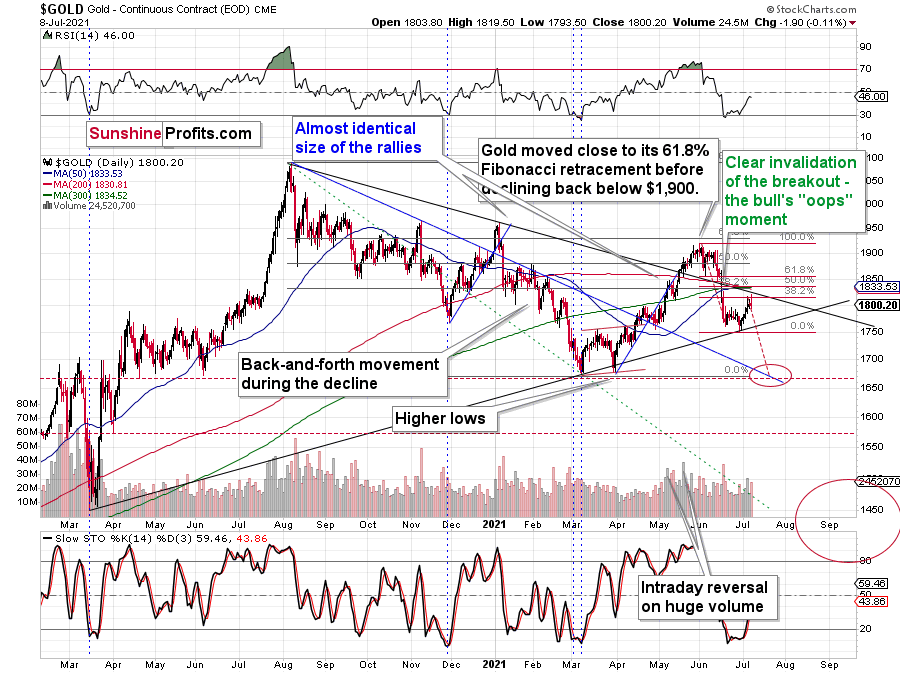
Please note that gold reversed after moving slightly above the 38.2% Fibonacci retracement based on the recent decline. The minimum one of the likely correction sizes was reached, so the decline can now continue. The RSI is no longer oversold, but rather close to the middle of its trading range. This tells us that bearish gold forecasts are clearly justified. Also based on the reversals that we just saw, this move is likely to be to the downside.
The Gold Miners
Another detail that serves as a bearish confirmation is the performance of the mining stocks.
While gold moved slightly above its recent highs during yesterday’s session, the gold stocks moved to their previous lows. If this is not a shocking proof of extreme underperformance, then I don’t know what would be one.
The mining stocks simply can’t wait to break to new lows. In fact, the junior miners – my proxy of choice for the current (profitable) short trade – already broke to new lows.
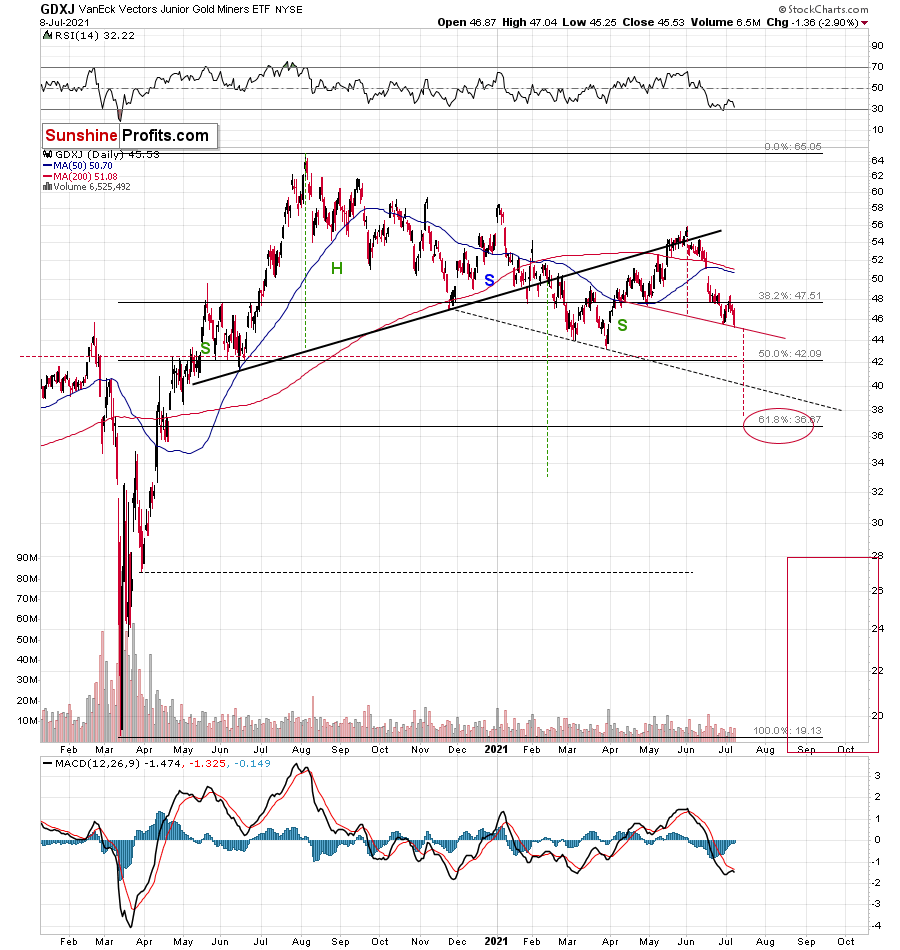
On June 29 (the June low), the GDXJ ETF closed at $45.83, and yesterday it closed at $45.53. Ladies and gentlemen, we have a breakdown.
Of course, it was not confirmed yet, but the fact that we saw a new low while gold made a new short-term intraday high is extremely bearish.
The interesting detail about both (GDX and GDXJ) ETFs is that the recent price moves created bearish head-and-shoulders formations in them. The targets based on such formations are based on the size of their heads. I marked the height of the head and the targets with red, dashed lines.
It seems that we might see a move below $38 in the GDXJ before it corrects in a more meaningful way.
Ok, but shouldn’t March lows provide strong support and trigger a rebound?
Yes, the previous lows provide relatively important support, but:
- Miners have been very weak relative to gold recently, and they don’t even need to keep it up in order to slide below the March lows – they could behave “normally” for this to happen.
- Gold seems to be ready to slide significantly – to its March lows or so. In order to do it, it would need to approximately repeat its June slide.
If gold repeats its June slide, it will decline by about $150.
Taking the entire decline into account (since August 2020), for every $1 that gold fell, on average, the GDX was down by about 4 cents (3.945 cents) and GDXJ was down by about 6.5 cents (6.504 cents).
This means that if gold was to fall by about $150 and miners declined just as they did so far in the past year (no special out- or underperformance), they would be likely to fall by $5.92 (GDX) and $9.76 (GDXJ). Given yesterday’s closing prices, this would imply price moves to $27.76 (GDX) and $35.78 (GDXJ).
Interestingly, both above-mentioned price levels are in perfect tune with the target areas that I placed on the charts based on the head and shoulders patterns and the 61.8% Fibonacci retracement level (which is based on the entire 2020 rally). This adds to their credibility. Naturally, I will be making updates as the situation develops and we get more information.
Thank you for reading our free analysis today. Please note that the above is just a small fraction of the full analyses that our subscribers enjoy on a regular basis. They include multiple premium details such as the interim targets for gold and mining stocks that could be reached in the next few weeks. We invite you to subscribe now and read today’s issue right away.
Sincerely,
Przemyslaw Radomski, CFA
Founder, Editor-in-chief


Gold Investment News
Delivered To Your Inbox
Free Of Charge
Bonus: A week of free access to Gold & Silver StockPickers.
Gold Alerts
More-
Status
New 2024 Lows in Miners, New Highs in The USD Index
January 17, 2024, 12:19 PM -
Status
Soaring USD is SO Unsurprising – And SO Full of Implications
January 16, 2024, 8:40 AM -
Status
Rare Opportunity in Rare Earth Minerals?
January 15, 2024, 2:06 PM

