

Briefly: in our opinion, full (300% of the regular position size) speculative short positions in mining stocks are justified from the risk/reward point of view at the moment of publishing this Alert.
And so, it happened. Gold moved right to its target level that seemed to be the max that it could reach, but that didn’t seem to be the most likely outcome. Just because it wasn’t the most likely outcome, doesn’t make it impossible. The “most likely” can happen all the time – after all its only “most likely” not “certain” or “inevitable”.
Gold declined right after its triangle-vertex-based reversal, but it appears that the market participants didn’t want to give up on the bullish tone until gold finally reached its previous lows and highs.
Just like magnets, the strong support and resistance lines draw investors and traders, and it seems that we saw this play out once again.
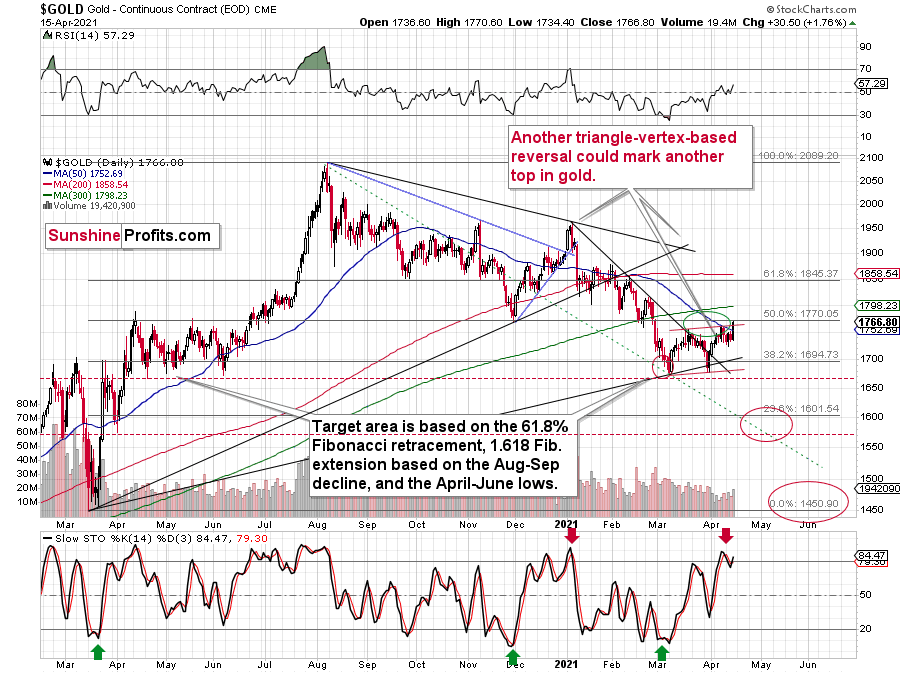
Gold moved slightly above its upper border of the near-perfect flag (zigzag) pattern and this small breakout is not completed. This particular breakout is not even close to being as important as the fact that the previous very strong resistance held yesterday (Apr. 15).
Why? Because the level that was just reached – the $1,770 level – is the level that provided strong resistance in mid-2020 (several times) and it provided strong support in late-2020 and early 2021. These were mostly very important reversals, which make this price level particularly important.
Moreover, the current move higher to this level is symmetrical to what we saw in mid-2020. Consequently, even though this week’s rally might seem like a game-changer, it very likely isn’t one.
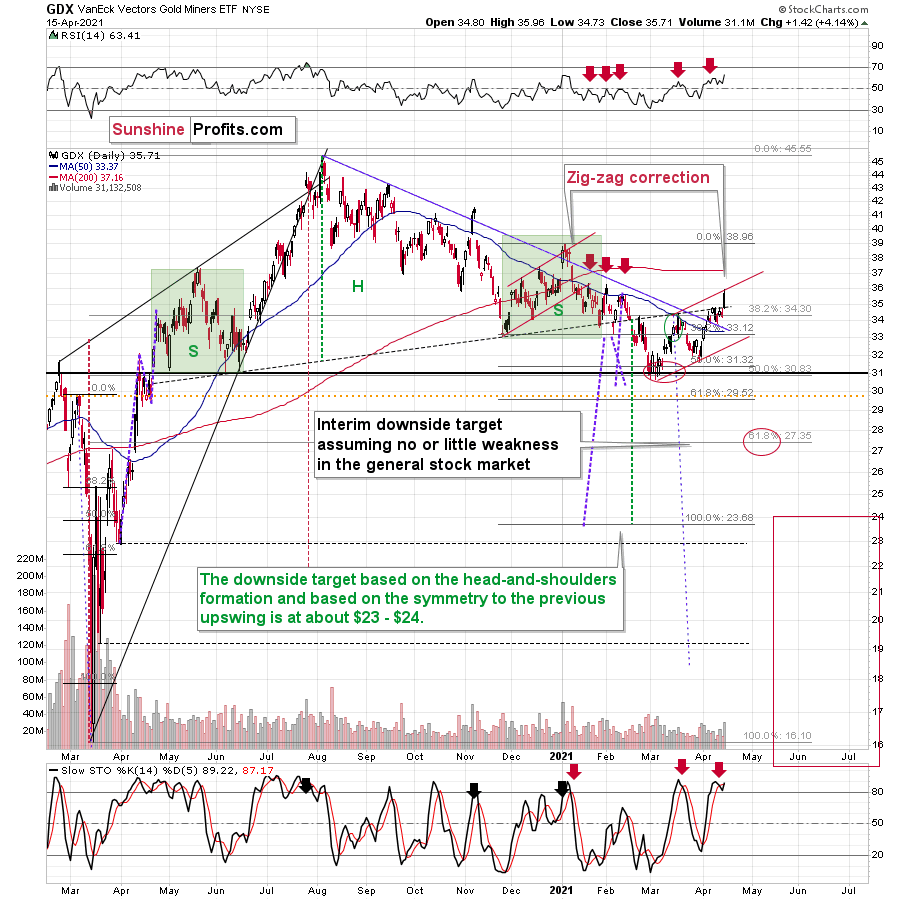
But miners moved higher, and they invalidated the breakdown below the neck level of the broad head-and-shoulders formation!
…Did they, though?
Mining Stocks: GDX and GDXJ
The GDX ETF did indeed close yesterday above the dashed line that I used to mark the neckline of the head and shoulders pattern. One might view this as an invalidation of the breakdown, and thus a bullish sign. This doesn’t add up with gold’s inability to move above its critical resistance at $1,770, and we see that miners moved only to the line that’s symmetrical to the line based on the recent bottoms.
In yesterday’s intraday Alert, I wrote the following:
Mining stocks are rallying too, but please note that they only reached their upper border of the zig-zag pattern. Back in early January, this was exactly where the rally had ended. The top formed on huge volume and based on the volume that we already see today, it’s almost certain that the volume for today’s session will be huge – just like what we saw at the January top.
I realize that waiting for the next big slide is exhausting and discouraging, and it’s not easy to hold on to the current trading position. However, the outlook didn’t change, and the situation continues to fit the bearish narrative despite today’s intraday upswing. Consequently, exiting positions now seems not only pre-mature, but actually opposite to what appears to be a good trading move from my point of view. After all one wants to sell or short at the tops and tops can only form after rallies.
The above remains up-to-date. Let’s get back to the reason why this invalidation of the breakdown in the GDX might not really mean the true, meaningful invalidation of the breakdown in miners in general. The reason is that other proxies for the mining stocks sector don’t confirm it.
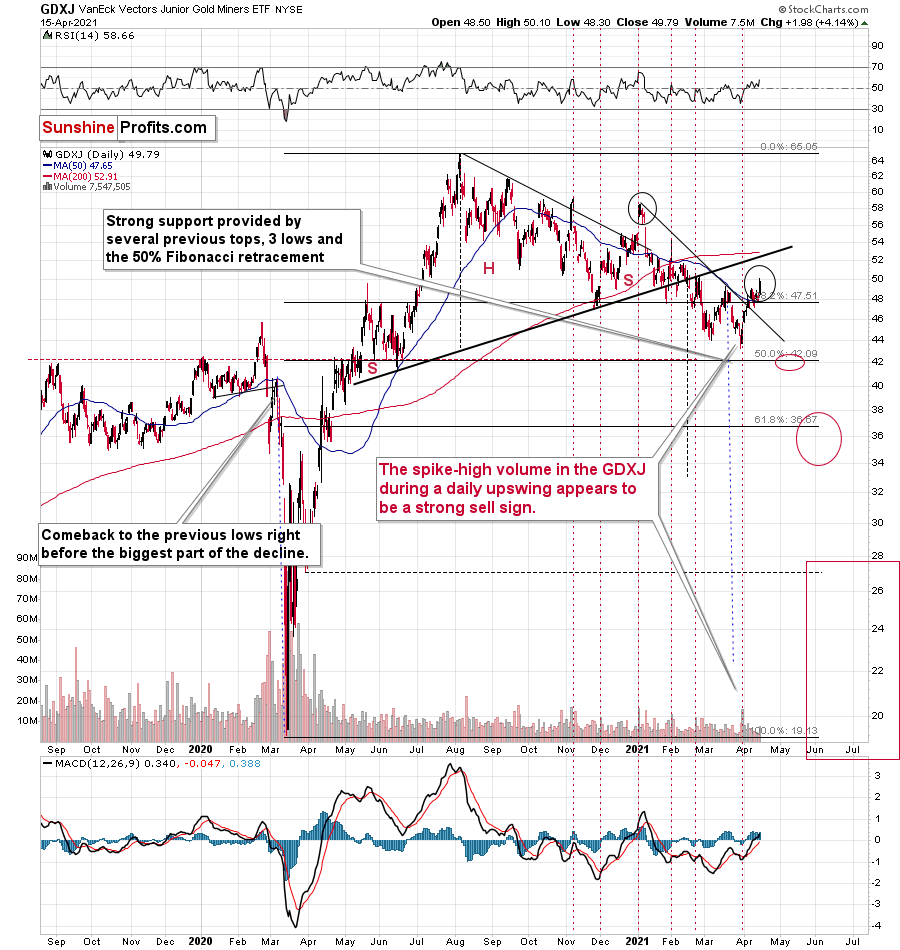
The GDXJ ETF is relatively far from the neck level (which I marked with a thick, black line). On a side note, the breakout that we saw recently (above the short-term declining resistance line) seems similar to the breakout that we saw in January – above the line that was important back then. Just as the January strength turned into declines, I expect to see the same thing this time.
Let’s move to the two key indices for the mining stocks sector, the HUI and the XAU indices.
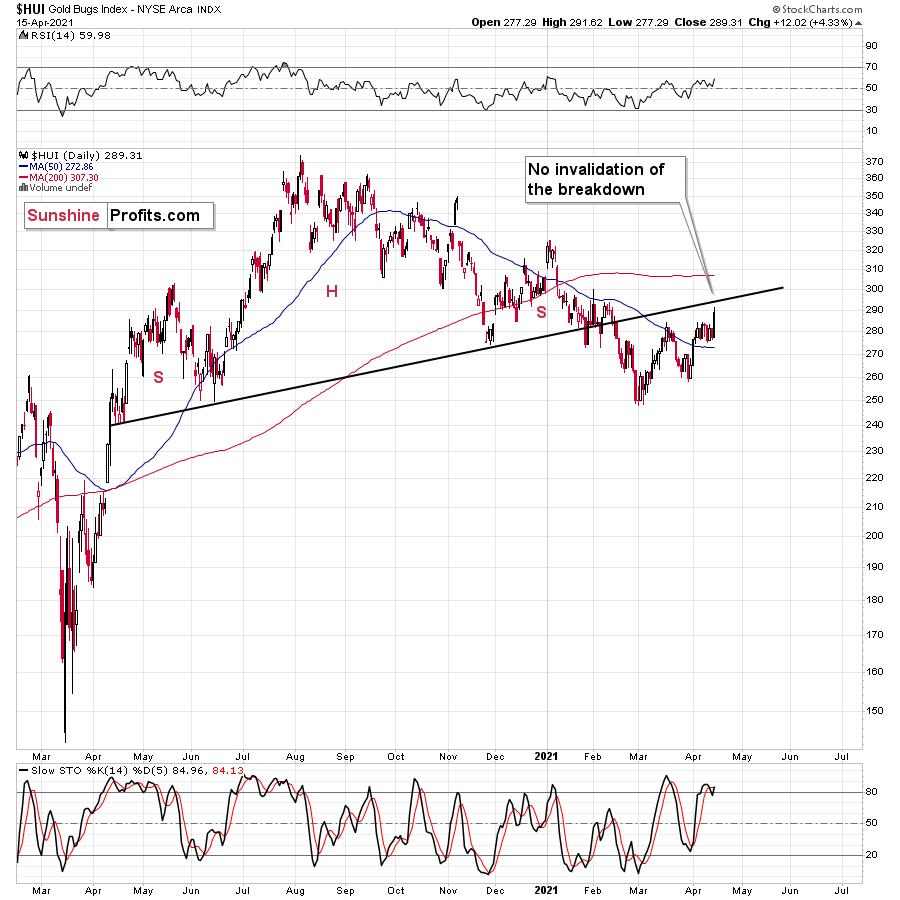
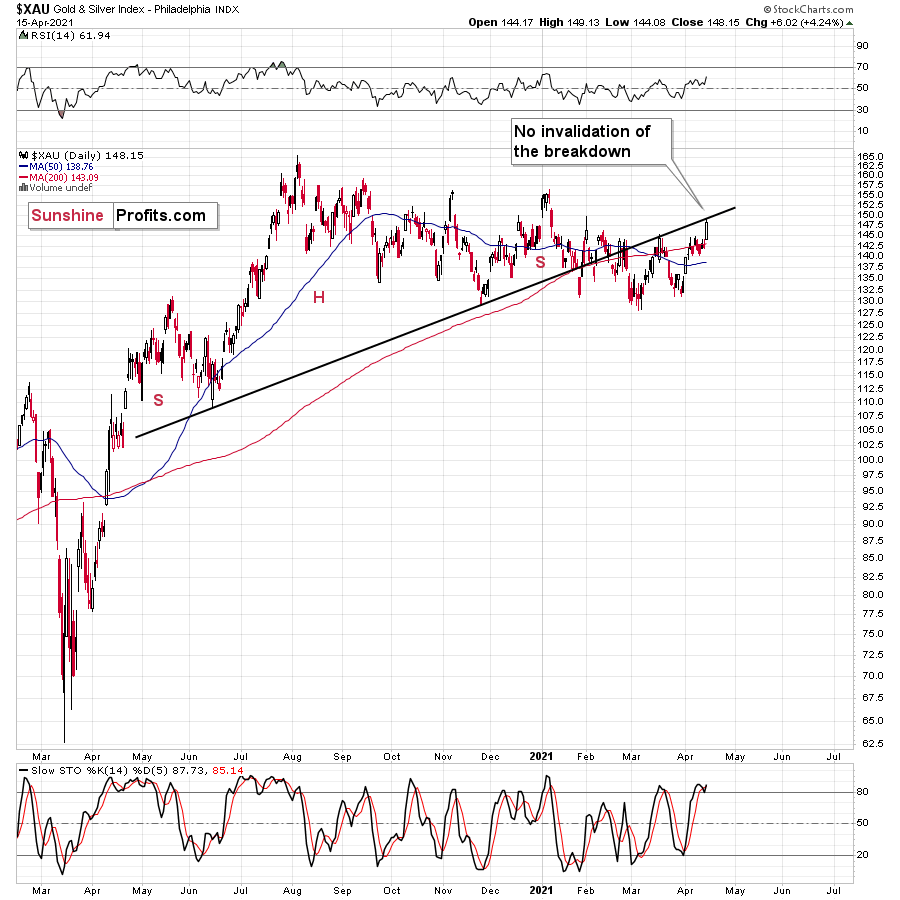
In neither of them did we see the invalidation of the breakdown. Consequently, the GDX ETF is the odd one out in the entire pack, not to mention the lack of a breakout in gold. Therefore, it seems prudent not to give particular meaning to what happened in the GDX ETF alone.
Silver
And what about silver’s outlook?
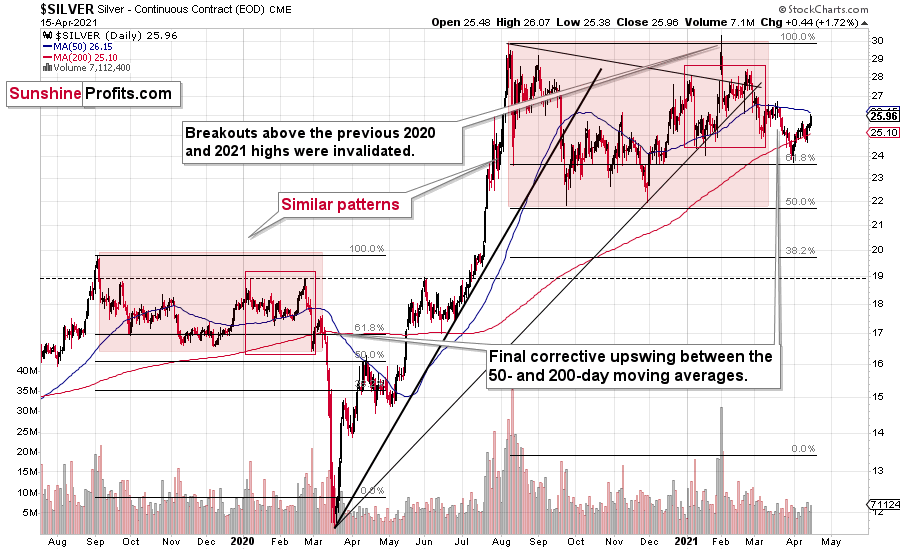
Nothing really changed despite yesterday’s strength. Just as was the case in March 2020, silver is correcting after a visible decline. Back in March 2020, the correction ended between the 200-day (red) and 50-day (blue) moving averages. The same is happening right now. Silver’s 50-day moving average is currently at $26.15 and the white precious metal closed at $25.96.
All in all, it seems that quite a lot happened yesterday, but nothing really changed as far as the outlook for gold is concerned.
Having said that, let’s take a look at the market from a more fundamental angle.
All for One and None for All
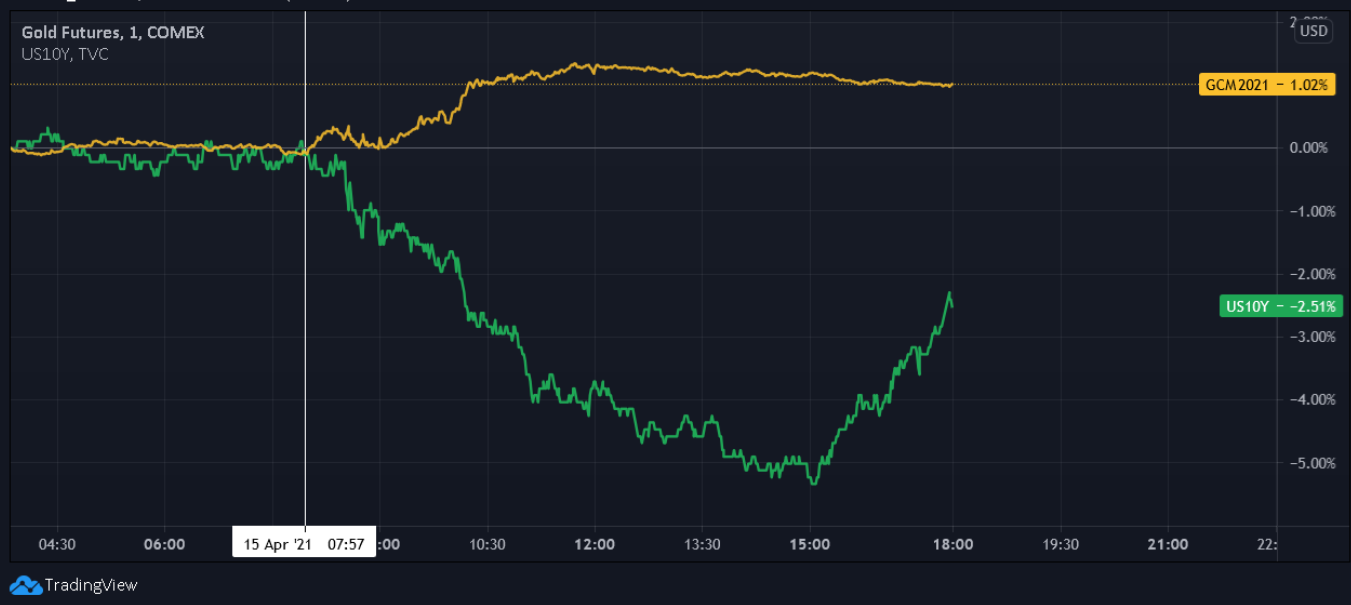
With the U.S. 10-Year Treasury yield suffering its largest daily decline since Apr. 1, the PMs basked in the glory. Holding steady until roughly 8 a.m. ET, after a wink from the U.S. 10-Year Treasury yield, it was off to the races for gold.
Please see below:
But despite the countertrend moves, it’s important to remember where we are and how we got here. Offering a poor risk-reward proposition, the PMs suffer in three out of four possible scenarios.
And they are?
- When the bond market and the stock market price in risk, it’s bearish for the PMs
- When the bond market and the stock market don’t price in risk, it’s bearish for the PMs
- When the bond market doesn’t price in risk, but the stock market does, it’s bearish for the PMs
Conversely, able to turn a 3:1 reward-to-risk upside down, when the bond market prices in risk and the stock market doesn’t, it’s bullish for the PMs, bearish for the USD Index and bearish for the U.S. 10-Year Treasury yield. Thus, under this scenario, all for one turns into none for all.
For example, with Russia and the Ukraine accelerating their geopolitical conflict, U.S. President Joe Biden announced fresh sanctions on Apr. 15.
Please see below:
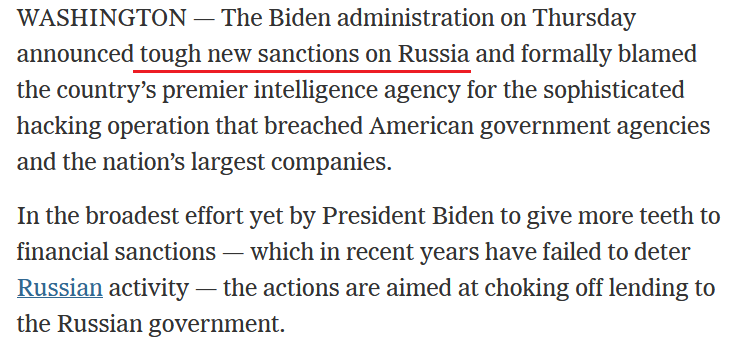 Source: The New York Times
In addition, after Biden’s administration became friendlier with Taiwan, China warned the U.S. “not to play with fire.” And testifying before the U.S. Senate Intelligence Committee on Apr. 14, FBI Director Christopher Wray had this to say:
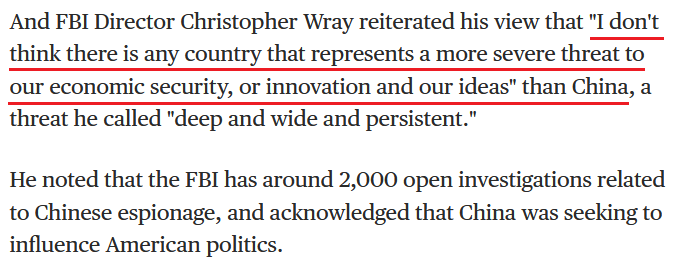 Source: NBC
If that wasn’t enough, daily coronavirus cases have trekked higher across several regions (except for the U.K.), with risk of further economic disruption rising in recent days.
Please see below:
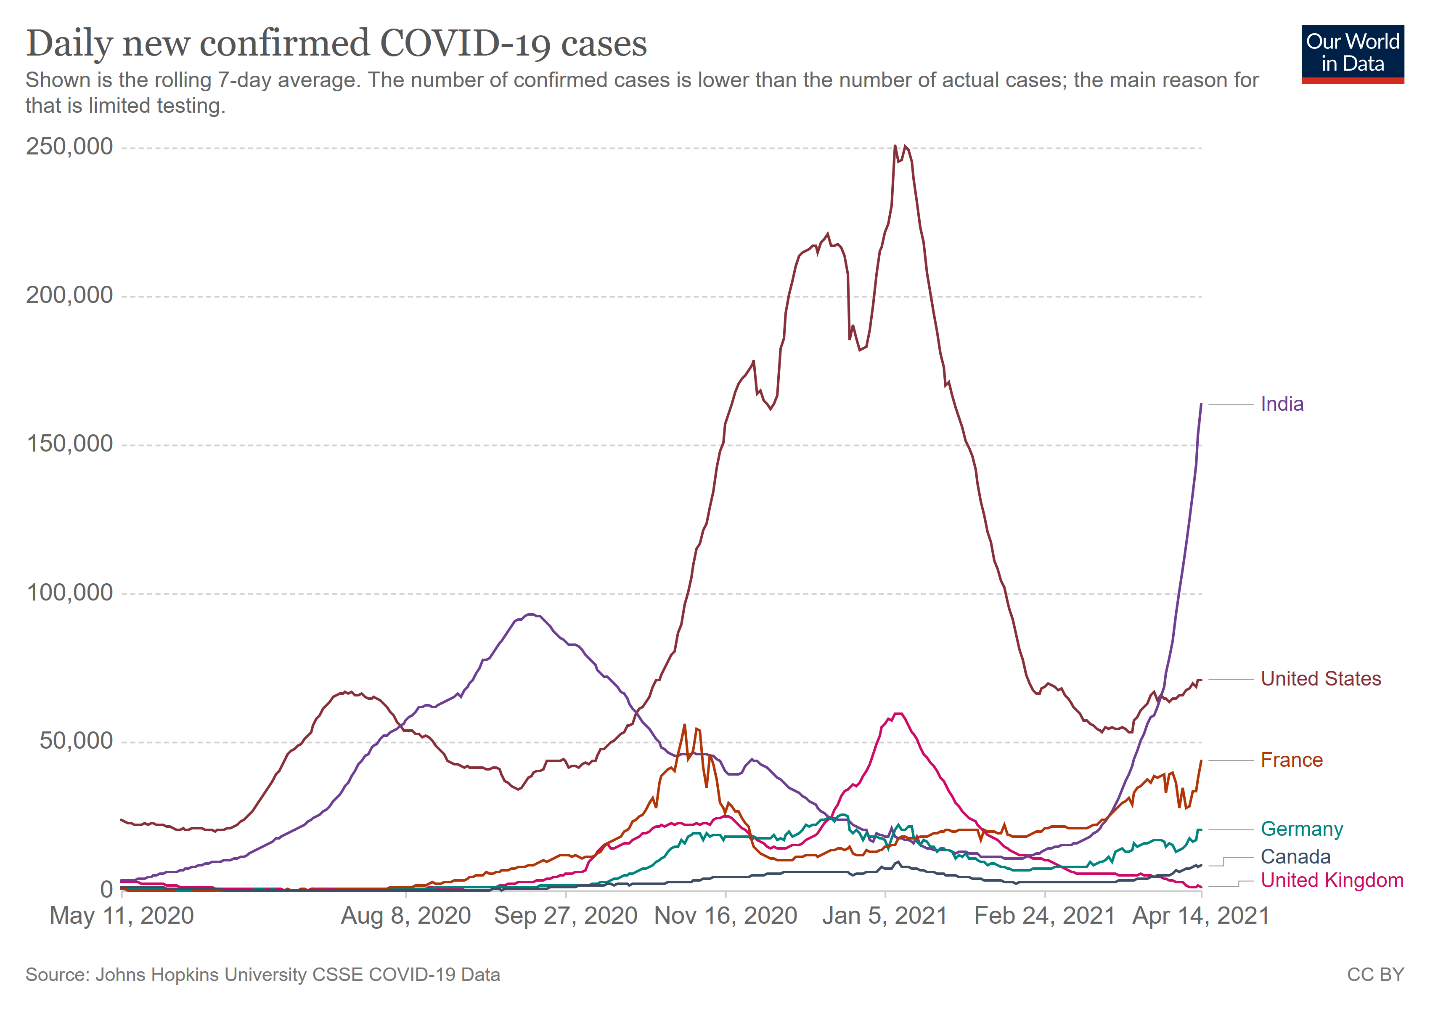
Thus, the three bears above created a goldilocks environment for the PMs.
With bond investors responding to the turmoil by bidding up U.S. Treasuries – which are considered among the safest assets on the planet – the bond market responded in a logical way. Conversely, with equity investors driving full speed down the highway with no brakes, the diverging behavior created a nirvana for the PMs.
Remember though: the bond market’s prudence and the equity market’s nonchalance doesn’t change the fundamental forces that will impact the PMs in the coming weeks and months. And despite the daily optimism, their recent rip higher was only a small victory within a much larger war.
Case in point: on Nov. 4, the U.S. 10-Year Treasury yield plunged by 13.91%. In response, the Cboe Interest Rate Swap Volatility Index (SRVIX) declined by 8.09%. Likewise, on Mar. 23, the U.S. 10-Year Treasury yield fell by 4.27%. In response, the SRVIX declined by 3.45%. In addition, on Apr. 6, the U.S. 10-Year Treasury yield fell by 2.91%. In response, the SRVIX declined by 6.79%.
However, on Apr. 15, while the U.S. 10-Year Treasury yield fell by 4.88%, the SRVIX ended the day down by 0.41%. As a result, bond investors weren’t exactly breathing a sigh of relief.
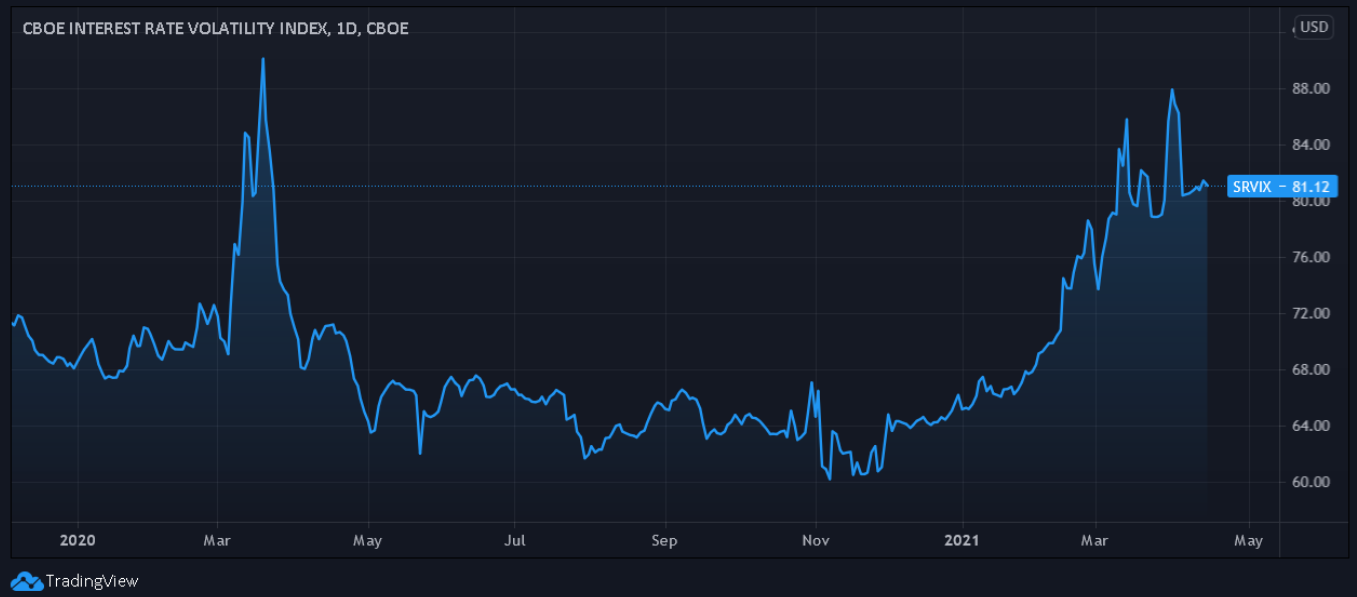
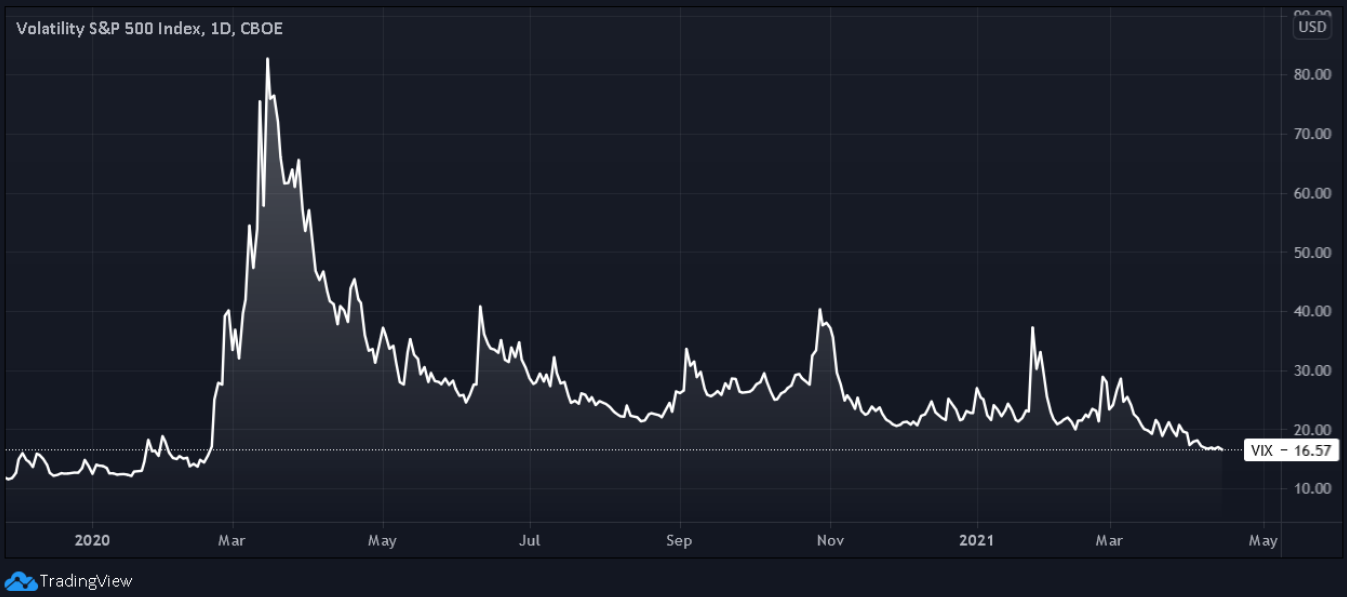
In stark contrast, the Cboe Volatility Index (VIX) – which measures the expected volatility in the S&P 500 over the next 30 days – has set its sights on the February 2020 lows. Thus, while the stock market sees nothing but clear skies ahead, the SRVIX’s subdued reaction on Apr. 15 signals that another interest rate eruption is likely to occur in the coming weeks.
But why is there such divergent anxiety? Well, because the inflation story is unlikely to abate anytime soon.
Case in point: when the National Federation of Independent Business (NFIB) calculates its monthly Small Business Optimism Index, the group surveys small business owners about their plans to increase or decrease prices. And with their responses exhibiting a strong correlation with U.S. core CPI, it’s understandable why the bond market remains on edge.
Please see below:
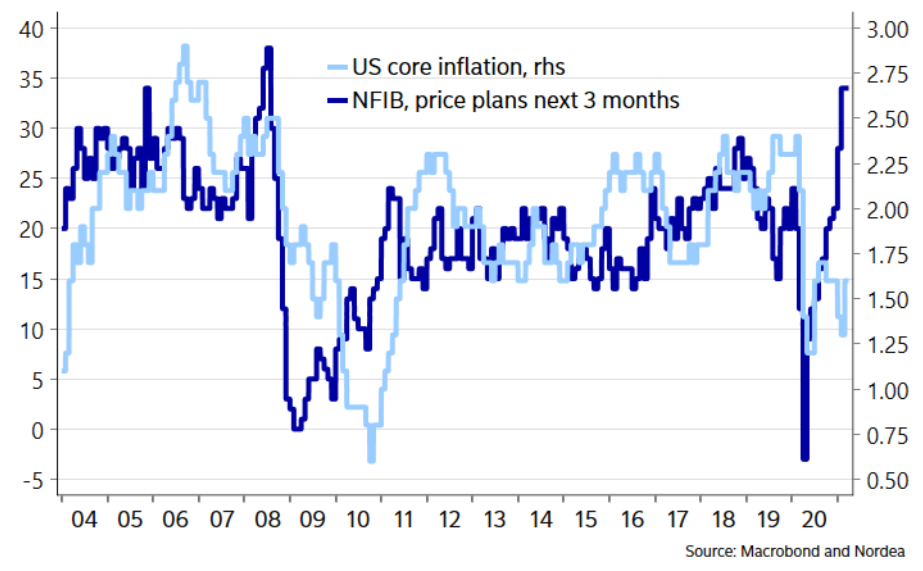
To explain, the dark blue line above tracks NFIB respondents plans to increase/decrease prices, while the light blue line above tracks U.S. core inflation (which excludes food and energy). If you analyze the right side of the chart, notice the large gap? And with the former often leading the latter, bond investors are unlikely to lay down and accept a lower real return.
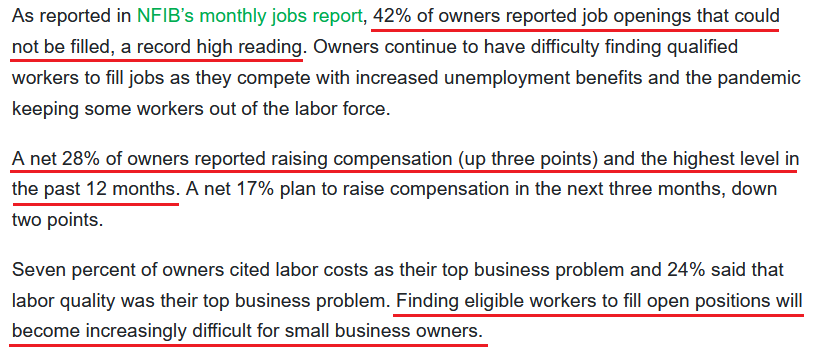
As further evidence, not only are the prices of goods rising, but the NFIB’s latest monthly jobs report (released on Apr. 6) revealed that a record 42% of small businesses are unable to find qualified labor.
Please see below:
 Source: NFIB
And why is all of this important?
Because small businesses’ inability to fill positions leads to increased competition for labor. And with increased competition for labor leading to higher wages, the development erodes small businesses’ profit margins and – you guessed it – results in them raising prices.
Please see below:
To explain, the dark blue line above tracks small businesses’ inability to find qualified labor (record 42% using the scale on the left side of the chart), while the light blue line above tracks their compensation plans (future employee wages). If you analyze the right side of the chart, the material gap has small businesses stuck between a rock and a hard place: either they forgo labor and operate below capacity or they open up their wallets and pay a premium for qualified workers. And if history is any indication, the latter is likely to unfold in the coming months.
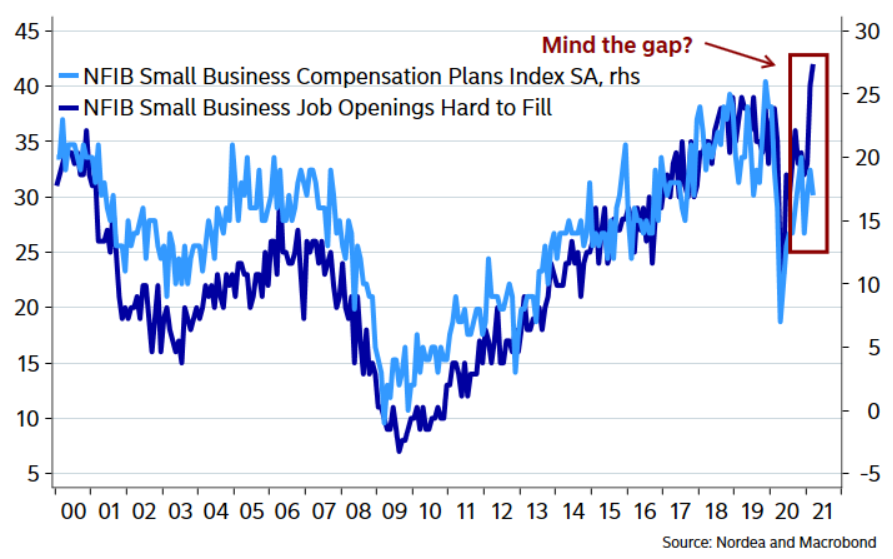
Adding further horsepower to the inflation engine (pun intended), even depreciable assets have gone parabolic. Case in point: the Manheim Used Vehicle Index – compiled from a database of more than five million annual used vehicle transactions – increased by 5.87% month-over-month to a record high 179.2 in March. Furthermore, the pace of the surge is unlike anything that we’ve ever witnessed before.
Please see below:
Continuing the theme, U.S. retail sales (released on Apr. 15) also surged by nearly 10% in March.
Please see below:
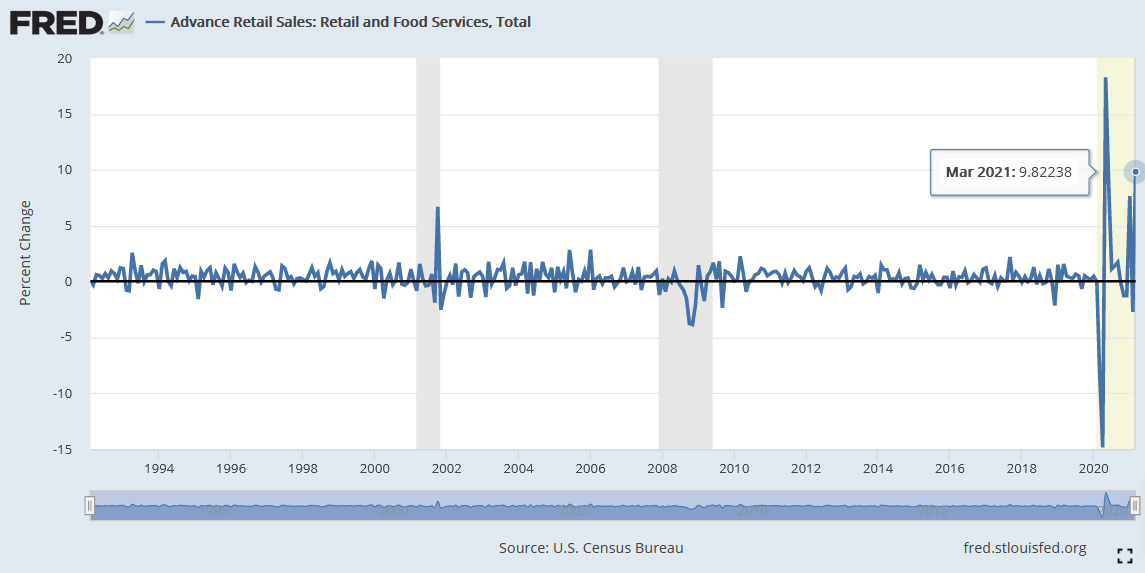
More importantly though, if you exclude the month-over-month (MoM) spike in May 2020 – which had a weak comparable due to the April 2020 lockdowns – the latest reading was the highest MoM percentage increase in nearly 30 years. As a result, when they’re not flowing into the stock market, where do you think all of these stimulus checks are going?
To that point, JPMorgan data also shows that credit card spending is on the up and up.
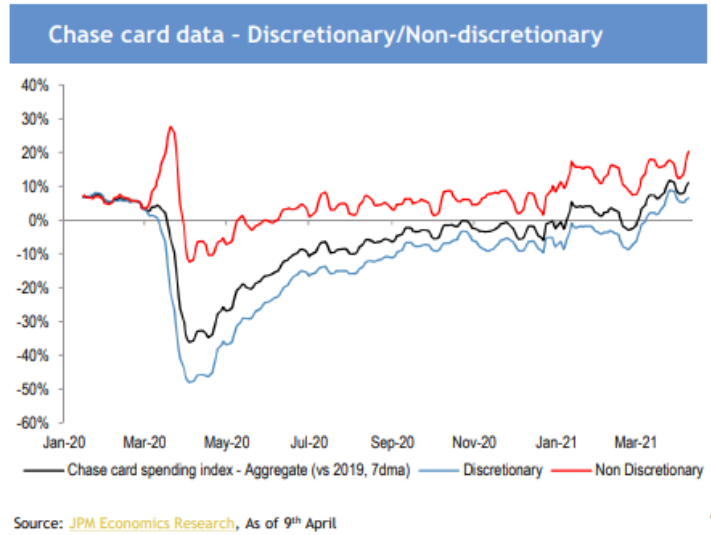
To explain, if you analyze the right side of the chart, notice how discretionary, non-discretionary and the Chase card spending index have all trended higher since Biden signed the $1.90 trillion stimulus package?
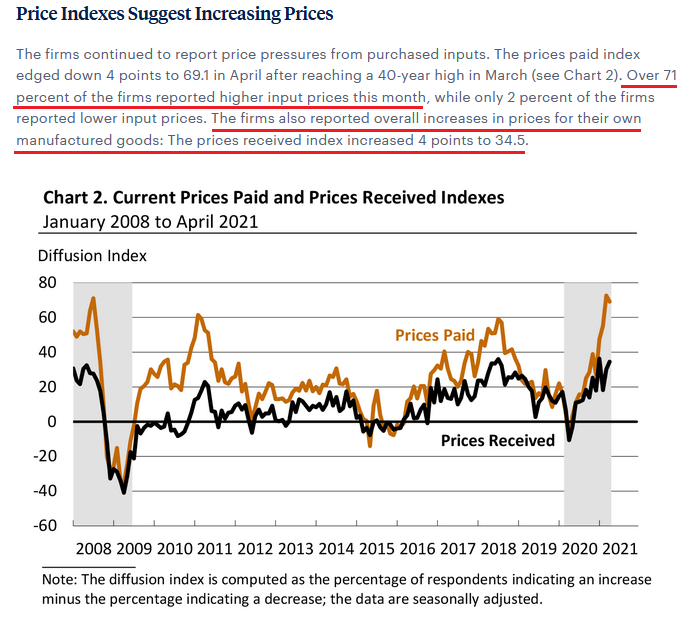
Moreover, as the first shoe to drop, I warned on Mar. 30 that the Philadelphia FED’s Manufacturing Business Outlook Survey (released on Mar. 18) revealed that its prices paid index hit its highest level in more than 40 years.
I wrote:
Notice how prices received tend to follow prices paid? Think about it: with corporations’ decision tree left to raising prices or accepting lower margins, which one do you think they’re likely to choose?
And demonstrating a swift reaction function, on Apr. 15, the latest report showed that while prices paid declined by four points, prices received increased by four points. Thus, with the large gap on the right side of the chart only rivaled by 2010/2011, history implies that higher prices remain the path of least resistance.
 Source: Philadelphia FED
In conclusion, the PMs enjoyed a perfect day on Apr. 15, as everything that could go right, did go right. However, with the USD Index bouncing off of its 50-day moving average and the U.S. 10-Year Treasury yield nearing its 50-day MA, the PMs will have to earn their next move higher. As a result, the easy part of the upswing is likely over, and with investors’ testing the USD Index and the U.S. 10-Year Treasury yield’s mettle, the precious metals will be under similar scrutiny. Moreover, with fundamentals favoring the former, the latter’s synthetic strength will likely end in disappointment.
Overview of the Upcoming Part of the Decline
- It seems likely to me that the corrective upswing was already completed – with gold topping on April 8 – right at its triangle-vertex-based reversal. Consequently, it seems that the next big move lower is already underway.
- After miners slide once again in a meaningful and volatile way, but silver doesn’t (and it just declines moderately), I plan to switch from short positions in miners to short positions in silver (this could take another 1-2 weeks to materialize). I plan to exit those short positions when gold shows substantial strength relative to the USD Index, while the latter is still rallying. This might take place with gold close to $1,450 - $1,500 and the entire decline (from above $1,700 to about $1,475) would be likely to take place within 1-12 weeks and I would expect silver to fall hardest in the final part of the move. This moment (when gold performs very strongly against the rallying USD and miners are strong relative to gold – after gold has already declined substantially) is likely to be the best entry point for long-term investments in my view. This might happen with gold close to $1,475, but it’s too early to say with certainty at this time. In other words, the entire decline could take between 1 and 12 weeks, with silver declines occurring particularly fast in the final 1-2 weeks.
- If gold declines even below $1,500 (say, to ~$1350 or so), then it could take another 10 weeks or so for it to bottom, but this is not what I view as a very likely outcome.
- As a confirmation for the above, I will use the (upcoming or perhaps we have already seen it?) top in the general stock market as the starting point for the three-month countdown. The reason is that after the 1929 top, gold miners declined for about three months after the general stock market started to slide. We also saw some confirmations of this theory based on the analogy to 2008. All in all, the precious metals sector would be likely to bottom about three months after the general stock market tops . If the mid-February 2020 top was the final medium-term top (based on NASDAQ’s top, then it seems that we might expect the precious metals sector to bottom in mid-May or close to May’s end. If, however, the mid-March 2020 top was the final medium-term top (based on the S&P 500), then we might expect the precious metals sector to bottom in mid-June or close to June’s end.
- The above is based on the information available today and it might change in the following days/weeks.
Summary
To summarize, the PMs’ medium-term decline is well underway, and based on the recent performance of the USD Index, gold and mining stocks, it seems that the corrective upswing is already over or about to be over. Based on gold’s triangle-vertex-based reversal it seems that we saw the initial top on Thursday (Apr. 8), and it also appears that we might have seen the final top yesterday (Apr. 15) as the yellow metal reached its very strong resistance at $1,770. The next big move lower seems to be already underway or about to start.
Please note that the lowest daily closing price of November 2020 in gold was $1,780.90, so even today’s pre-market rally doesn’t have to change much. If gold closes the week below the above-mentioned price, there will still be no major breakout in it and the outlook will still remain bearish for the following weeks/months.
In addition, because we’re likely entering the “winter” part of the Kondratiev cycle (just like in 1929 and then the 1930s), the outlook for the precious metals’ sector remains particularly bearish during the very first part of the cycle, when cash is king.
The confirmed breakout in the USD Index is yet another confirmation of the bearish outlook for the precious metals market.
After the sell-off (that takes gold to about $1,450 - $1,500), we expect the precious metals to rally significantly. The final part of the decline might take as little as 1-5 weeks, so it's important to stay alert to any changes.
Most importantly, please stay healthy and safe. We made a lot of money last March and it seems that we’re about to make much more on this March decline, but you have to be healthy to enjoy the results.
As always, we'll keep you - our subscribers - informed.
By the way, we’re currently providing you with a possibility to extend your subscription by a year, two years or even three years with a special 20% discount. This discount can be applied right away, without the need to wait for your next renewal – if you choose to secure your premium access and complete the payment upfront. The boring time in the PMs is definitely over and the time to pay close attention to the market is here. Naturally, it’s your capital, and the choice is up to you, but it seems that it might be a good idea to secure more premium access now, while saving 20% at the same time. Our support team will be happy to assist you in the above-described upgrade at preferential terms – if you’d like to proceed, please contact us.
To summarize:
Trading capital (supplementary part of the portfolio; our opinion): Full speculative short positions (300% of the full position) in mining stocks are justified from the risk to reward point of view with the following binding exit profit-take price levels:
Mining stocks (price levels for the GDXJ ETF): binding profit-take exit price: $24.12; stop-loss: none (the volatility is too big to justify a stop-loss order in case of this particular trade)
Alternatively, if one seeks leverage, we’re providing the binding profit-take levels for the JDST (2x leveraged) and GDXD (3x leveraged – which is not suggested for most traders/investors due to the significant leverage). The binding profit-take level for the JDST: $39.87; stop-loss for the JDST: none (the volatility is too big to justify a SL order in case of this particular trade); binding profit-take level for the GDXD: $94.87; stop-loss for the GDXD: none (the volatility is too big to justify a SL order in case of this particular trade).
For-your-information targets (our opinion; we continue to think that mining stocks are the preferred way of taking advantage of the upcoming price move, but if for whatever reason one wants / has to use silver or gold for this trade, we are providing the details anyway.):
Silver futures upside profit-take exit price: unclear at this time - initially, it might be a good idea to exit, when gold moves to $1,512.
Gold futures upside profit-take exit price: $1,512.
Long-term capital (core part of the portfolio; our opinion): No positions (in other words: cash
Insurance capital (core part of the portfolio; our opinion): Full position
Whether you already subscribed or not, we encourage you to find out how to make the most of our alerts and read our replies to the most common alert-and-gold-trading-related-questions.
Please note that we describe the situation for the day that the alert is posted in the trading section. In other words, if we are writing about a speculative position, it means that it is up-to-date on the day it was posted. We are also featuring the initial target prices to decide whether keeping a position on a given day is in tune with your approach (some moves are too small for medium-term traders, and some might appear too big for day-traders).
Additionally, you might want to read why our stop-loss orders are usually relatively far from the current price.
Please note that a full position doesn't mean using all of the capital for a given trade. You will find details on our thoughts on gold portfolio structuring in the Key Insights section on our website.
As a reminder - "initial target price" means exactly that - an "initial" one. It's not a price level at which we suggest closing positions. If this becomes the case (like it did in the previous trade), we will refer to these levels as levels of exit orders (exactly as we've done previously). Stop-loss levels, however, are naturally not "initial", but something that, in our opinion, might be entered as an order.
Since it is impossible to synchronize target prices and stop-loss levels for all the ETFs and ETNs with the main markets that we provide these levels for (gold, silver and mining stocks - the GDX ETF), the stop-loss levels and target prices for other ETNs and ETF (among other: UGL, GLL, AGQ, ZSL, NUGT, DUST, JNUG, JDST) are provided as supplementary, and not as "final". This means that if a stop-loss or a target level is reached for any of the "additional instruments" (GLL for instance), but not for the "main instrument" (gold in this case), we will view positions in both gold and GLL as still open and the stop-loss for GLL would have to be moved lower. On the other hand, if gold moves to a stop-loss level but GLL doesn't, then we will view both positions (in gold and GLL) as closed. In other words, since it's not possible to be 100% certain that each related instrument moves to a given level when the underlying instrument does, we can't provide levels that would be binding. The levels that we do provide are our best estimate of the levels that will correspond to the levels in the underlying assets, but it will be the underlying assets that one will need to focus on regarding the signs pointing to closing a given position or keeping it open. We might adjust the levels in the "additional instruments" without adjusting the levels in the "main instruments", which will simply mean that we have improved our estimation of these levels, not that we changed our outlook on the markets. We are already working on a tool that would update these levels daily for the most popular ETFs, ETNs and individual mining stocks.
Our preferred ways to invest in and to trade gold along with the reasoning can be found in the how to buy gold section. Furthermore, our preferred ETFs and ETNs can be found in our Gold & Silver ETF Ranking.
As a reminder, Gold & Silver Trading Alerts are posted before or on each trading day (we usually post them before the opening bell, but we don't promise doing that each day). If there's anything urgent, we will send you an additional small alert before posting the main one.
Thank you.
Przemyslaw Radomski, CFA
Founder, Editor-in-chief

