
tools spotlight

-
Gold Miners: Celebration Time
August 11, 2021, 6:06 AMAnother day, another decline in junior miners – and another increase in profits from short positions in them. Shouldn’t we expect a rebound though?
Well, no. The rebound already happened in late July and early August, and what we see now is the trend being resumed. Consequently, even if it wasn’t for all the long-term analogies to the 2012-2013 declines in gold and gold stocks (HUI Index), one should expect the current short-term decline to be significantly bigger than the counter-trend upswing which ended earlier this month. At this time, the move lower is just somewhat bigger than the preceding rally. Thus, it’s not excessive and can easily continue.
However, let’s keep in mind that periods of very high volatility usually need to be followed by periods of relatively low volatility. That’s when investors verify if the “new reality” – the price levels after the decline – are justified or not. If the market votes “no”, we get huge rebounds and breakdowns’ invalidations. So far this week, the markets have been voting “yes”.
Consequently, the current back-and-forth trading is perfectly normal, and it’s in tune with what I wrote in the previous days – even in the case of the details. While the precious metals are taking a breather, the gold mining stocks continue to decline, but in a steadier manner. That’s what happened earlier this year (in February and in late-June / early-July 2021) and during the 2013 slide.
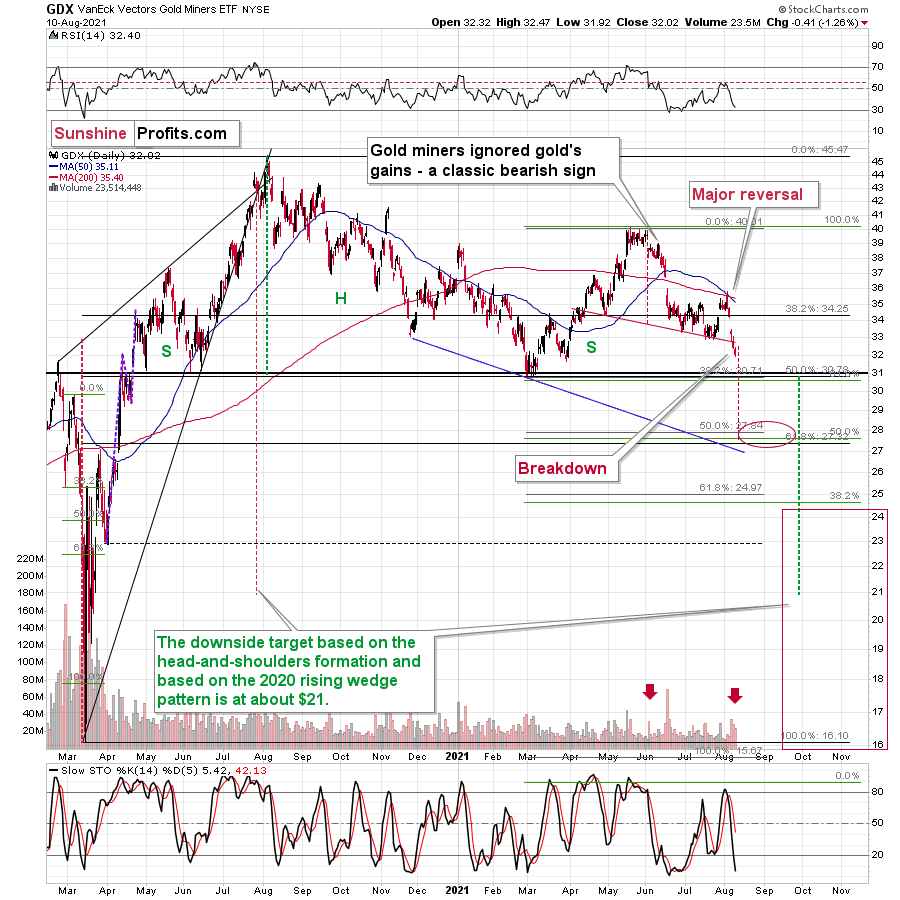
While a steady decline might not get as many heads turning as big daily slides, it also serves a very important purpose. You see, the mining stocks (GDX includes both: gold stocks and silver stocks) are now verifying the breakdown below the neck level of the head and shoulders pattern. Once this breakdown is verified (just one more daily close is needed), miners will be likely to fall much lower, as the target resulting from this formation is based on the size of its head. In this case, it implies a move to about $28.
In the case of the junior gold miners, the situation is even more bearish, as they just moved below the previous yearly lows, and they are confirming the breakdown.
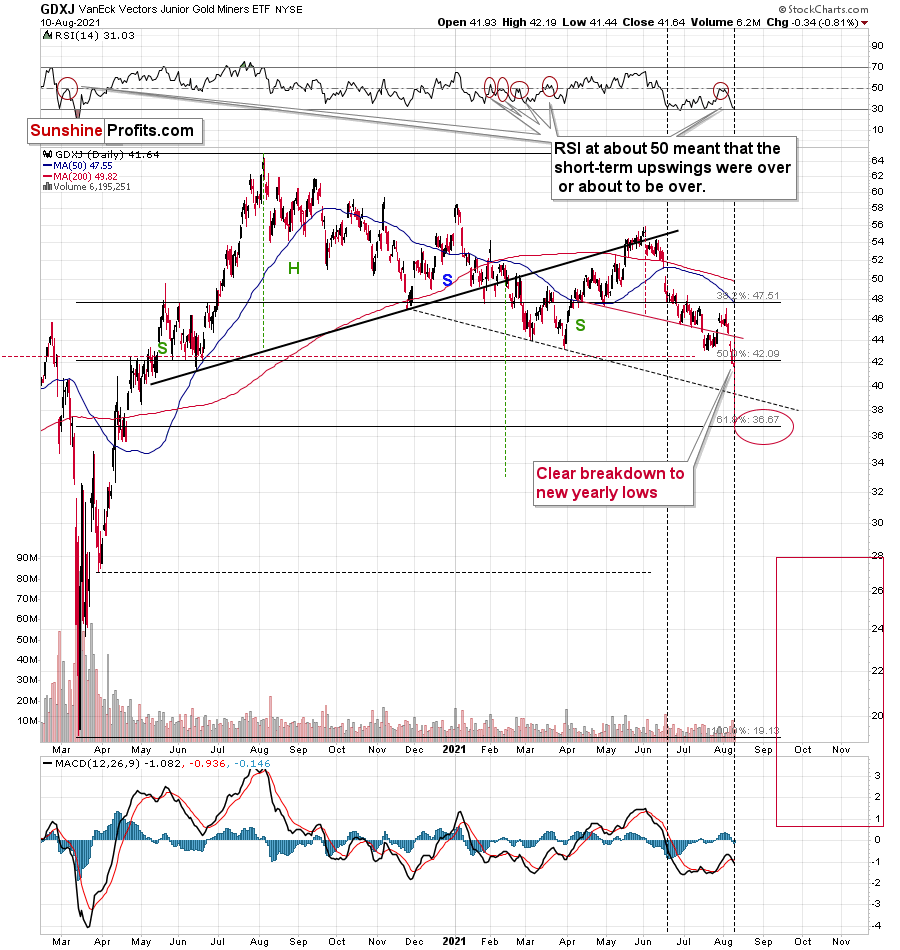
Please note how the junior miners lost their momentum right after declining on relatively big volume. In yesterday’s analysis (Aug. 10), I commented on junior miners’ breakdown in the following way:
This move was not yet confirmed, but with the significant volume on which it took place, it looks quite believable. Therefore, it wouldn’t be surprising to see a few days of consolidation before senior miners move much lower.
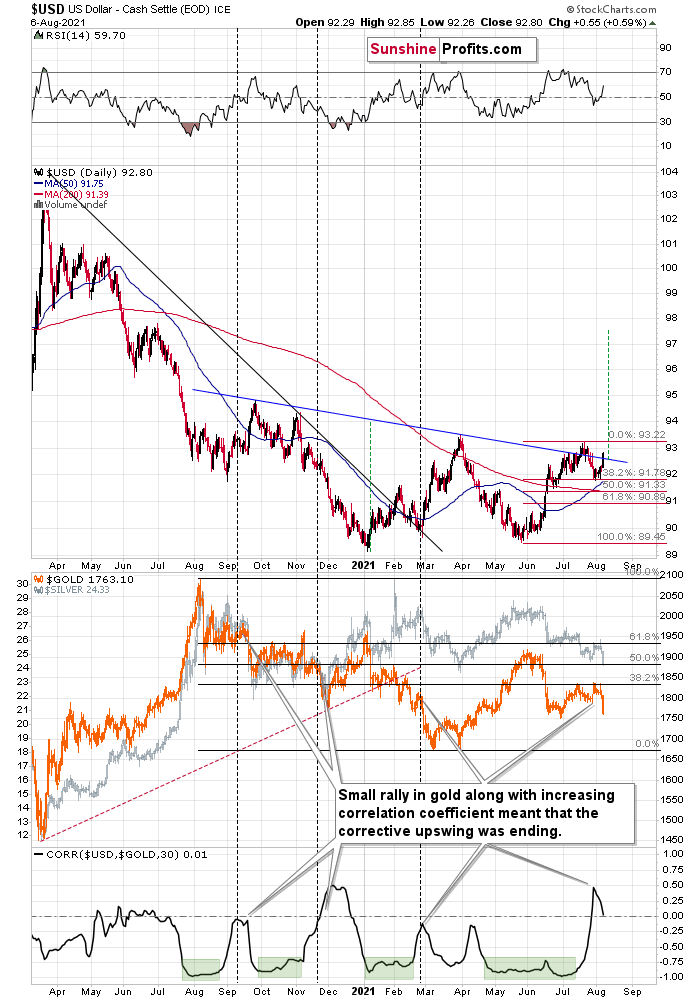
As I wrote earlier today, gold and silver were not doing much yesterday (and in today’s pre-market trading at the moment of writing these words), but it’s a perfectly normal phenomenon.
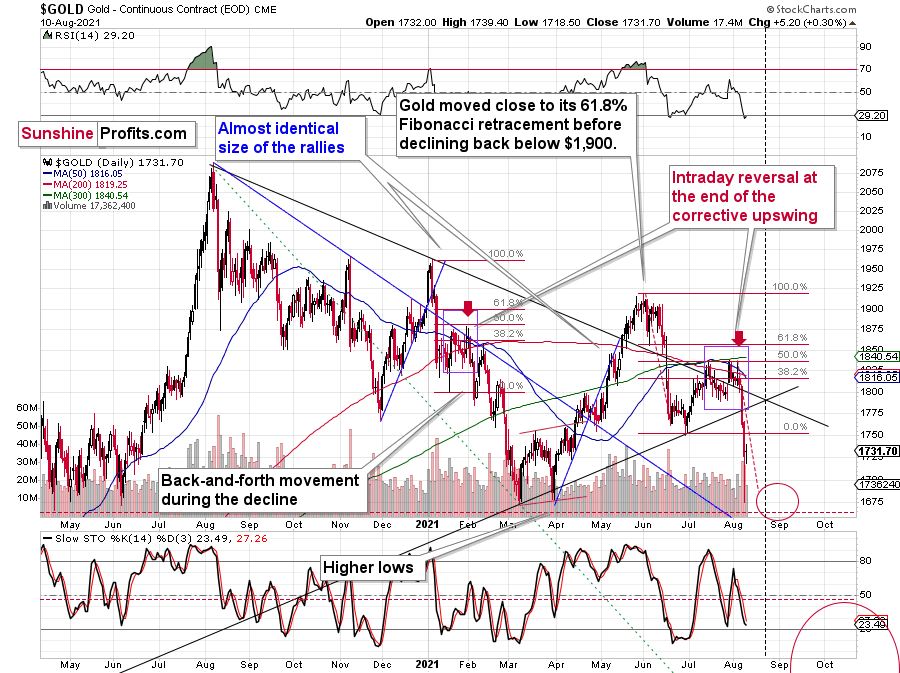
In fact, if gold moves back to the previously broken lows at about $1,750, it won’t invalidate the bearish narrative.
The Most Powerful Tool – Self-Similarity
Gold has a triangle-vertex-based reversal close to the end of the next week, which means that it could continue to consolidate or move a bit higher in the next several days, and then slide once again. Please note that this would make the current decline very similar in terms of its pace to the decline that we saw in June. While the moves don’t have to be identical, the gold price quite often moves in similar patterns – I’ve seen this many times in the past decade (and beyond). For example, please note how similar the short-term declines that we saw between August 2020 and December 2020 were.
And while gold is consolidating after breaking below its June lows, the GDX is doing so after breaking below the neck level of the head-and-shoulders pattern and the GDXJ is trading sideways after breaking to new yearly lows, silver is also consolidating after a breakdown to new yearly lows.
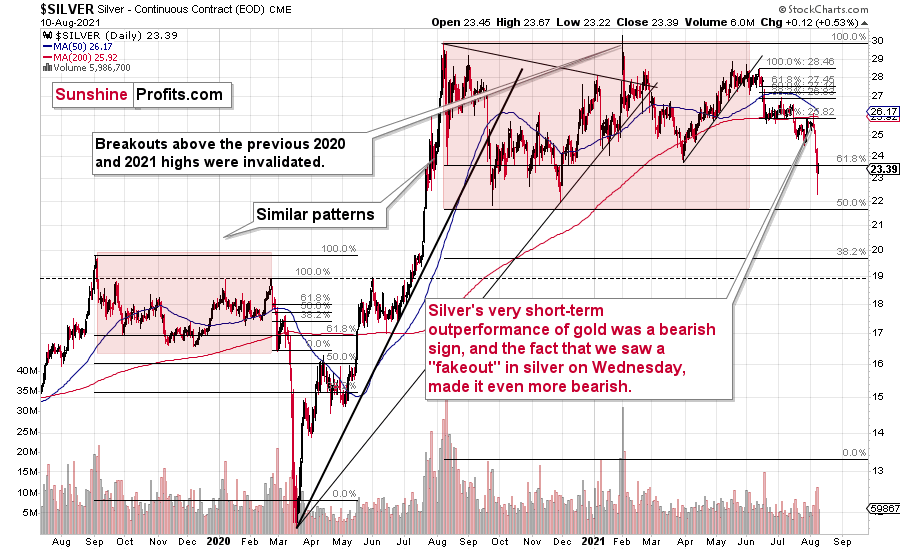
Unless silver manages to soar back above the March lows shortly (and it seems unlikely that it does), it will be likely to fall profoundly once again soon.
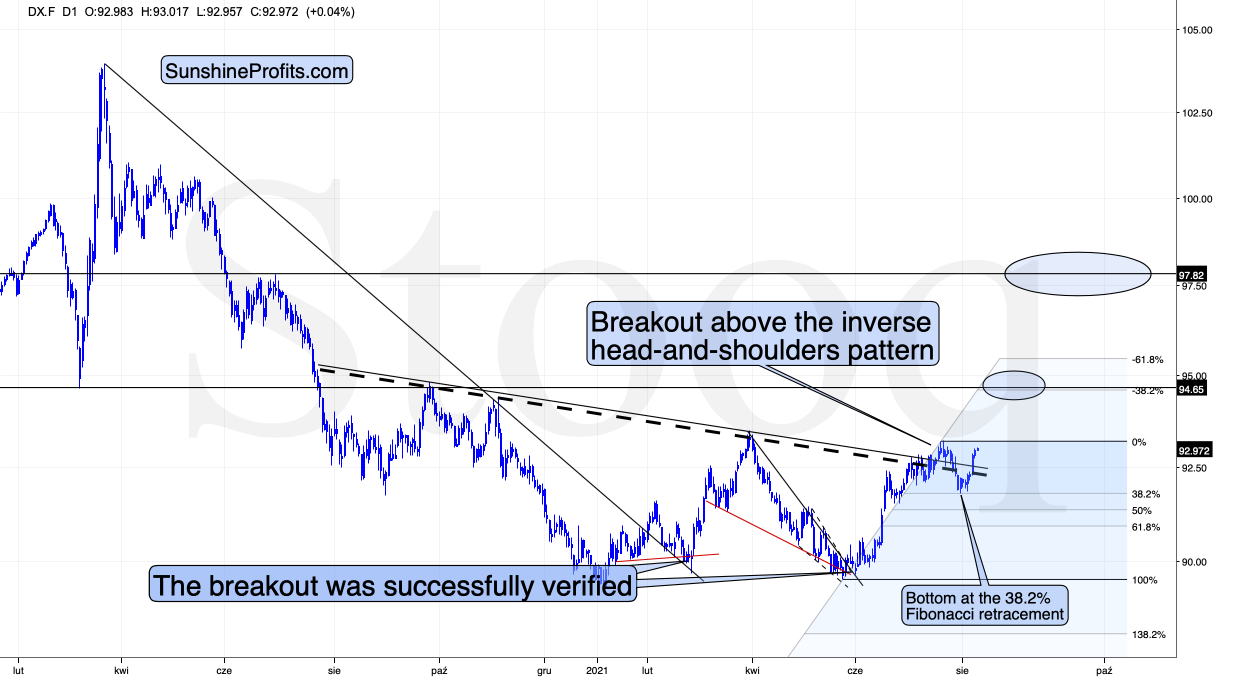
The inverse of the above is likely the USD Index, which is verifying its second attempt to break above its inverse head-and-shoulders pattern.
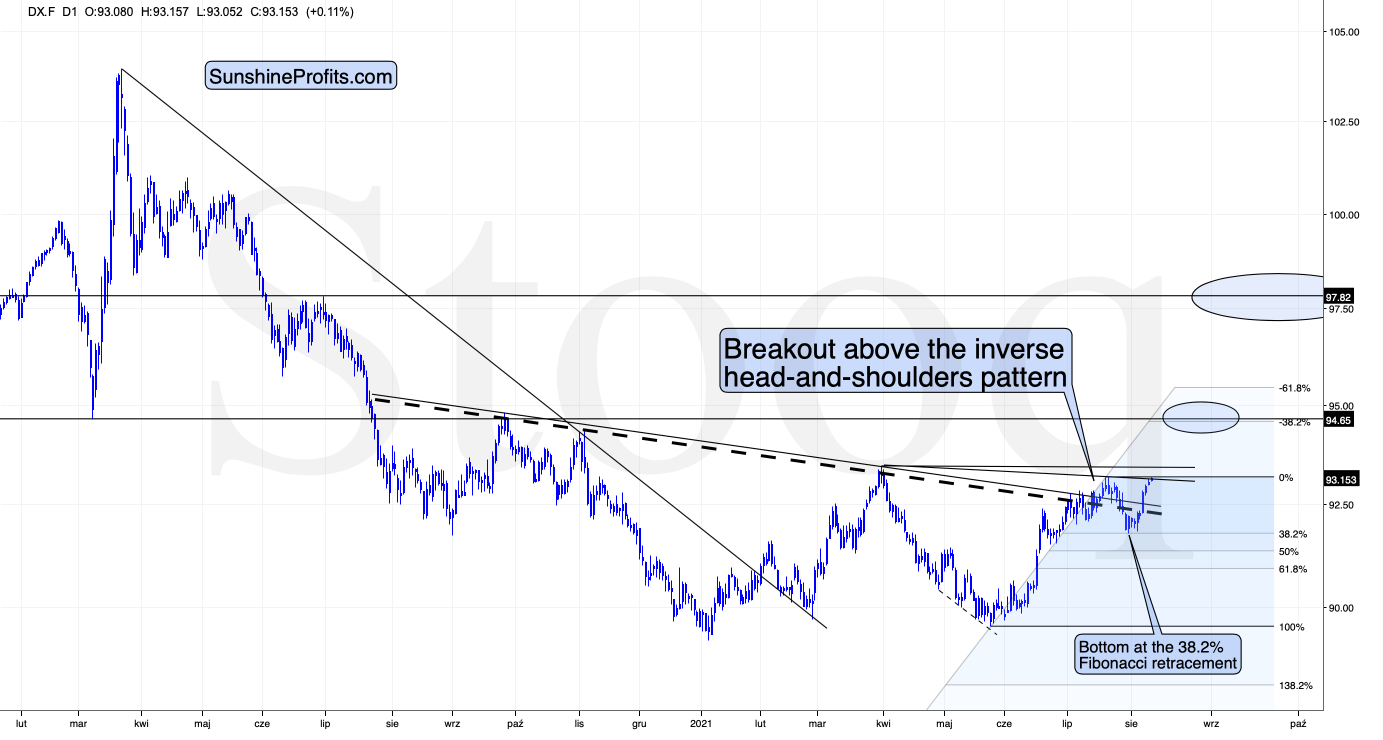
The August 2020 highs are the next short-term resistance for the USD Index, but I don’t expect it to decline significantly from there. Instead, it seems to me that the USDX will rally to almost 98 based on the inverse H&S pattern, and then it might consolidate.
So, while the USD Index and the precious metals market might consolidate for a few days (or even up to two weeks), they are likely to continue their most recent sizable moves shortly thereafter. Consequently, while I can’t make any promises with regard to the performance of any asset, it seems that the profits on the short positions in junior miners are going to increase substantially in the coming weeks.
Thank you for reading our free analysis today. Please note that the above is just a small fraction of the full analyses that our subscribers enjoy on a regular basis. They include multiple premium details such as the interim targets for gold and mining stocks that could be reached in the next few weeks. We invite you to subscribe now and read today’s issue right away.
Sincerely,
Przemyslaw Radomski, CFA
Founder, Editor-in-chief -
Gold Miners: What's Supersized Tastes the Best
August 10, 2021, 8:13 AMWho doesn’t want enlarged fries along with a delicious burger? Everything tasty comes in bundles – and the recent decline in gold was luscious.
The Greatest Show
Ladies and gentlemen, we have a breakdown! Junior miners have just broken to new yearly lows, which means that everyone who joined us in the short position in the junior miners this year is now profitable (if they kept their position intact, that is). In fact, everyone who joined the trade in the past 12 months is profitable as well. In many cases, the profits are already huge.
And the best part is that this move is just getting started! That’s what the long-term HUI Index chart and long-term gold charts tell us. I went over both in detail in yesterday’s flagship Gold & Silver Trading Alert, so I don’t want to go through them once again today. I want, however, to make sure that the context of the breakdown to new yearly lows in the GDXJ is clear: this is not the end of the move, but a confirmation that its key (and the most profitable) part has just started.
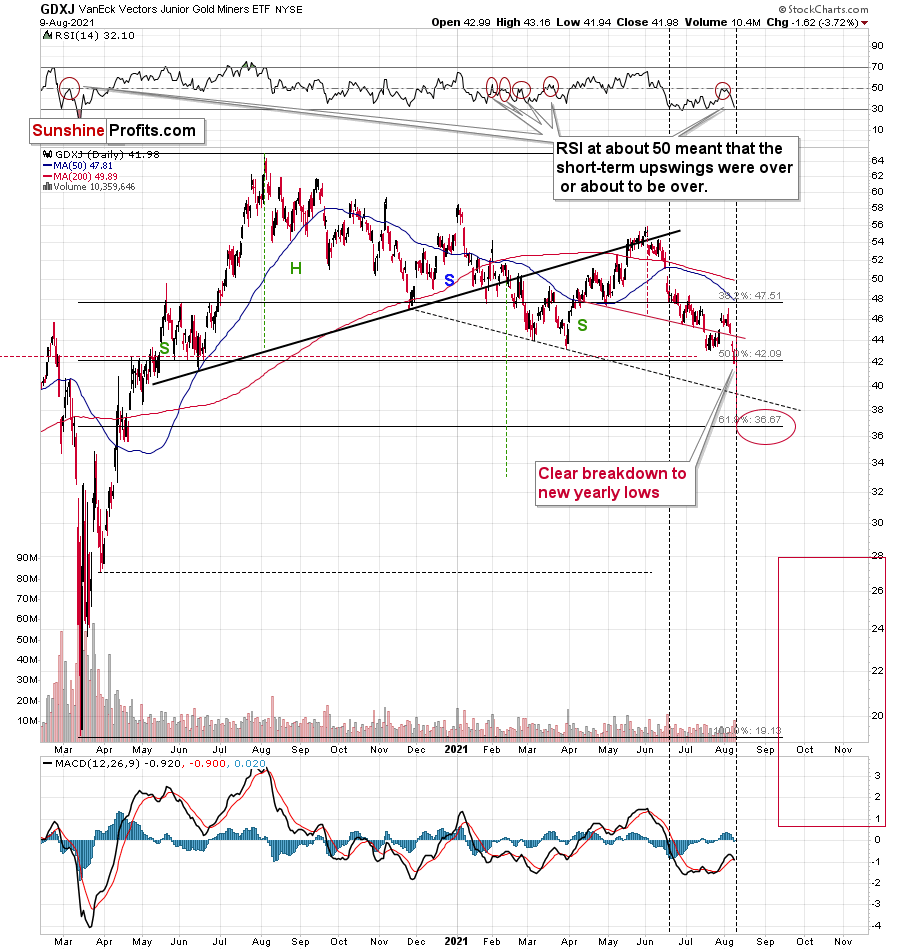
The volume on which yesterday’s decline took place was significant enough to confirm the validity of the breakdown. However, I wouldn’t be myself if I didn’t check what happened when we previously saw a boost in the volume levels. I marked it with vertical dashed lines, and as you can see on the above chart, we saw the same thing in mid-June. We also saw the RSI indicator move relatively close to 30 then.
Some might view this as a sign of a reversal, but history suggests otherwise. Back in mid-June, there was a slight pause which was then followed by more declines, and a short-term bottom almost a month later. While it seems that we might see the next short-term bottom sooner, the key takeaway remains intact – the possible bullish indications that might appear to be important at first sight are actually nonexistent. Thus, the profits on the short positions are likely to become much bigger in the upcoming weeks.

Senior miners (GDX) didn’t decline as much as the GDXJ, and, unlike the latter, they didn’t move to new yearly lows. But they did something important from the technical point of view. Namely, the GDX ETF broke below the neck level of its head-and-shoulders pattern.
This move was not yet confirmed, but with the significant volume on which it took place, it looks quite believable. Therefore, it wouldn’t be surprising to see a few days of consolidation before senior miners move much lower.
In fact, gold has been consolidating so far in today’s pre-market trading, doing almost nothing.
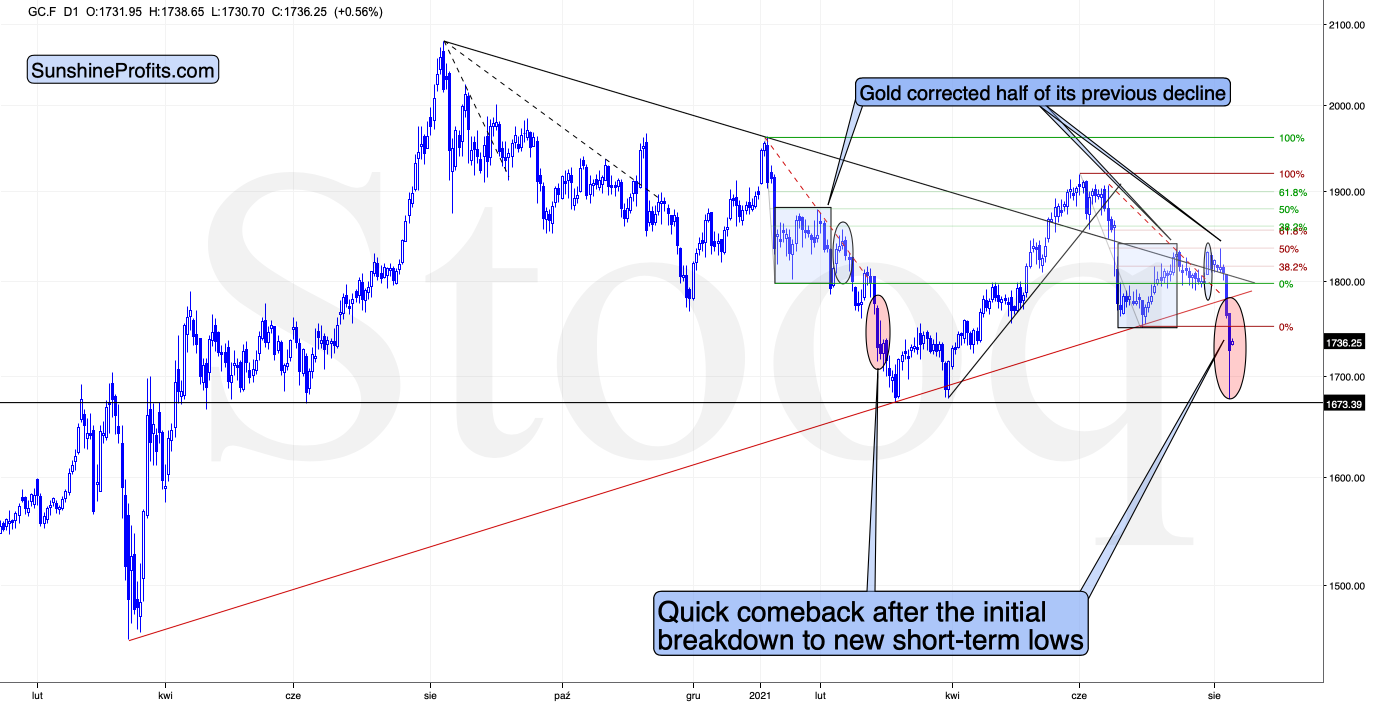
Gold is a few dollars higher, which is actually more bearish than bullish as far as the immediate term is concerned. Why? Because if the recent move lower was fake, gold would be likely to rally without looking back. Remember silver’s fake-out just a few days ago? Silver didn’t hesitate before declining shortly thereafter. So, the fact that gold is up by only a few dollars is actually bearish, as it’s less bullish price action than what one would expect if the recent decline was fake / temporary.
This means that the scenario that I outlined yesterday remains very much up-to-date:
I previously wrote multiple times that the gold market seems to really want to decline, and what happened over the last few trading days shows you that the market agreed with me.
Now, the shape of today’s pre-market movement might be concerning, as it’s ultimately a huge intraday reversal – at least so far. And intraday reversals tend to be bullish. Should we view the current movement as bullish then?
No.
As always, context is important. And this time, the context is provided by two similar situations: one from February and one from June. Back in February (marked with a red ellipse), when gold was right after a breakdown below the previous lows, it moved back up quickly after the initial slide. This didn’t mean that the decline ended. Consequently, seeing something similar this time shouldn’t make one think that the decline is over.
The most recent case when gold plunged was the fall in June. That’s when the yellow metal declined below $1,800. Right after the most volatile part of the decline, it moved back up, but that was not the true bottom. Gold continued to move lower after a quick breather, and it bottomed less than two weeks later.
All in all, based on both the above-mentioned analogies and on the triangle-vertex-based reversal, it seems quite likely that we’ll see a short-term bottom in the PMs and miners in the second half of August.
Also, let’s keep in mind that while gold corrected in June, junior gold miners really didn’t – they declined in a much steadier manner.
And speaking of silver, please note that despite yesterday’s correction, silver didn’t invalidate its breakout to new yearly lows.
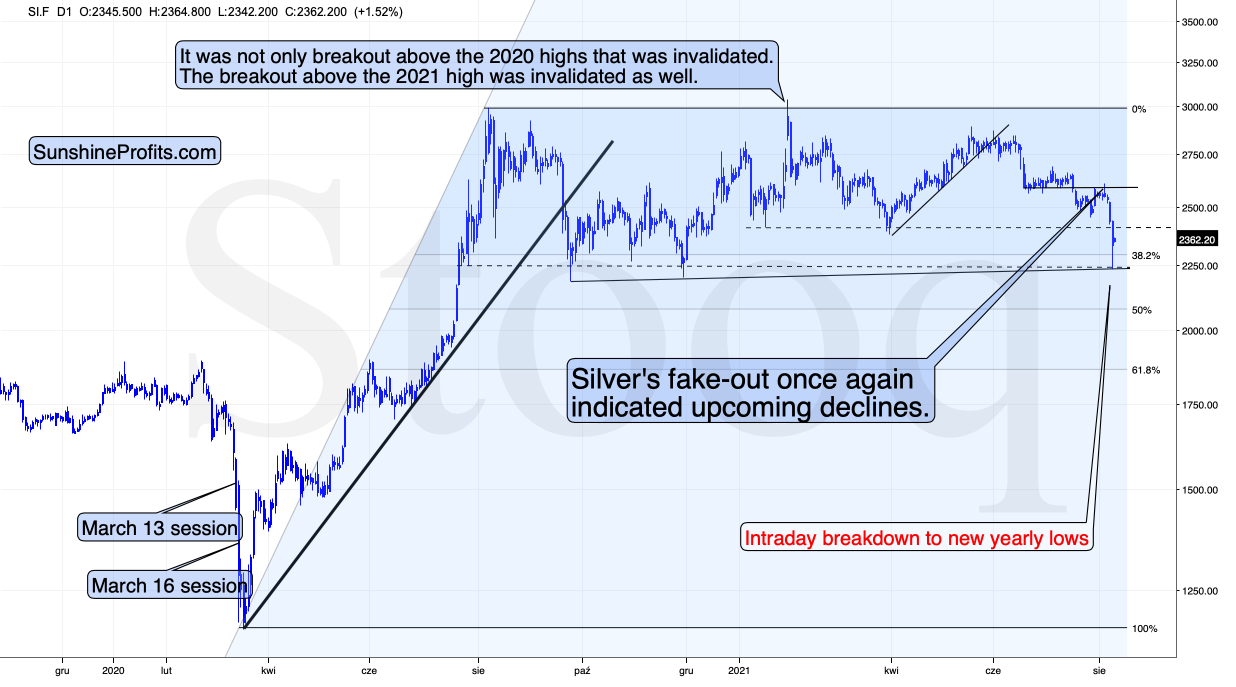
Consequently, my yesterday’s comments on silver remain up-to-date:
While silver already moved to its support lines and then bounced back up, it doesn’t mean that the final medium-term bottom is in.
The move lower was volatile, and the support provided by the previous lows was strong. Consequently, a quick rebound here is quite natural.
Why isn’t silver likely to rally once again to $30 or so before declining (or not to decline at all)? Because of all the reasons that I wrote due to which gold is likely to decline. The white metal is unlikely to move completely independently of the yellow one. Instead, it’s likely to magnify its declines in their final parts. Besides, let’s keep in mind silver’s long-term cycle that I discussed earlier today.
The Dollar’s Importance
There are many very good reasons to expect continued declines in the precious metals; the breakout above the inverse head-and-shoulders pattern in the USD Index is one of them.
The August 2020 highs are the next short-term resistance for the USD Index, but I don’t expect it to decline significantly from there. Instead, it seems to me that the USDX will rally to almost 98 based on the inverse H&S pattern, and then it might consolidate.
The recent invalidation of the pattern was fake, similar to the fake nature of the pullback that we saw in 2014 – right before the USD’s massive upswing.
After all, they both took place in the middle of the year.
Let’s not forget that gold has been declining for a year now, and it has been doing so while the USD Index was declining (mostly). If the gold market was so weak that it declined despite the factor that should normally make it rally, then just think how significantly it will decline when the USD Index finally does rally in a meaningful way.
Gold / Silver Trade Info
In the previous weeks, I’ve been featuring a specific section in the description of my thoughts about one’s trading capital. It stated:
For-your-information targets (our opinion; we continue to think that mining stocks are the preferred way of taking advantage of the upcoming price move, but if for whatever reason one wants / has to use silver or gold for this trade, we are providing the details anyway.):
Silver futures upside profit-take exit price: unclear at this time - initially, it might be a good idea to exit when gold moves to $1,683
Gold futures upside profit-take exit price: $1,683
Now, since gold touched this level yesterday, if one’s profits on the short positions in gold and/or silver were realized (congratulations!), I think that re-entering those positions is justified from the risk to reward point of view right now, with the same profit-take price. Naturally, I prefer to be shorting junior gold miners than gold or silver at this time, but if the reason due to which one couldn’t enter a short position in the junior miners is still intact, re-entering the short position in gold and/or silver would be justified from the risk to reward point of view (at least in my view).
Thank you for reading our free analysis today. Please note that the above is just a small fraction of the full analyses that our subscribers enjoy on a regular basis. They include multiple premium details such as the interim targets for gold and mining stocks that could be reached in the next few weeks. We invite you to subscribe now and read today’s issue right away.
Sincerely,
Przemyslaw Radomski, CFA
Founder, Editor-in-chief -
Gold Slides Massively – Be Ready For More!
August 9, 2021, 7:25 AMWhat a week! Gold has dropped almost $60 since Friday, and silver came along reaching new yearly lows! Are you prepared for a wild ride downwards?
The USD Index (USDX)
While many investors forecasted a sharp decline in the USD Index, I warned on Aug. 2 that the stars were aligning for the greenback. And with gold, silver and mining stocks exhibiting strong negative correlations with the U.S. dollar, the latter’s rise could result in the former’s demise.
I wrote:
With the USD Index demonstrating late-week strength and bouncing off of the 38.2% Fibonacci retracement level, the greenback may have recorded a short-term bottom. In both 2008 and 2014, small moves lower solidified the USD Index’s short-term bottoms and remarkable rallies followed. In fact, the rapid reversals in both cases occurred with RSIs near 50 (close to the current reading of 53.32) and it’s likely a matter of when, not if, the greenback records a significant upward re-rating. The bottom line? The PMs will likely bear the brunt of the USD Index’s forthcoming strength.
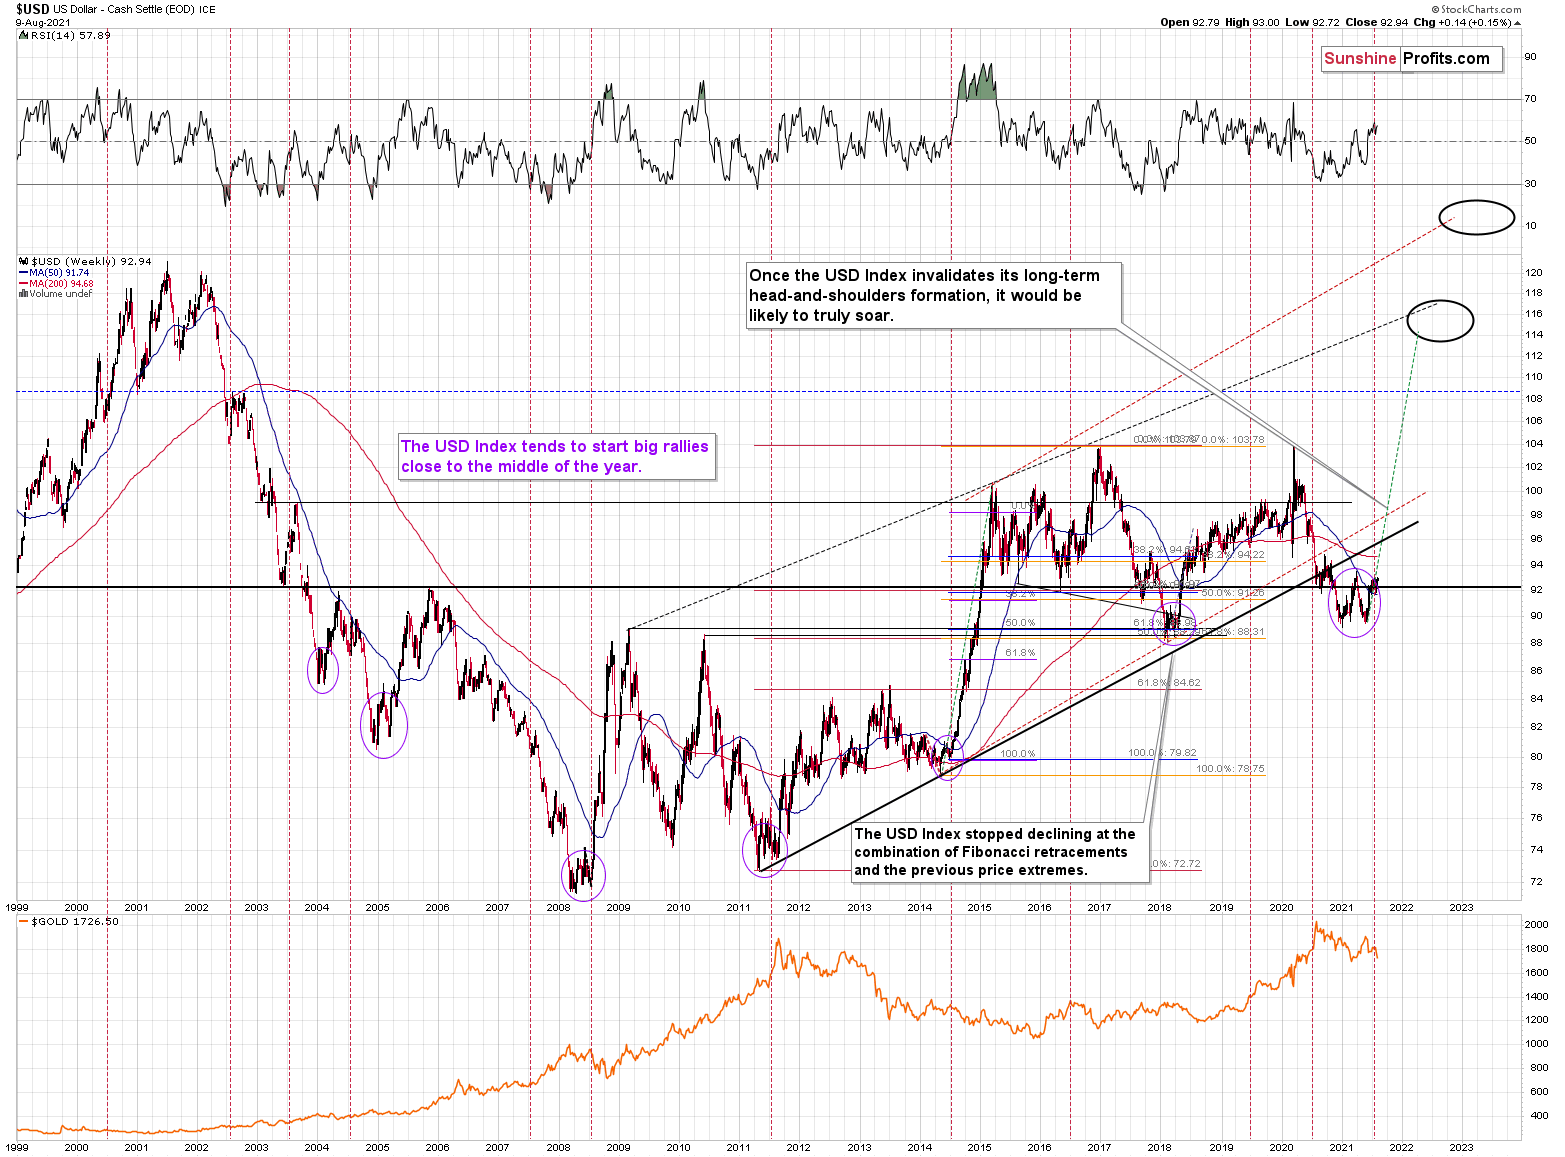
And after the USD Index soared back above the neckline of its inverse (bullish) head & shoulders pattern last week – and caused gold, silver and mining stocks to plunge in the process – the USDX remains poised to recapture ~98 over the medium term.
Please see below:
To explain, the USD Index often sizzles in the summer sun and major USDX rallies often start during the middle of the year. For example, summertime spikes have been mainstays on the USD Index’s historical record and in 2004, 2005, 2008, 2011, 2014 and 2018, a retest of the lows (or close to them) occurred before the USD Index began its upward flights.
What’s more, profound rallies (marked by the red vertical dashed lines below) followed in 2008, 2011 and 2014. And with the current situation mirroring the latter, a small consolidation on the long-term chart is exactly what occurred before the USD Index surged in 2014. Likewise, the USD Index recently bottomed near its 50-week moving average; an identical development occurred in 2014. More importantly, though, with bottoms in the precious metals market often occurring when gold trades in unison with the USD Index (after ceasing to respond to the USD’s rallies with declines), we’re still far away from that milestone in terms of both price and duration.
Please see below (quick reminder: you can click on the chart to enlarge it):
Just as the USD Index took a breather before its massive rally in 2014, it seems that we saw the same recently. This means that predicting higher gold prices here is likely not a good idea.
As further evidence, the eye in the sky doesn’t lie. And with the USDX’s long-term breakout clearly visible, the smart money is already backing the greenback.
Please see below:
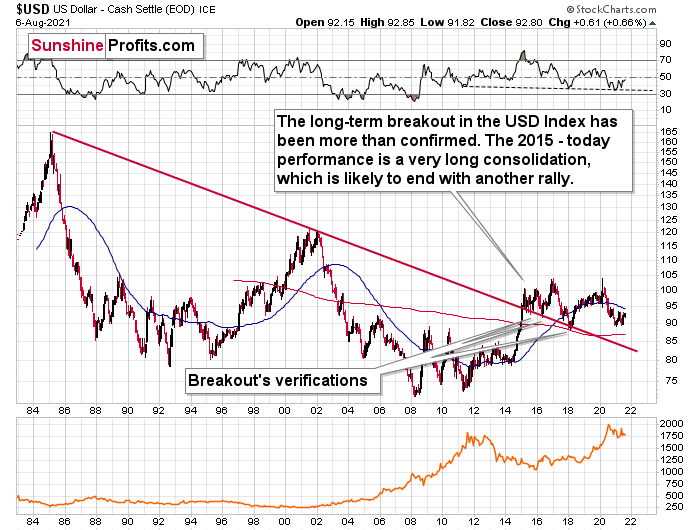
The bottom line?
Once the momentum unfolds, ~94.5 is likely the USD Index’s first stop, ~98 is likely the next stop, and the USDX will likely exceed 100 at some point over the medium or long term. Keep in mind though: we’re not bullish on the greenback because of the U.S.’ absolute outperformance. It’s because the region is fundamentally outperforming the Eurozone, the EUR/USD accounts for nearly 58% of the movement of the USD Index, and the relative performance is what really matters.
In conclusion, the USD Index’s comeback dropped the guillotine on gold, silver and mining stocks, and with the GDXJ ETF (profits on our short position here increased further) also plunging by more than 5% last week, the greenback is having a profound impact on the precious metals. Moreover, with the latter also pressured by rising interest rates and the Fed’s increasingly hawkish rhetoric, lower lows are likely to materialize over the medium term. However, with robust fundamentals signaling a significant comeback over the long term, we eagerly await the opportunity to go long the precious metals once again.
Thank you for reading our free analysis today. Please note that the above is just a small fraction of the full analyses that our subscribers enjoy on a regular basis. They include multiple premium details such as the interim targets for gold and mining stocks that could be reached in the next few weeks. We invite you to subscribe now and read today’s issue right away.
Sincerely,
Przemyslaw Radomski, CFA
Founder, Editor-in-chief -
Inflation: Some Say Its a Supply Shock but… Is It?
August 6, 2021, 9:13 AMA supply shock occurs when a lack of inventories is the reason for rising prices. But then inflation would be similar in all regions… and it’s not.
Contrary to Popular Opinion
With the U.S. 10-Year Treasury yield inching higher in recent days, the boom-or-bust economic narrative has the Treasury benchmark on the wrong side of optimism. However, it’s important to remember that the U.S. 10-Year Treasury yield still trades at an all-time low relative to realized inflation.
To explain, I wrote previously:
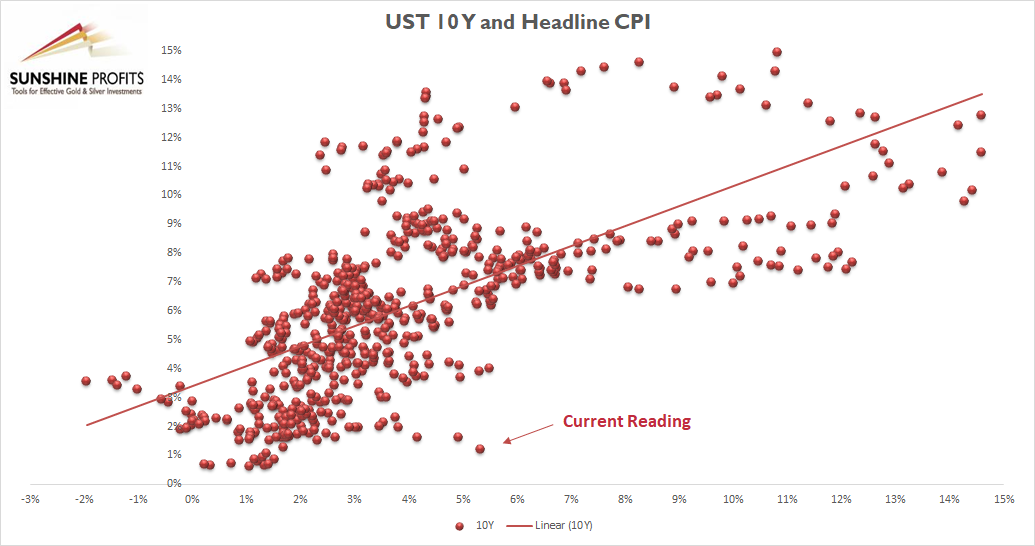
The scatterplot above depicts the relationship between the headline Consumer Price Index (CPI) and the U.S. 10-Year Treasury yield (available data dates back to 1967). For context, the headline CPI is plotted on the horizontal axis, while the U.S. 10-Year Treasury yield is plotted on the vertical axis. If you analyze the dot labelled “Current Reading,” you can see that the U.S. 10-Year Treasury yield has never been lower when the headline CPI has risen by 5% or more year-over-year (YoY). In fact, even if the headline CPI declined to the FED’s 2% YoY target, the U.S. 10-Year Treasury yield at 1.22% would still be the lowest relative reading of all time.
Thus, while investors have left the long end of the U.S. yield curve for dead, Citigroup forecasted a rebirth on Aug. 4. To explain, Citigroup’s rates strategists told clients that the U.S. 10-Year Treasury yield should reach 2% in the coming months.
Please see below:
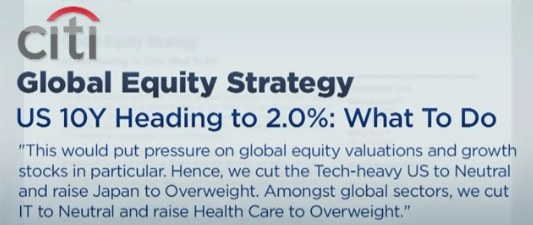
Tilting the scale, Citigroup noted that Treasury tax collection in June left the federal government flush with cash and resulted in only $94 billion of new Treasury issuance. In the process, with the U.S. Federal Reserve (FED) buying $80 billion of the $94 billion in new notes, distortion prevailed across the Treasury market.
What’s more, Citigroup’s chief U.S. equity strategist Tobias Levkovich told Bloomberg on Aug. 4 that the bank expects interest rate sensitive assets to come under pressure in the coming months. For context, the PMs are highly allergic to rising interest rates. He said:
“Bond yields have had an enormous impact on how you think about growth versus value. Central banks globally have been keeping suppressed rates really since 2008. That suggests they don’t have confidence in long-term, sustainable, durable growth. The U.S. is a heavy growth market. If you believe bond yields are going to edge higher, then growth stocks are going to take it a little bit on the chin.”
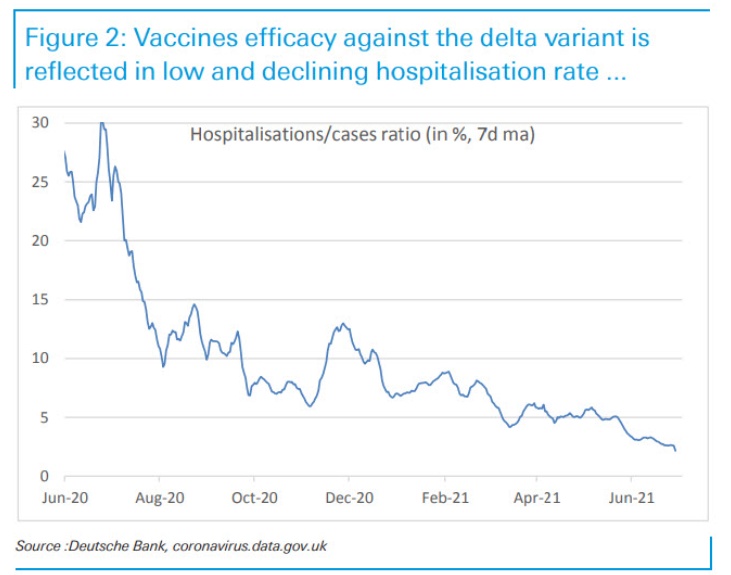
As another factor depressing U.S. Treasury yields, the spread of the Delta variant elicits fears of an economic slowdown. And with the FED’s prospective taper increasing the anxiety, the narrative has shifted to slower growth, lower inflation, and, eventually, a reenactment of the FED cutting interest rates. However, while cases surge and the panic intensifies, U.K. hospitalizations as a percentage of cases (the U.K. has been hard-hit by the Delta variant) have actually declined.
Please see below:
On top of that, IHS Markit also released its U.S. services PMI on Aug. 4. And while the headline index declined from 64.6 in June to 59.9 in July, the report revealed:
“New business continued to rise in July, and at one of the fastest rates since data collection began in October 2009. The upturn was supported by a pick-up in client demand following vaccinations and the relaxation of COVID-19 restrictions. The robust expansion was one of the quickest in over three years despite softening to the slowest since February.”
And while services have been a major laggard – due to coronavirus-related restrictions on social/in-person activity – inflation is still moving higher.
Please see below:
 Source: IHS Markit
Circling Back to Inflation
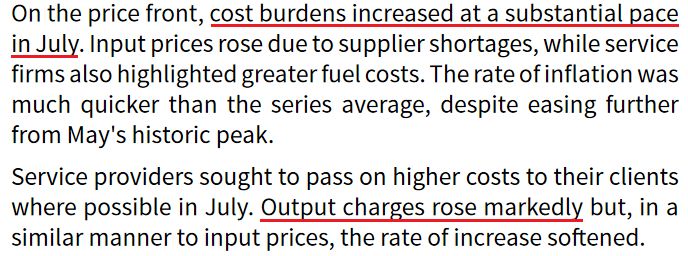
Furthermore, while I’ve warned about rampant inflation for months, Citigroup’s Inflation Surprise Index hit another all-time high in July. For context, a positive ‘surprise’ occurs when actual inflation exceeds economists’ consensus estimate.
Please see below:
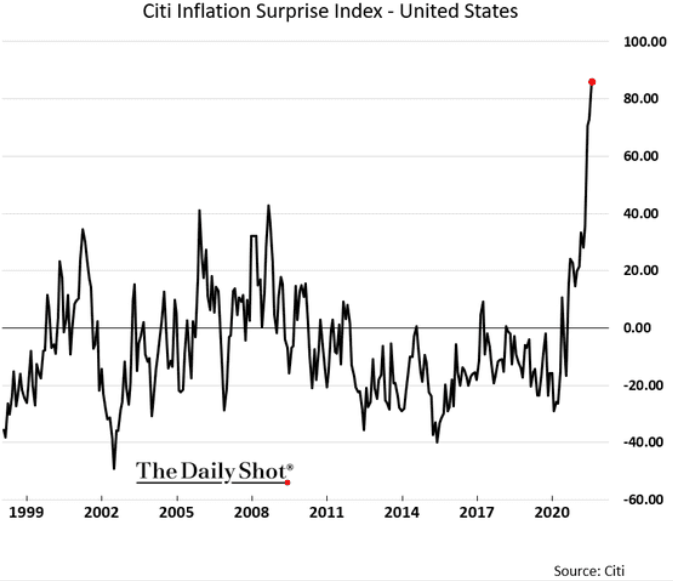
Likewise, while S&P 500 companies are in the midst of reporting their second-quarter earnings, conference calls have been riddled with mentions of inflation. Moreover, data from Bank of America highlights just how ‘inflationary’ executives’ rhetoric has been.
To explain, the light blue line above tracks the year-over-year (YoY) percentage change in S&P 500 companies’ mentions of “inflation” during earnings calls, while the dark blue line above tracks the YoY percentage change in the headline Consumer Price Index (CPI). And though the two lines aren’t fitted to perfection, the behavior of the former is clearly unprecedented.
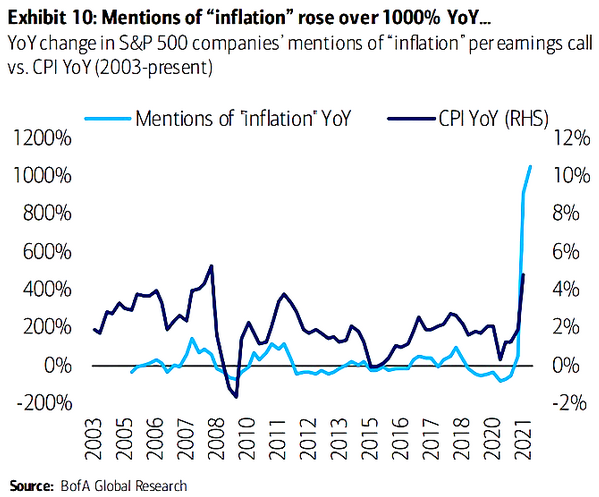
Adding to the inflationary pressures, S&P 500 companies’ mentions of supply chain inflation and wage inflation have also surged to new all-time highs.
Please see below:
To explain, the green and dark blue lines above track the YoY percentage change in S&P 500 companies’ mentions of supply chain and labor-related inflation. If you analyze the right side of the chart, you can see that the reality on the ground is much different than the one depicted by the U.S. 10-Year Treasury yield.
Supply Shock? Probably Not
Finally, while bond investors price in a doomsday scenario, the inflationary surge is far from a supply shock. For context, a supply shock occurs when depleted inventories are the sole reason for upward pressure on prices. However, if you analyze the chart below, you can see that the countries that are consuming the most finished goods are actually seeing the sharpest increases in output inflation.
Please see below:
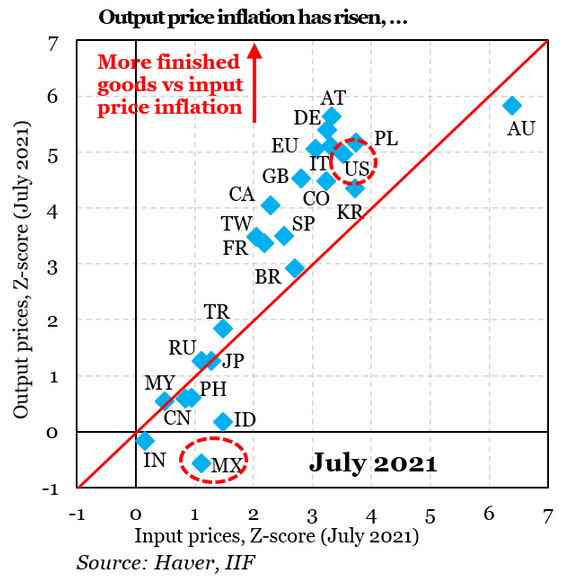
To explain, the blue diamonds above depict the output (and input) inflation experienced in various countries in relation to their consumption of finished goods (calculated as a z-score). If you analyze the trend, you can see that high demand is coinciding with high inflation. For example, if you focus on the U.S. (the red circle near the top), you can see that output inflation is roughly five standard deviations above its historical average, and the demand for finished goods continues to accelerate. Conversely, Mexico’s (the red circle at the bottom) output inflation is roughly 0.5 standard deviations below its historical average and demand remains relatively subdued.
The bottom line? If the inflationary surge was merely a supply shock, output inflation would be similar across all regions. However, with low-demand regions (like MX and IN) unable to pass through input inflation due to weak demand, the U.S. is confronted with a much different scenario. Thus, if Citigroup’s 2% forecast for the U.S. 10-Year Treasury yield proves prescient, the PMs will likely suffer amid the regime change.
In conclusion, gold mining stocks were drastic underperformers on Aug. 5, and rising U.S. equities still weren’t enough to elicit any optimism. And while today’s jobs report (if weak) could uplift their short-term performance, the medium-term forecasts for gold and silver remain clearly bearish. With FED officials ramping up their hawkish rhetoric and the U.S. 10-Year Treasury yield already staring at an all-time low (relative to realized inflation), a reversal of the imbalance could increase the PM’s selling pressure in the coming months. However, because their long-term outlooks remain extremely robust, the PMs’ next leg down will likely present us with a secular buying opportunity.
Thank you for reading our free analysis today. Please note that the above is just a small fraction of the full analyses that our subscribers enjoy on a regular basis. They include multiple premium details such as the interim targets for gold and mining stocks that could be reached in the next few weeks. We invite you to subscribe now and read today’s issue right away.
Sincerely,
Przemyslaw Radomski, CFA
Founder, Editor-in-chief -
Gold & Silver Trading Alert - Pre-market Heads-up
August 6, 2021, 8:42 AMAvailable to premium subscribers only.


Gold Investment News
Delivered To Your Inbox
Free Of Charge
Bonus: A week of free access to Gold & Silver StockPickers.
Gold Alerts
More-
Status
New 2024 Lows in Miners, New Highs in The USD Index
January 17, 2024, 12:19 PM -
Status
Soaring USD is SO Unsurprising – And SO Full of Implications
January 16, 2024, 8:40 AM -
Status
Rare Opportunity in Rare Earth Minerals?
January 15, 2024, 2:06 PM

