
tools spotlight

-
Gold: Bearish Development Just Around the Corner?
June 30, 2021, 8:43 AMWhile we might see a small uptick in gold prices soon, it’s not likely to last long. We should be prepared to open our parachutes any time now.
The decline in gold continues, and while we might see a small pop-up higher here, it’s unlikely to last. And why could gold move slightly higher and correct the recent declines?
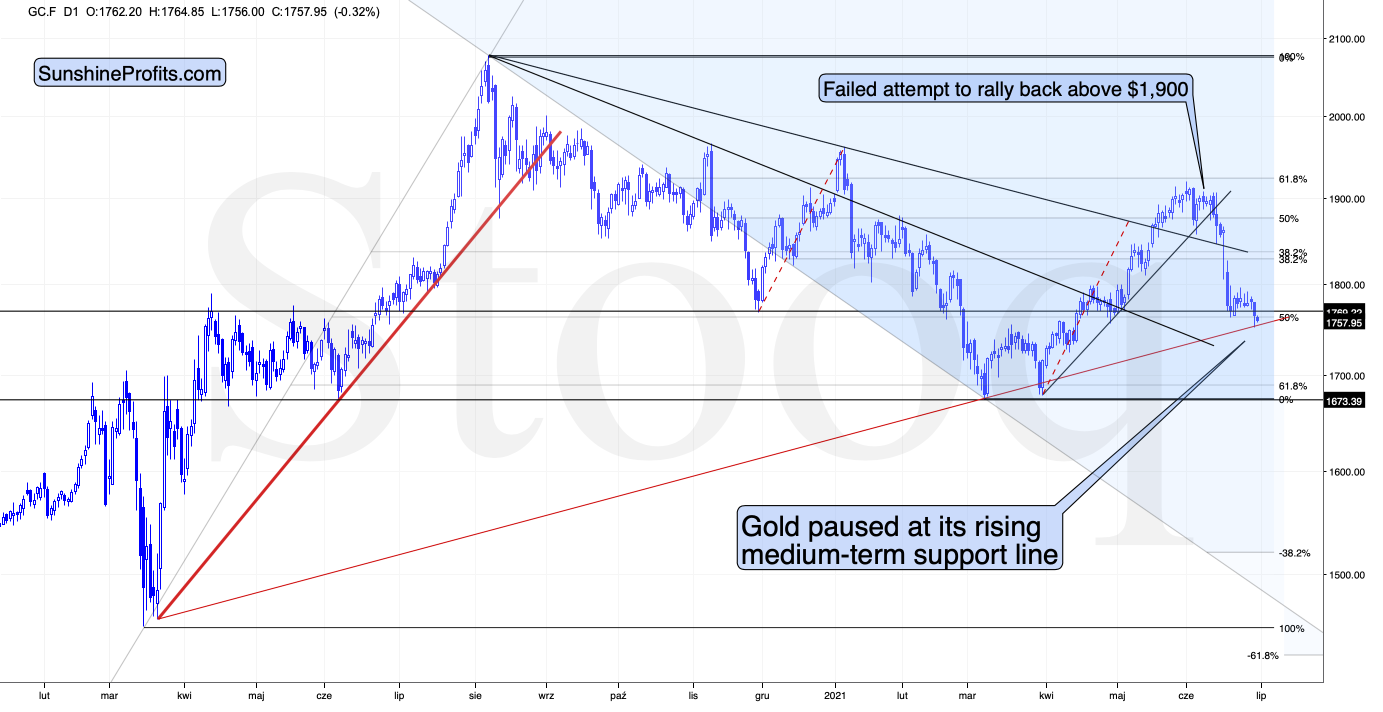
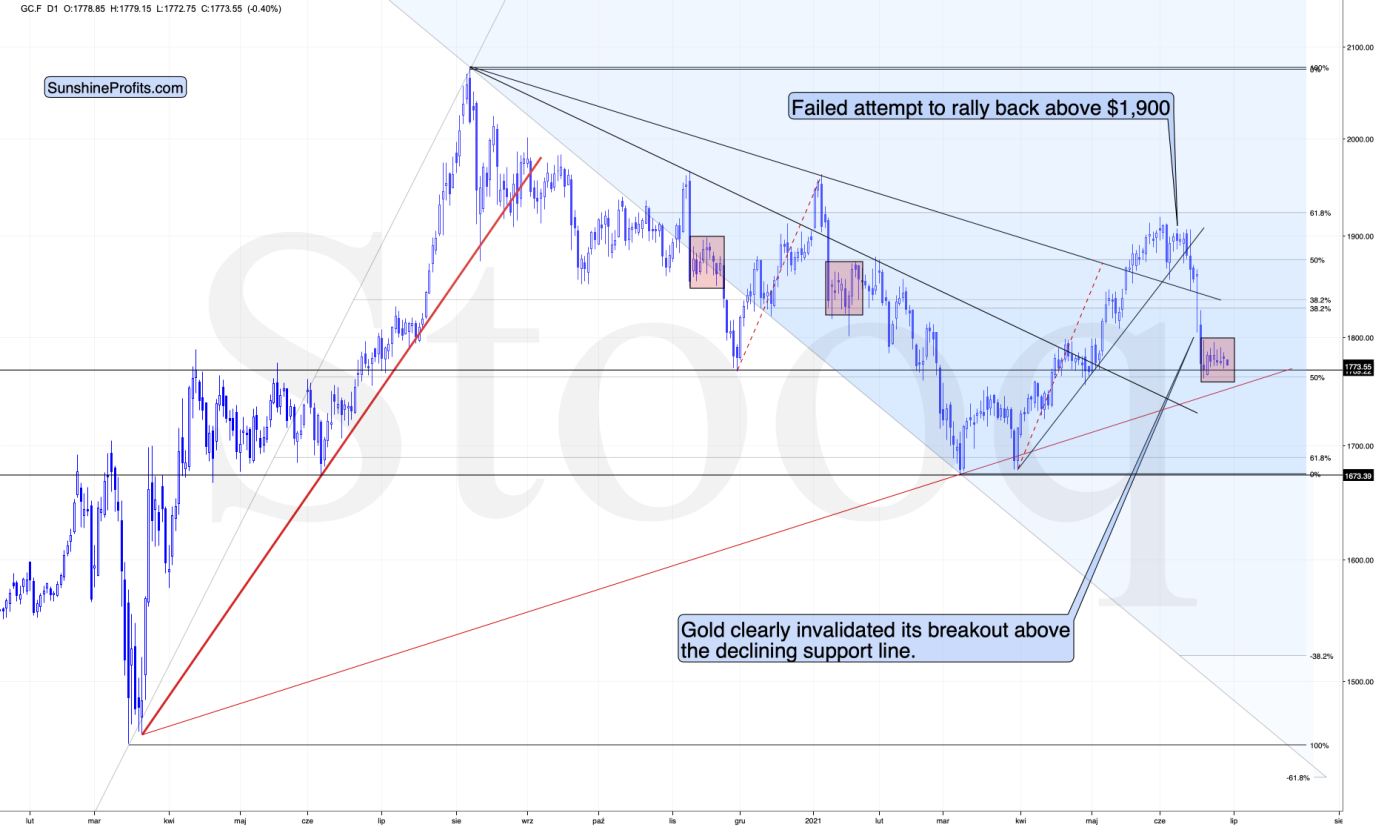
Because it has just reached the rising support line based on its previous important lows. The possible rebound could take place based on this single development. However, just because it might happen doesn’t make it very likely, and it doesn’t mean that taking any action now is justified. The medium-term forecast for gold remains bearish.
The situation in the USD Index is one of the reasons for this outlook:
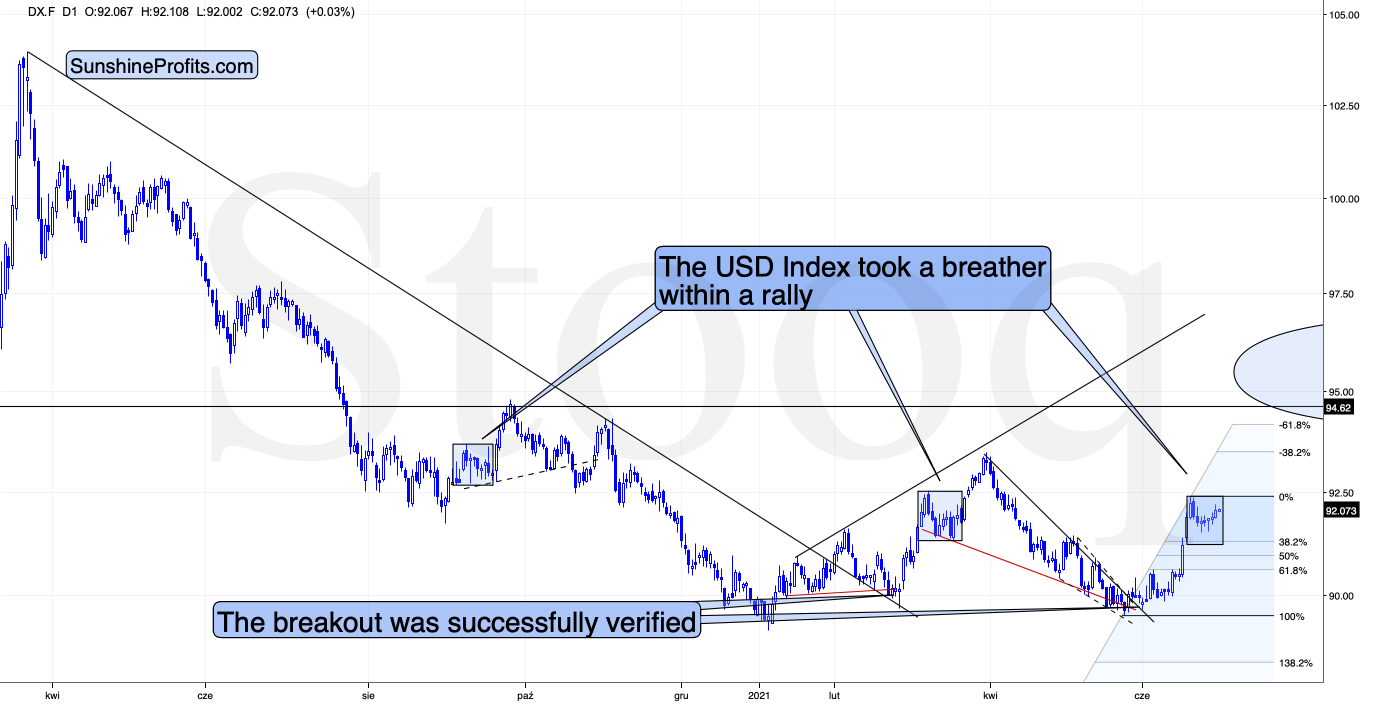
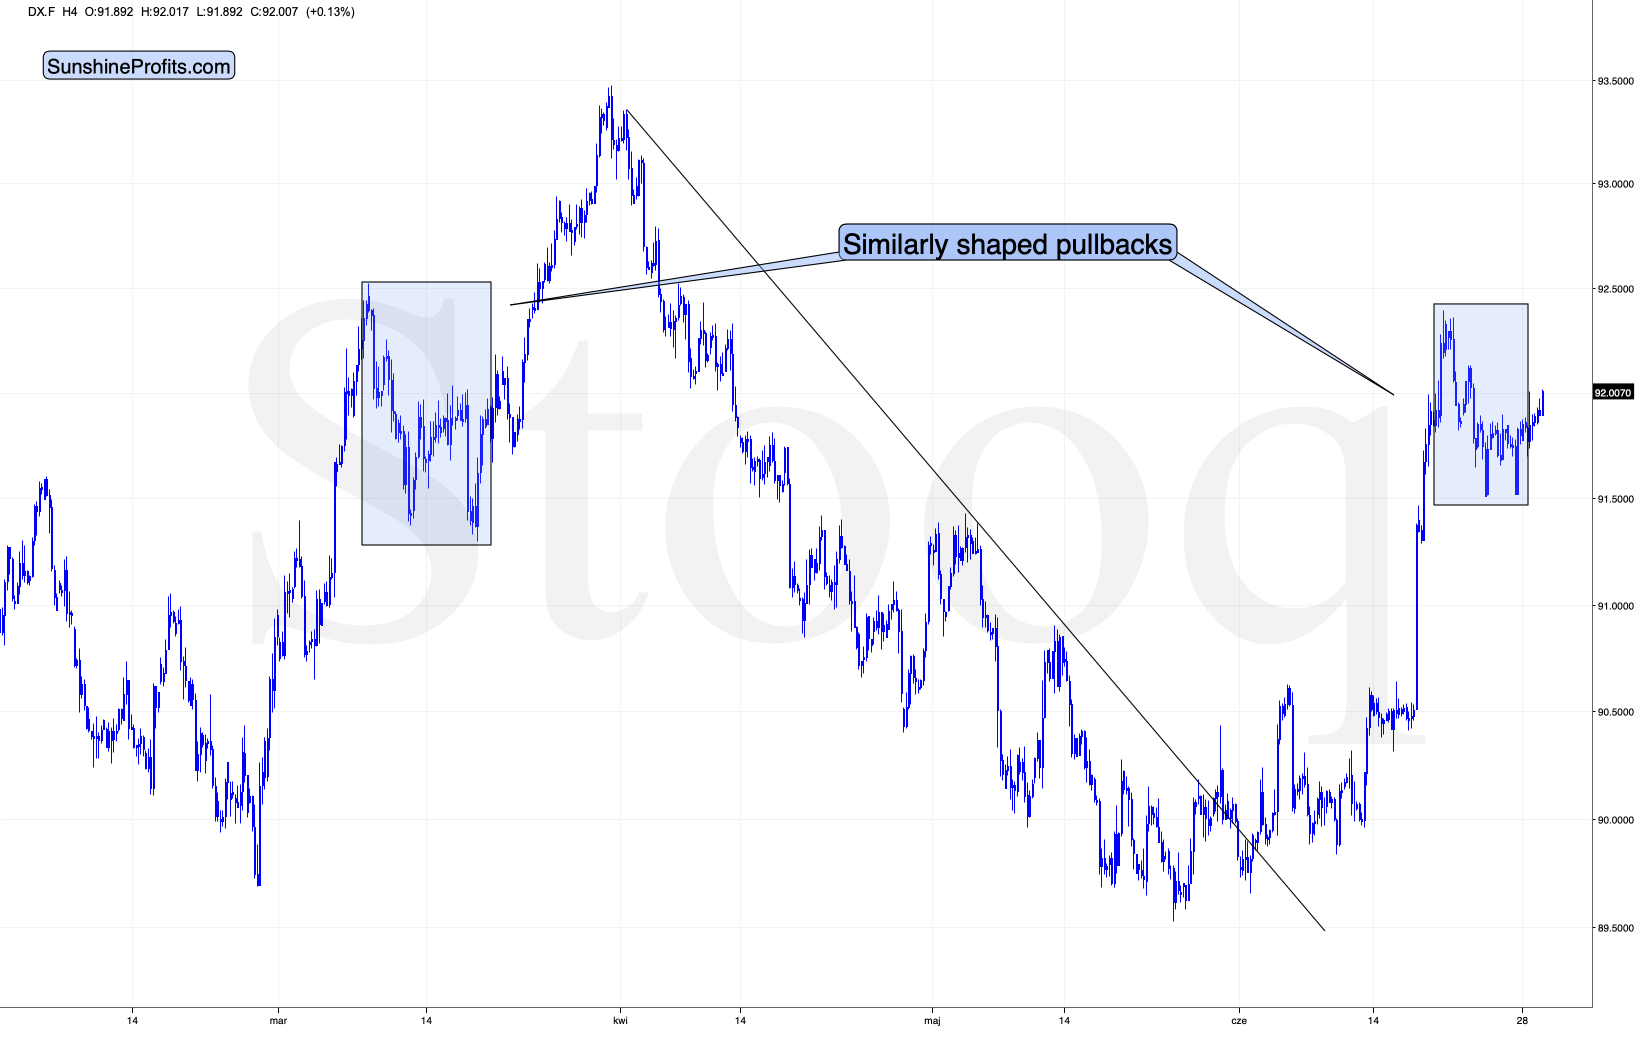
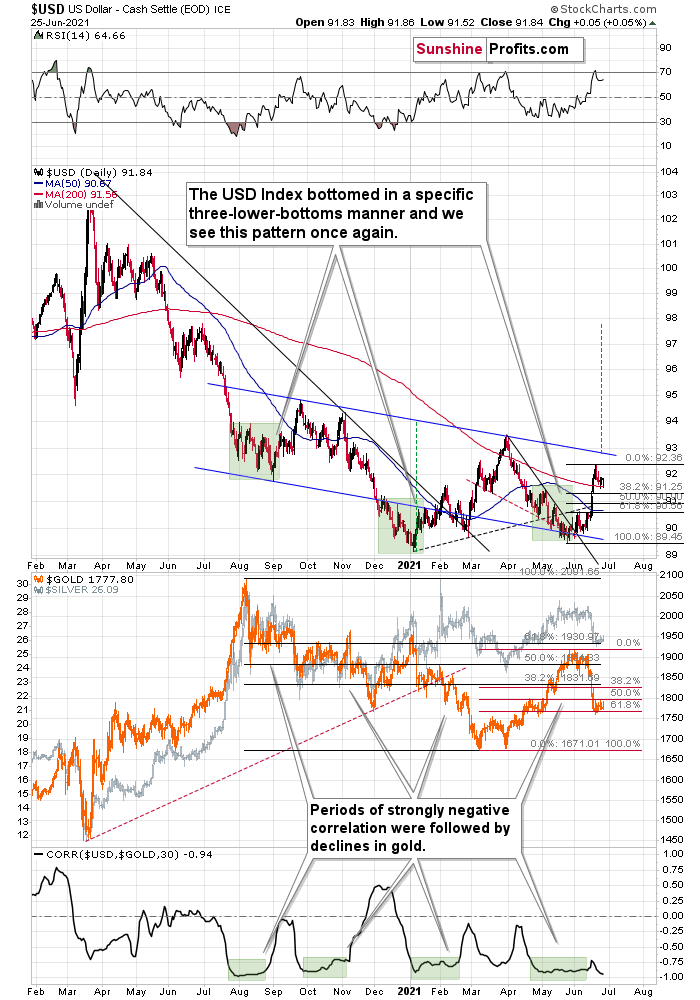
We recently saw a breather that was similar in terms of time and price to the previous patterns which happened after quick short-term rallies. And now, the USDX is moving higher once again. As soon as it exceeds the previous June highs, it’s likely to rally more substantially, perhaps stopping temporarily at the late-March high or rallying even higher, to 95 or so.
Either way, gold is likely to get the bearish push off the cliff that will likely take it below the above-mentioned rising red line. Gold’s next support is at the previous 2021 lows – close to $1,670.
Besides, while gold bounced off the rising red line visible on the first chart, the yellow metal actually broke visibly below a much more important support line.
In fact, that was the first time when gold managed to break below this line and not rally back up. This time is already different.
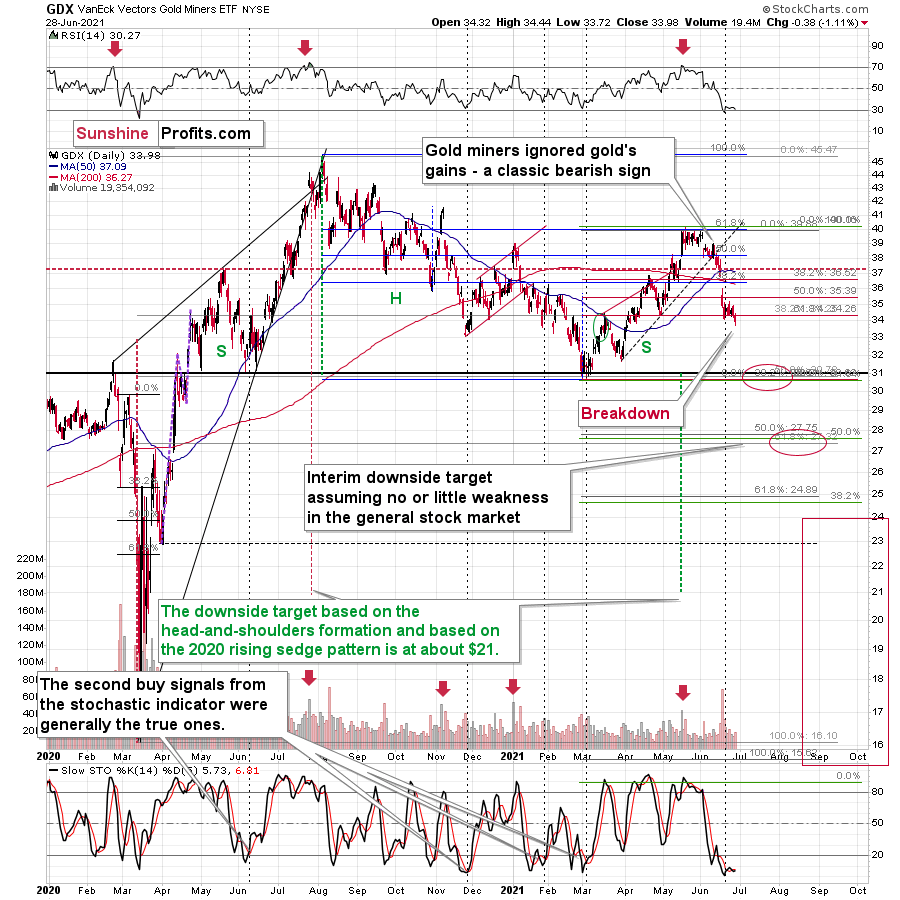
Moreover, let’s keep in mind that gold stocks’ relative performance not only hasn’t stopped indicating the bearish outlook recently but also provided a screaming sell sign once again on Monday.
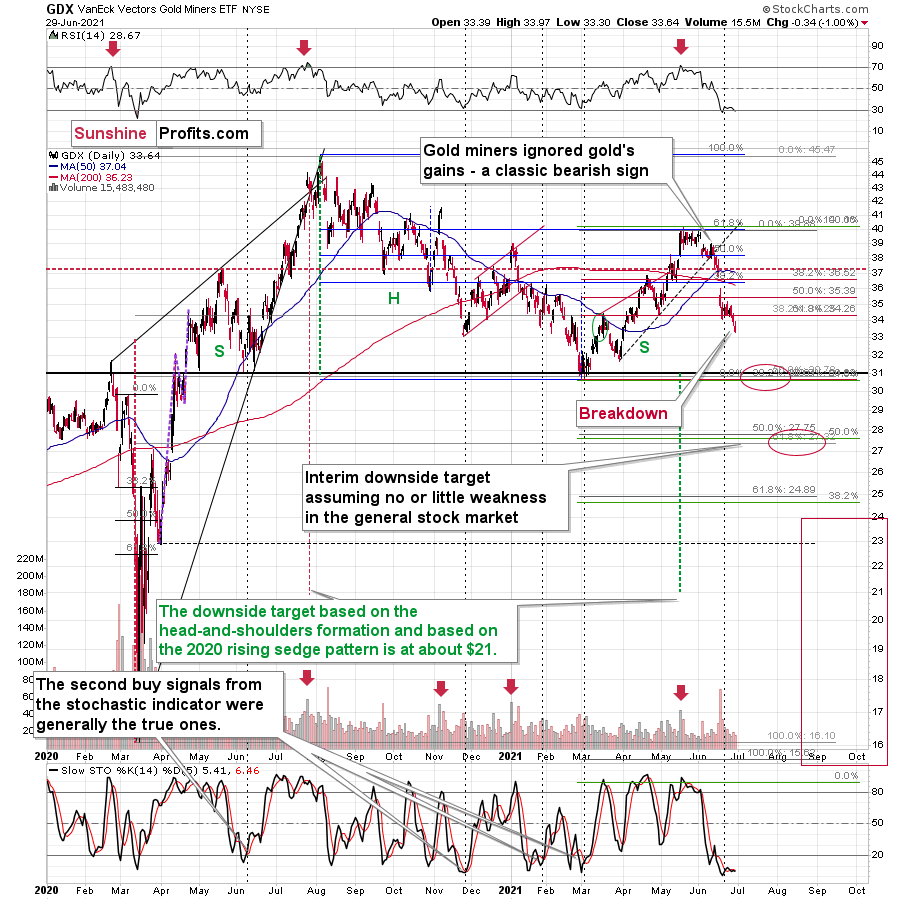
Namely, the GDX ETF declined and closed below its previous monthly lows as well as below the late-April lows. This breakdown took place without gold’s help, which makes it particularly bearish.
Please note that the volume that accompanied this week’s declines is relatively low, and the declines tend to end on huge volume. Consequently, the low-volume readings imply that we’re not at the bottom yet. Also, silver hasn’t broken visibly lower, and it didn’t “catch up” with the miners, which could indicate that the bottom is in. So, it likely isn’t.
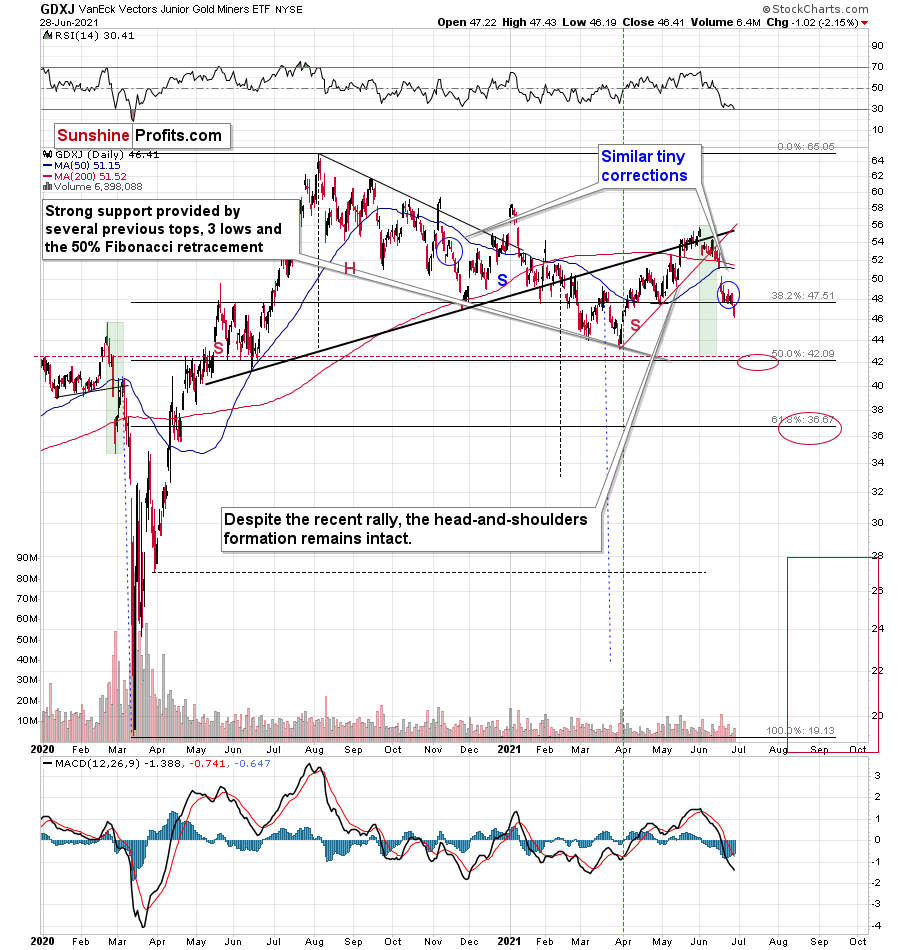
The above-mentioned breakdown was even more profound in the case of the GDXJ – a proxy for junior mining stocks.
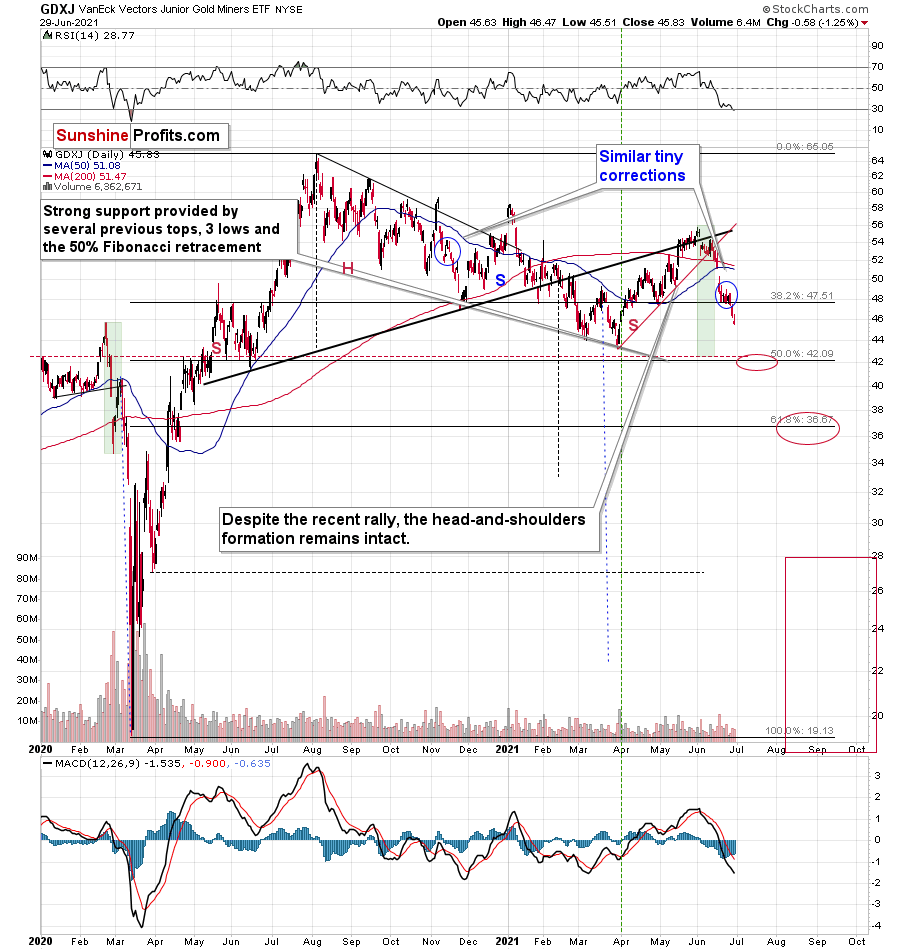
The size of the recent “upswing” was comparable to the mid-November 2020 one, so it confirms the analogy to this period that I mentioned while discussing the gold’s chart yesterday.
The next short-term downside target is at about $42 – a bit below the previous lows, as that’s where the 50% Fibonacci retracement line coincides with the previous highs and lows (and also with the 2019 highs that are not visible on the above chart).
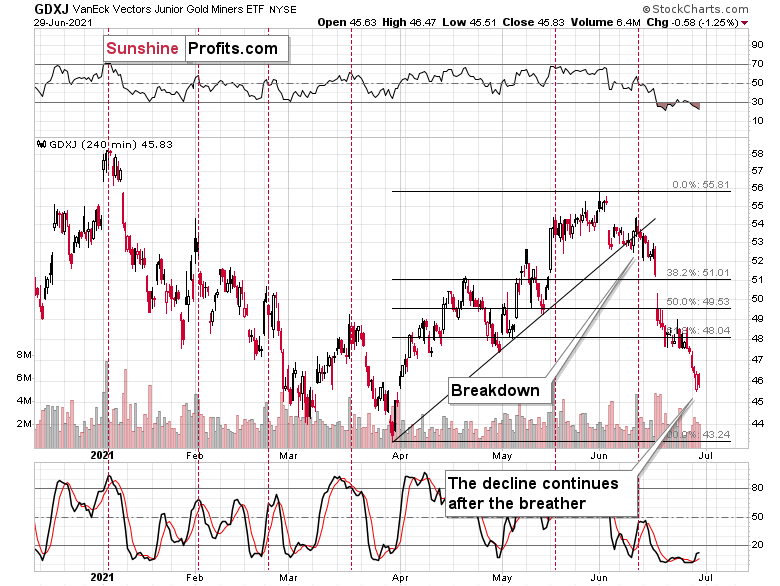
The 4-hour candlestick chart shows that junior miners moved slightly higher at the beginning of yesterday’s session only to decline in its final hours. So, it’s not that we’re not seeing any corrections – we do have them, but they are so tiny that they are barely noticeable from the daily perspective.
All in all, it seems that the outlook for the precious metals market – especially for the junior gold miners – is very bearish for the following weeks and months, and it seems that the profits on our current short position will grow much more quite soon.
Thank you for reading our free analysis today. Please note that the above is just a small fraction of the full analyses that our subscribers enjoy on a regular basis. They include multiple premium details such as the interim targets for gold and mining stocks that could be reached in the next few weeks. We invite you to subscribe now and read today’s issue right away.
Sincerely,
Przemyslaw Radomski, CFA
Founder, Editor-in-chief -
Gold’s Rest Didn’t Give It Strength
June 29, 2021, 9:24 AMGiven gold’s recent fall, a relief rally is clearly within the realm of possibility. However, gold may lack the stamina to do even that.
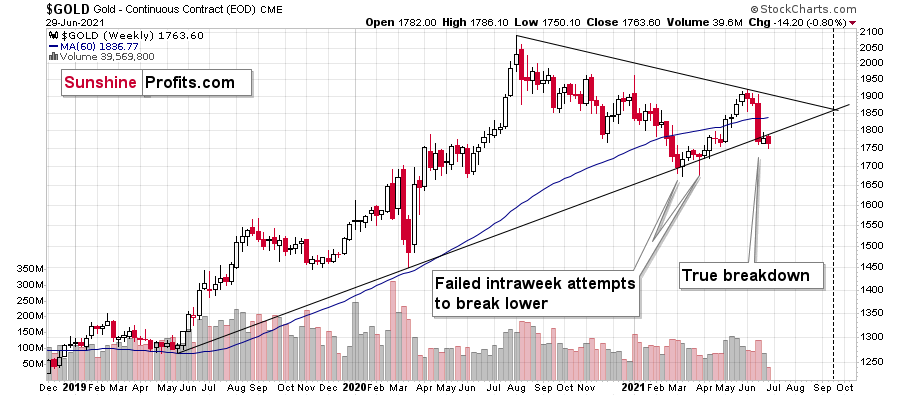
Based on the analogy to 2012, gold was likely to take a breather within the decline that could have taken it as high as the 61.8% Fibonacci retracement. And indeed, we did see a breather, but it took gold only a little higher, and it seems that it’s already nearing its end. Consequently, waiting for gold to rally now would be waiting for something that might have already happened.
To clarify, the size of the move is not that important here as the time that gold took to consolidate.
It’s fine to wait for the broader bottom to be formed, and that seemed to be taking place initially.
That was normal – we saw something like that several times, for example in mid-March 2020 and mid-September 2020. However, gold has been consolidating for over 7 trading days. There was no bottom in recent history that took so long to form.
There were, however, small consolidations that took even a bit longer. And we saw them after gold declined particularly profoundly. I marked those cases with red rectangles – they took place in November 2020 and January 2021. And we see the same thing now. In both previous cases, gold continued to decline, and it declined profoundly once again.
Now, if the USD Index was about to decline significantly, gold would likely rally anyway, but…
The USD Index shaped its corrective downswing very similarly to what it did in late March and early April. And since history rhymes, this could mean that a similar action will follow. And back in April, the USDX simply rallied.
Moreover, gold stocks’ relative performance not only hasn’t stopped indicating the bearish outlook recently but also provided a screaming sell sign once again yesterday.
Namely, the GDX ETF declined and closed below its previous monthly lows as well as below the late-April lows. This breakdown took place without gold’s help, which makes it particularly bearish.
The breakdown was even more profound in the case of the GDXJ – a proxy for junior mining stocks.
The size of the recent “upswing” was comparable to the mid-November 2020 one, so it confirms the analogy to this period that I mentioned while discussing the gold’s chart.
The next short-term downside target is at about $42 – a bit below the previous lows as that’s where the 50% Fibonacci retracement line coincides with the previous highs and lows (and also with the 2019 highs that are not visible on the above chart).
All in all, it seems that the outlook for the precious metals market –especially for the junior gold miners – is very bearish for the following weeks and months.
Thank you for reading our free analysis today. Please note that the above is just a small fraction of the full analyses that our subscribers enjoy on a regular basis. They include multiple premium details such as the interim targets for gold and mining stocks that could be reached in the next few weeks. We invite you to subscribe now and read today’s issue right away.
Sincerely,
Przemyslaw Radomski, CFA
Founder, Editor-in-chief -
USDX, Gold: The Hunter and the Prey
June 28, 2021, 9:59 AMJust before the hunt begins, the hunter needs to be sure its prey feels safe. Will we see a promising short-term rally in gold?
After the USD Index reasserted its dominance once again, its bellowing howl sent shivers down the spine of currency traders. When the U.S. Dollar Index is on the hunt, the precious metals are often its prey. The alpha wolf is poised to lead the pack over the medium term, and the sheep will likely be sent to the slaughter, but the predator needs to gather force first; a peaceful period of prosperity should ensue over the next several days. And this short-term decline could help uplift gold, silver, and mining stocks.
To explain, I warned last week that a short-term decline was likely after the USD Index’s RSI (Relative Strength Index) jumped above 70. And after eliciting some weakness, another pullback to the 38.2% Fibonacci retracement level also aligns with the price action that we witnessed in 2016.
Please see below:
To that point, after the USD Index broke above its short-term declining resistance line in 2016, it followed that up by retreating a bit below its rising support (dashed) line and then consolidated for about a month before rallying sharply. In the process, the USD Index corrected to approximately its 38.2% Fibonacci retracement level before rallying once again (in fact, it moved slightly below it). For context, there was also a huge intraday reversal in the following days, but it was an event-driven one (it was when Donald Trump won the elections), so it’s unlikely to be repeated. As of today, with the 38.2% Fibonacci retracement level at about 91.3, the USDX could bottom close to this level. Now, this might not seem like a big deal, but it becomes quite important once one considers what happened in gold during the final part of the move to the 38.2% retracement in 2016. That was when gold made most of its gains.
However, given the yellow metal’s inability to bounce after its profound decline, the forthcoming rally will likely be weaker than originally expected. For context, the initial projection was based on the similarity to gold’s behavior in 2012. However, with the yellow metal struck in neutral and failing to gain any traction, the current environment seems more bearish than it was in 2012. The bearish gold price forecasts currently seem justified , in the medium term.
Moreover, if the USD Index can surpass 93, the greenback will complete its inverse head & shoulders pattern, and the milestone implies a short-term target of roughly 98.
Let’s keep in mind that the near-term decline in the USD Index is likely to be small – and nothing more than a blip on the radar screen, when viewed from the long-term point of view. The USD Index often records material upswings during the middle of the year. If you analyze the chart below, you can see that summertime surges have been mainstays on the USD Index’s historical record. Likewise, double bottoms often signal the end of major declines and often ignite significant rallies. For example, in 2004, 2005, 2008, 2011, 2014 and 2018, a retest of the lows (or close to them) occurred before the USD Index began its upward flights. In addition, back in 2008, U.S. equities’ plight added even more wind to the USD Index’s sails. And if the general stock market suffers another profound decline (along with gold miners and silver), a sharp re-rating of the USDX is likely in the cards.
Please see below (quick reminder: you can click on the chart to enlarge it):
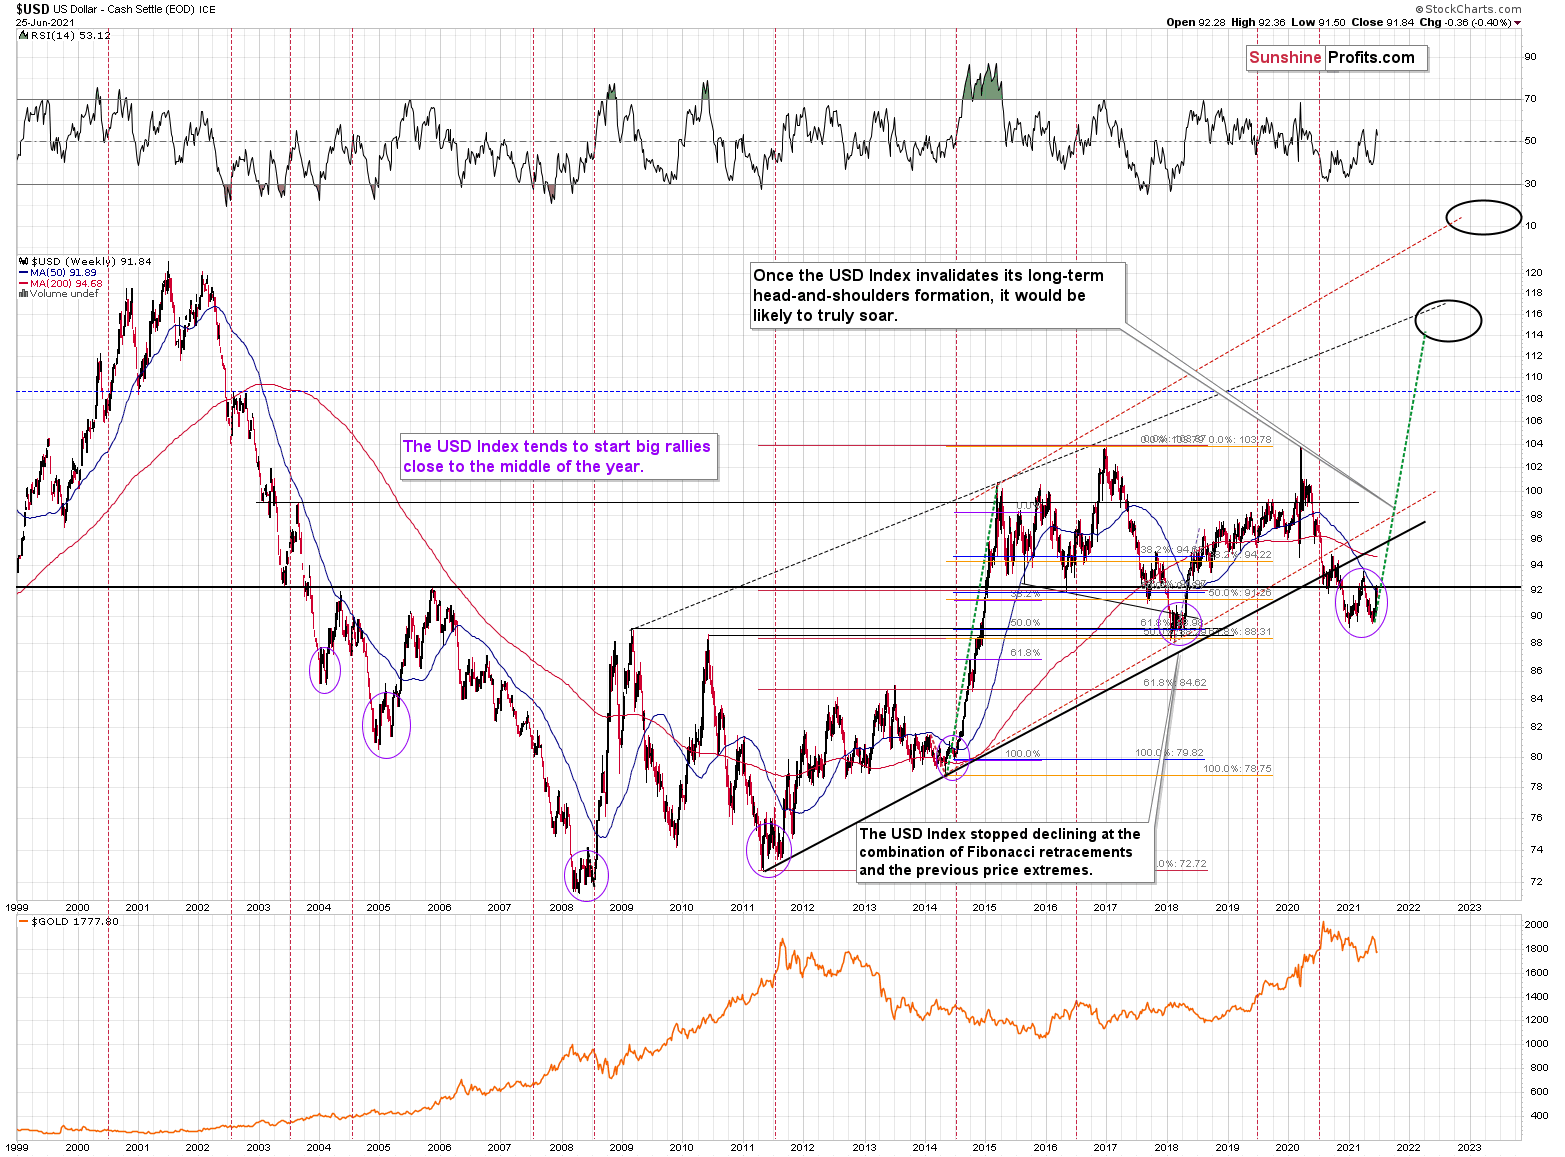
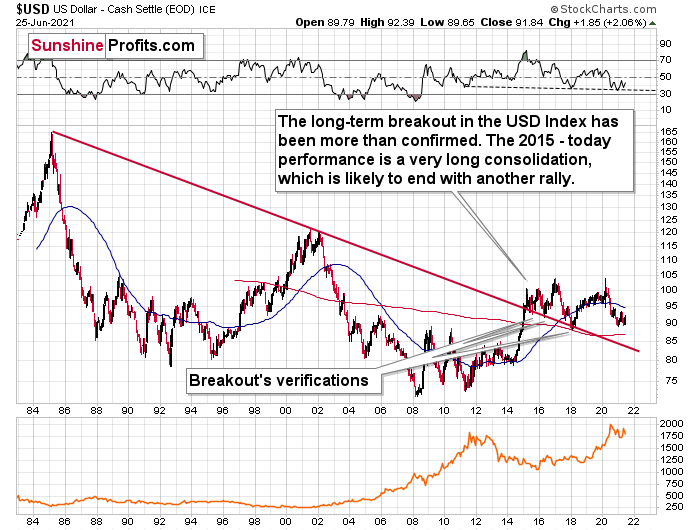
If that wasn’t enough, the thesis is also supported by the USD Index’s long-term chart. To explain, the USDX’s long-term breakout remains intact, and if we steady the binoculars, the greenback’s uptrend is clearly in place.
Please see below:
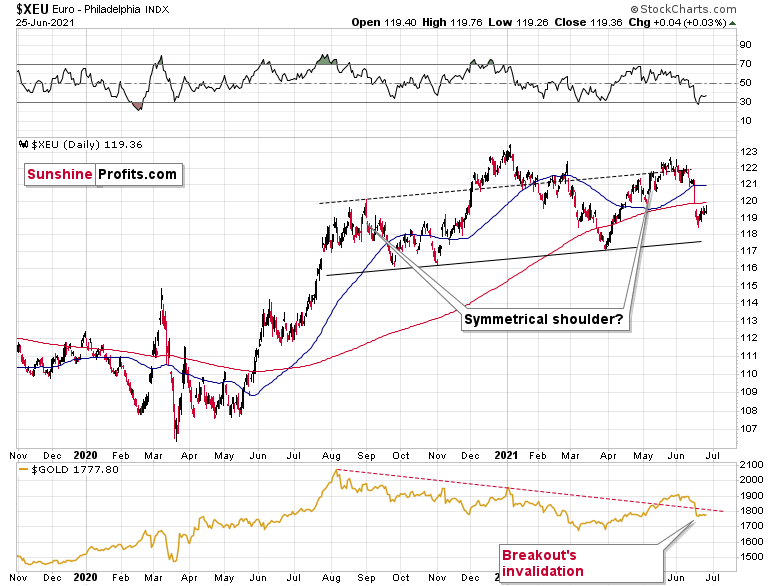
Moving on to the Euro Index, the recent symmetrical decline mirrors the drawdown that we witnessed in mid-2020. And if the Euro Index breaks below the neckline of its bearish head & shoulders pattern, the slide could be fast and furious. For context, completion of the right shoulder signals a decline to (roughly) the June 2020 lows or even lower. However, with a short-term corrective downswing in the USD Index likely to usher the Euro Index higher, the development should help support gold, silver, and mining stocks this week.
Please see below:
For context, I wrote previously:
The completion of the masterpiece could have a profound impact on gold, silver and mining stocks. To explain, gold continues to underperform the euro. If you analyze the bottom half of the chart above, you can see that material upswings in the Euro Index have resulted in diminishing marginal returns for the yellow metal. Thus, the relative weakness is an ominous sign. That’s another point for the bearish price prediction for gold.
Circling back to the 2016 analogue, the USD Index has already hopped into the time machine. And with the flashback eliciting memories of past glory, a reenactment won’t be applauded by the PMs.
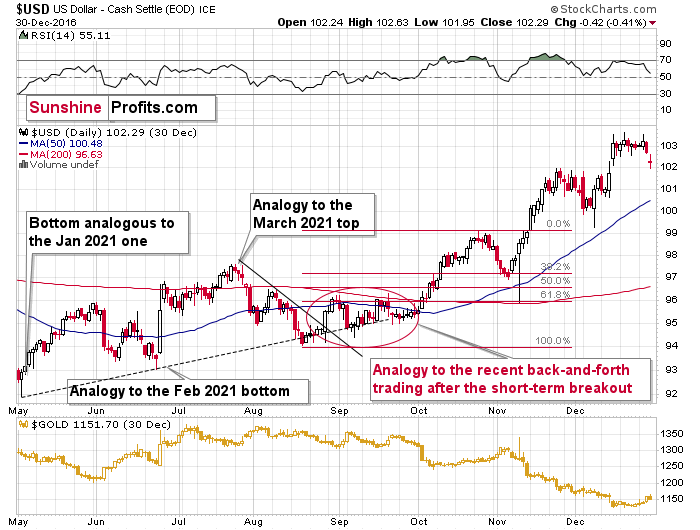
As you can see on the above chart, what we saw this year was quite similar to what happened in 2016. The analogy that I described previously worked just like in the past. Namely, the back-and-forth movement after the breakout was followed by a quick rally.
The bottom line?
Once the momentum unfolds, ~94.5 is likely the USD Index’s first stop. In the months to follow, the USDX will likely exceed 100 at some point over the medium or long term. Keep in mind though: we’re not bullish on the greenback because of the U.S.’ absolute outperformance. It’s because the region is outperforming the Eurozone and the EUR/USD accounts for nearly 58% of the movement of the USD Index – the relative performance is what really matters.
In conclusion, while wolves will likely circle gold, silver and mining stocks over the medium term, the leader of the pack – the USD Index – is well-fed for now and shouldn’t disrupt the precious metals’ short-term corrective upswing. However, when its stomach growls and the hunt continues, the alpha’s bared teeth, fixed stare, and horizontal ears may scare gold, silver and mining stocks to death. Thus, while the precious metals are likely safe in the short term, the nights might grow colder and darker even amid the summer sun.
Thank you for reading our free analysis today. Please note that the above is just a small fraction of the full analyses that our subscribers enjoy on a regular basis. They include multiple premium details such as the interim targets for gold and mining stocks that could be reached in the next few weeks. We invite you to subscribe now and read today’s issue right away.
Sincerely,
Przemyslaw Radomski, CFA
Founder, Editor-in-chief -
FED: What’s Going On Behind the Scenes?
June 25, 2021, 9:20 AMThe FED allows banks to do much more than what is proper based on the “economy is still bad” narrative. What does this mean for a private investor?
Banking on a Comeback
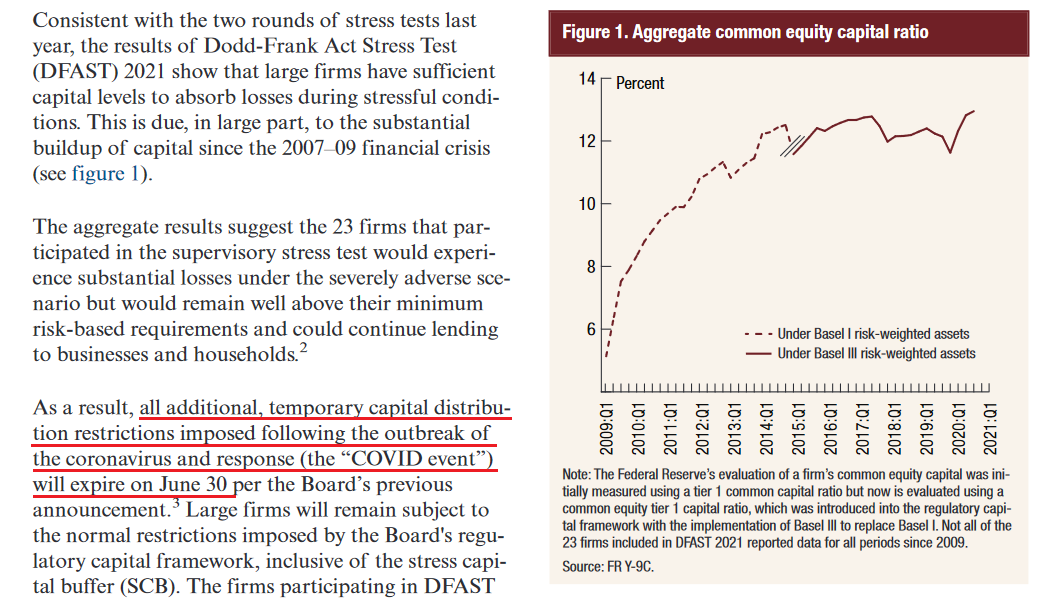
With the U.S. Federal Reserve (FED) releasing its annual bank stress tests on Jun. 24, Vice Chairman for Supervision Randal Quarles said that “the banking system is strongly positioned to support the ongoing recovery." For context, the FED’s stress tests analyze the health of U.S. banks’ balance sheets and reveal how they would fare if hypothetical economic doomsdays were to occur.
And while Chairman Jerome Powell told Congress on Jun. 22 that the U.S. economy "is still a ways off," the results of the stress tests are a contradiction. Case in point: the report revealed that since “all 23 large banks tested remained well above their risk-based minimum capital requirements […] the additional restrictions put in place during the COVID event will end.”
Translation? The FED will allow U.S. banks – like JPMorgan, Bank of America and Citigroup – to resume share buybacks and standard dividend payments (roughly $130 billion worth) as of next month.
Please see below:
 Source: U.S. FED
On top of that, the FED considers the following a scary situation:
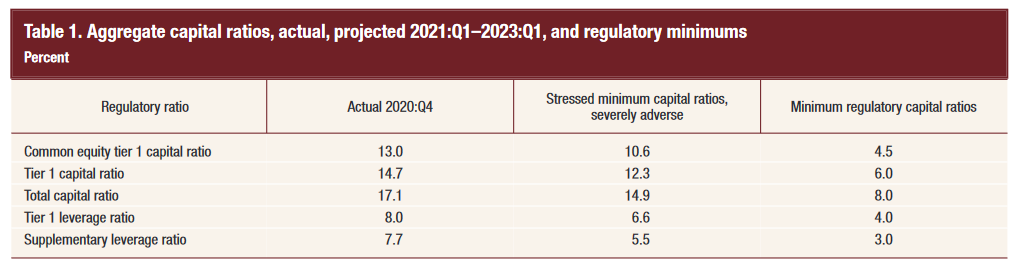
“The severely adverse scenario is characterized by a severe global recession accompanied by a period of heightened stress in CRE and corporate debt markets. The U.S. unemployment rate climbs to a peak of 10-3/4 percent in the third quarter of 2022, a 4 percentage point increase relative to its fourth quarter 2020 level. Real GDP falls 4 percent from the end of the fourth quarter of 2020 to its trough in the third quarter of 2022. The decline in activity is accompanied by a lower headline consumer price index (CPI).”
However, even if this hypothetical malaise occurs, the FED believes that all 23 banks will pass the test with flying colors.
Please see below:
 Source: U.S. FED
To explain, the third column from the left depicts the banks’ regulatory capital ratios under the “severely adverse scenario.” Moreover, if you compare the results with the fourth column from the left, you can see that even if an economic meteor strikes, participants’ ratios will still remain above their regulatory minimums. For context, common equity tier 1 capital (CET1) is the most liquid source of banks’ capital, and the CET1 ratio is used to gauge banks’ ability to absorb losses should an economic shock occur.
But why is all of this so important?
Well, if the FED was so worried about the U.S. economy, would it allow financial institutions to frivolously spend their collateral on dividends and share buybacks? Remember, U.S. banks supply credit card loans, mortgages, commercial loans and finance the sectors that were hardest hit by COVID-19 (commercial real estate, hospitality, energy, etc.). Thus, with the FED giving banks the ‘all-clear,’ it’s a sign that the U.S. economy is much stronger than the FED lets on.
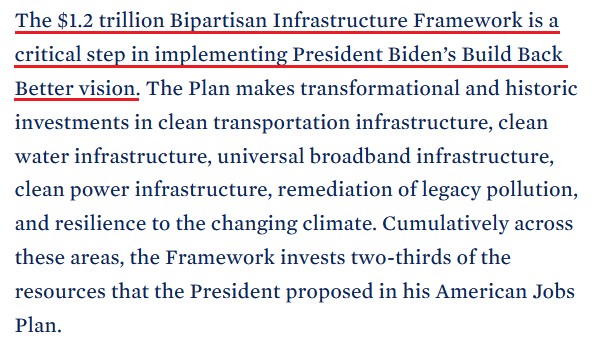
In addition, The White House announced on Jun. 24 that a $1.2 trillion infrastructure deal was reached. And calling the milestone “the largest federal investment in public transit in history and the largest federal investment in passenger rail since the creation of Amtrak,” lawmakers want to cook the U.S. economy until it boils. For context, the agreement includes $579 billion of new spending with the rest being diverted from untapped coronavirus-relief funds.
Please see below:
 Source: The White House
More importantly, though, with U.S. lawmakers hell-bent on pushing the limits of inflation and economic growth, the ominous impulse remains bullish for the U.S. 10-Year Treasury yield and the USD Index. Regarding the latter, if U.S. GDP growth outperforms the Eurozone, the EUR/USD – which accounts for nearly 58% of the movement of the USD Index – should suffer in the process. Likewise, with the U.S. 10-Year Treasury yield materially undervalued relative to realized inflation and prospective GDP growth, unprecedented spending should put upward pressure on interest rates. Furthermore, the bullish cocktail should force the FED to taper its asset purchases in September.
To explain, while the PMs are allergic to a rising U.S. 10-Year Treasury yield, the latter doesn’t have to move for the metals to suffer. For example, following the FED’s announcement on Jun. 16, the U.S. 2-Year, 3-Year and 5-Year Treasury yields surged. And while the development flattened the U.S. yield curve – meaning that short-term interest rates rose while long-term interest rates stood pat – the PMs still suffered significant drawdowns. Thus, while the U.S. 10-Year Treasury yield remains ripe for an upward re-rating, even if it stays in consolidation mode, short-term interest rate pressures are just as ominous.
Will We See Another Inflation Surprise?
To that point, with the Personal Consumption Expenditures (PCE) Index scheduled for release today, another inflation ‘surprise’ could rattle the bond market once again. To explain, I wrote on Jun. 22:
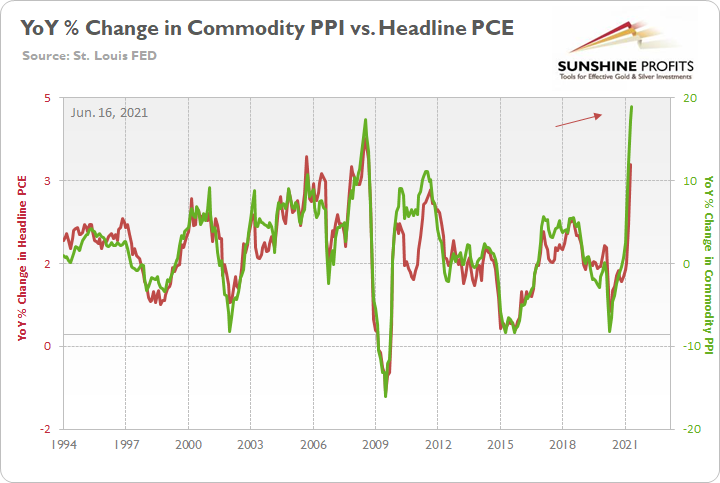
The FED increased its year-over-year (YoY) headline PCE Index forecast from a rise of 2.40% YoY to a rise of 3.40% YoY on Jun. 16. However, with the Commodity Producer Price Index (PPI) surging by 18.98% YoY – the highest YoY percentage increase since 1974 – the wind still remains at inflation’s back. Moreover, with all signs pointing to a YoY print of roughly 4% to 4.50% on Jun. 25, the “transitory” narrative could suffer another blow on Friday.
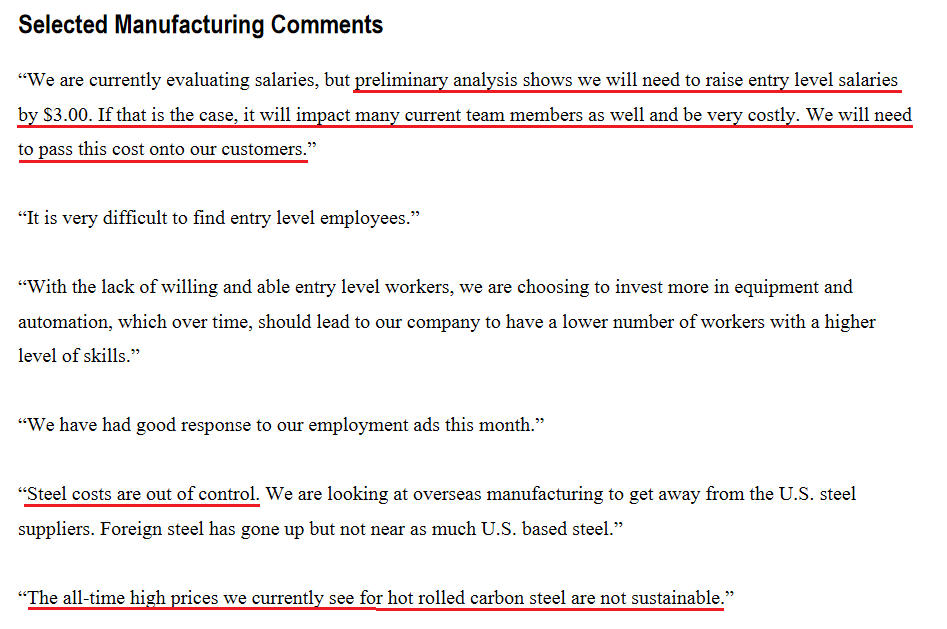
As further evidence, the Kansas City FED released its Manufacturing Survey on Jun. 24. And with the composite index rising from 26 in May to 27 in June, Chad Wilkerson, vice president and economist at the KC FED, had this to say about the current state of affairs:
“Regional factory activity rose again in June and expectations for future activity were the highest in survey history. While the majority of firms continue to face increasing materials prices and labor shortages, many firms have also increased selling prices and capital expenditures for 2021.”
To that point, while the KC FED’s prices paid and prices received indexes declined slightly from their all-time highs, both gauges remain above their prior historical peaks.
Please see below:
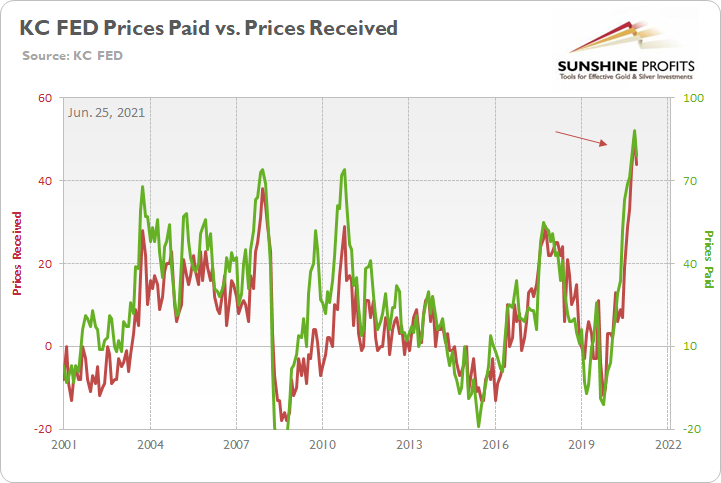
To explain, the green line above tracks the KC FED’s prices paid index, while the red line above tracks the KC FED’s prices received index. If you analyze the right side of the chart, you can see that both remain extremely elevated.
On top of that, survey respondents provided the following anecdotal evidence:
 Source: KC FED
Also supportive of future economic growth, U.S. manufacturers spent $36.218 billion on machinery in May (the data was released on Jun. 24) – only a slight decrease from the all-time high of $36.364 billion set in April. And with machinery representative of long-lived assets that have high breakeven costs, the recent splurge signals that manufacturers remain optimistic about the recovery.
Please see below:
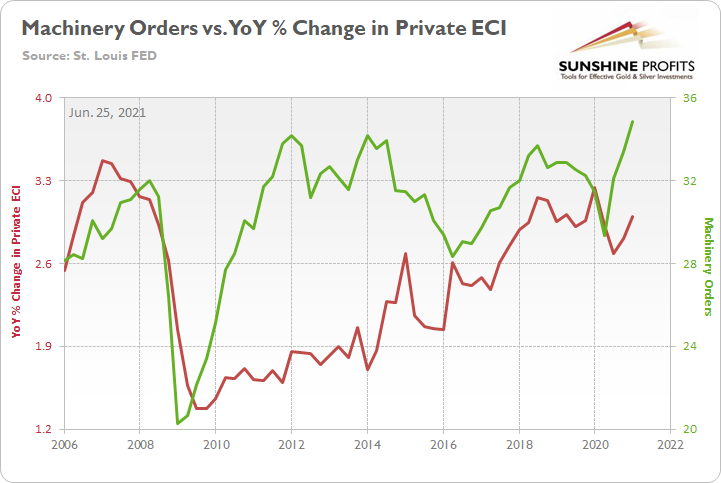
To explain, the green line above tracks manufacturers’ machinery orders, while the red line above tracks the YoY percentage change in the Private Employment Cost Index (ECI). If you analyze the relationship, you can see that when manufacturers invest in long-term equipment, wage inflation often follows. As a result, if the two lines continue their ascent, it will only increase the odds that the FED tapers in September. Forecasting more hawkish, not more dovish FED seems to be appropriate at this time.
Knock Knock? It’s China, We Want More Money
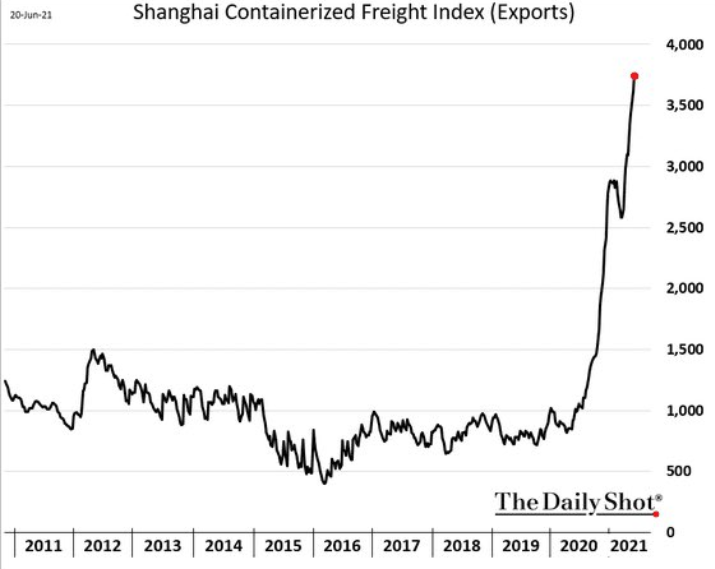
On top of that, with the U.S. goods trade balance (exports minus imports) revised to -$88.11 billion on Jun. 24, foreign production is required to stock U.S. shelves. And with the Shanghai Containerized Freight Index (the cost to ship from China) unrelenting in its parabolic rise, it’s another indicator that inflationary pressures are unlikely to abate anytime soon.
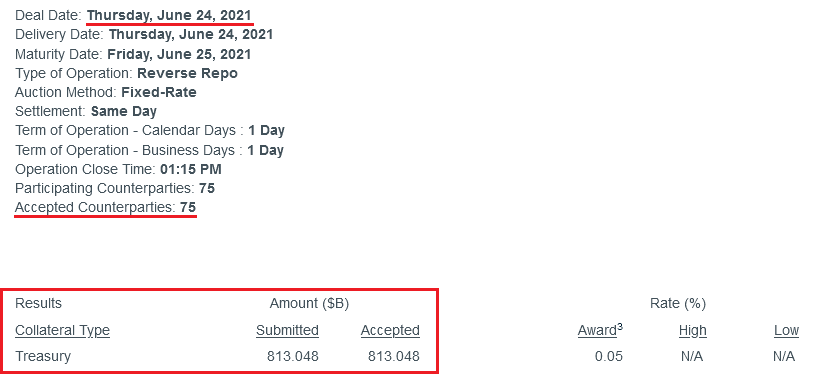
Finally, with the FED selling another $813 billion worth of reverse repurchase agreements on Jun. 24 (~$53 million below the all-time high set on Jun. 23), the liquidity drain remains on schedule.
Please see below:
 Source: NY FED
To explain the significance, I wrote previously:
A reverse repurchase agreement (repo) occurs when an institution offloads cash to the FED in exchange for a Treasury security (on an overnight or short-term basis). And with U.S. financial institutions currently flooded with excess liquidity, they’re shipping cash to the FED at an alarming rate.
More importantly, though, after the $400 billion level was breached in December 2015, the FED’s rate-hike cycle began. On top of that, the liquidity drain is at extreme odds with the FED’s QE program. For example, the FED aims to purchase a combined $120 billion worth of Treasuries and mortgage-backed securities per month. However, with daily reverse repurchase agreements averaging $520 billion since May 21, the FED has essentially negated 4.33 months’ worth of QE in the last month alone.
In conclusion, while the PMs should recover a meaningful chunk of last week’s downswing, their medium-term outlook isn’t so sanguine. With FED hawks and doves splintered down the middle, the fundamentals are firmly tilted in the former’s favor. And with inflation and U.S. GDP growth both accelerating concurrently, unemployment is the only card left for the doves to play. However, with enhanced unemployment benefits expiring in early July for roughly 30% of claimants, U.S. nonfarm payrolls should show strength in August and September. Thus, with the FED’s taper talk likely to grow louder over the next few months, the PMs may not like what they will hear.
Thank you for reading our free analysis today. Please note that the above is just a small fraction of the full analyses that our subscribers enjoy on a regular basis. They include multiple premium details such as the interim targets for gold and mining stocks that could be reached in the next few weeks. We invite you to subscribe now and read today’s issue right away.
Sincerely,
Przemyslaw Radomski, CFA
Founder, Editor-in-chief


Gold Investment News
Delivered To Your Inbox
Free Of Charge
Bonus: A week of free access to Gold & Silver StockPickers.
Gold Alerts
More-
Status
New 2024 Lows in Miners, New Highs in The USD Index
January 17, 2024, 12:19 PM -
Status
Soaring USD is SO Unsurprising – And SO Full of Implications
January 16, 2024, 8:40 AM -
Status
Rare Opportunity in Rare Earth Minerals?
January 15, 2024, 2:06 PM

