

Briefly: in our opinion, full (300% of the regular position size) speculative short positions in junior mining stocks are justified from the risk/reward point of view at the moment of publishing this Alert.
So, gold miners moved higher yesterday. What does this daily rally change? Nothing.
There are days when things are particularly interesting and many things change. Yesterday was not one of those days.
The price action in the GDX ETF was relatively boring, and the same goes for other markets as well. In the case of gold, this boredom is actually bearish, but we’ll get to that shortly. For now, let’s take a look at the GDX chart.
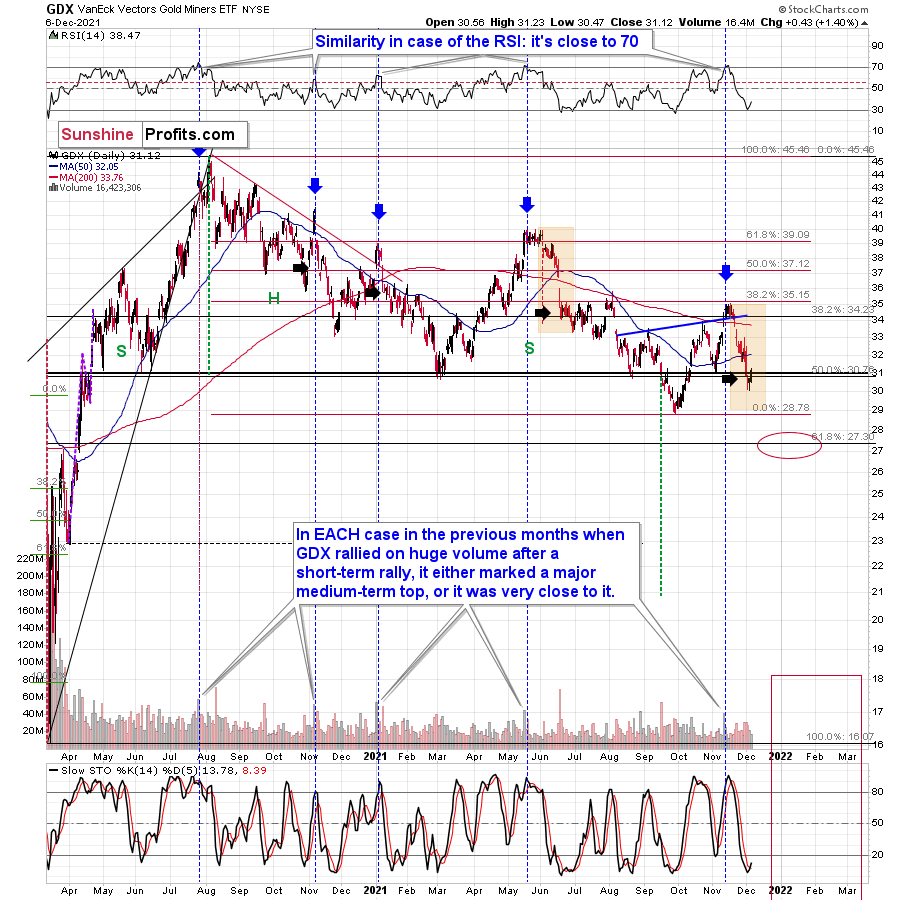
We saw a small upswing, which is in tune with what we saw previously after sharp rallies that followed high-volume rallies/tops. I marked those previous high-volume sessions with blue vertical lines and in three out of four previous cases, I also placed black arrows after the initial part of the decline.
I did that to illustrate what happened in those previous cases and to provide the context for what happened yesterday. In those three cases, we saw tiny upswings that were then followed by lower prices. So, that is the default price action that one should expect here. And, well, that’s what happened yesterday. Expected, regular – and boring.
On a side note, I’m not saying that the situation being “boring” is a bad thing. If the markets only do boring stuff – behaving as expected – it means that they will likely do things more or less in tune with their outlook, which in turn means that they will likely move in tune with our trading positions, thus making them more profitable.
In this case, the daily move up is not in tune with them, but it’s in tune with the bigger – and very bearish – picture, which is positive for our trading positions as it increases the chances that they will become very, very, very profitable in the not-too-distant future.
The volume that accompanied yesterday’s small upswing was relatively low, so that’s also something suggesting that the increase was just a breather within a decline.
The GDX also moved close to its early-November lows, so let’s zoom in.
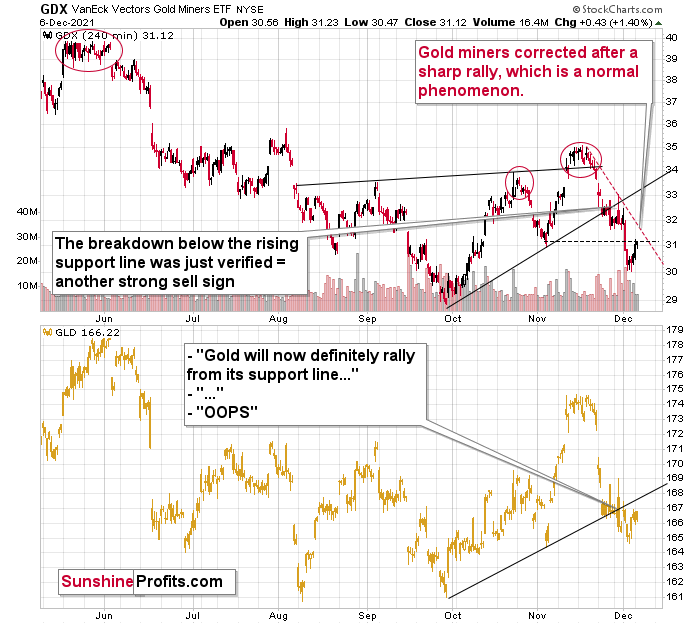
After verifying the breakdown below its rising support line, the GDX moved lower, just as I expected it to. Now it’s after a breakdown below its previous (November) lows, and it seems to be verifying that breakdown just as it verified the breakdown below the rising support line in late November.
The black dashed line in the above chart shows the resistance provided by the previous lows. It wasn’t invalidated. At the same time, the GDX is well below its declining red resistance line, and even if it moves close to this line but then declines, it will not be viewed as something bullish.
But will it really move higher? I wouldn’t bet the farm on that scenario. Why? Because, for instance, the breakdown in the GLD ETF has been more than verified, and it seems that the flagship ETF for gold is now ready to slide lower - and if it does, miners are likely to slide as well.
By the way, please note that junior miners are once again declining more than senior miners, also in tune with my previous expectations.
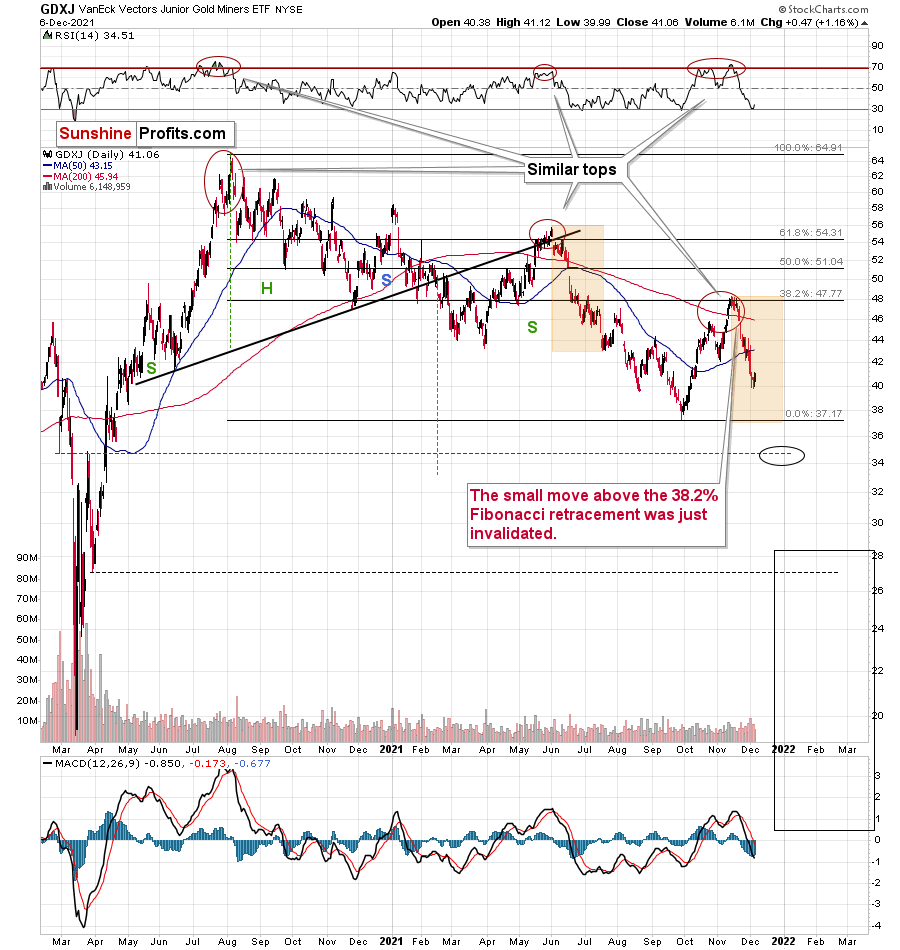
While the GDX ETF moved back to its November lows, the GDXJ ETF (a proxy for junior mining stocks) is well below the analogous lows.
What’s likely to happen next? Well… let’s take a look at gold.
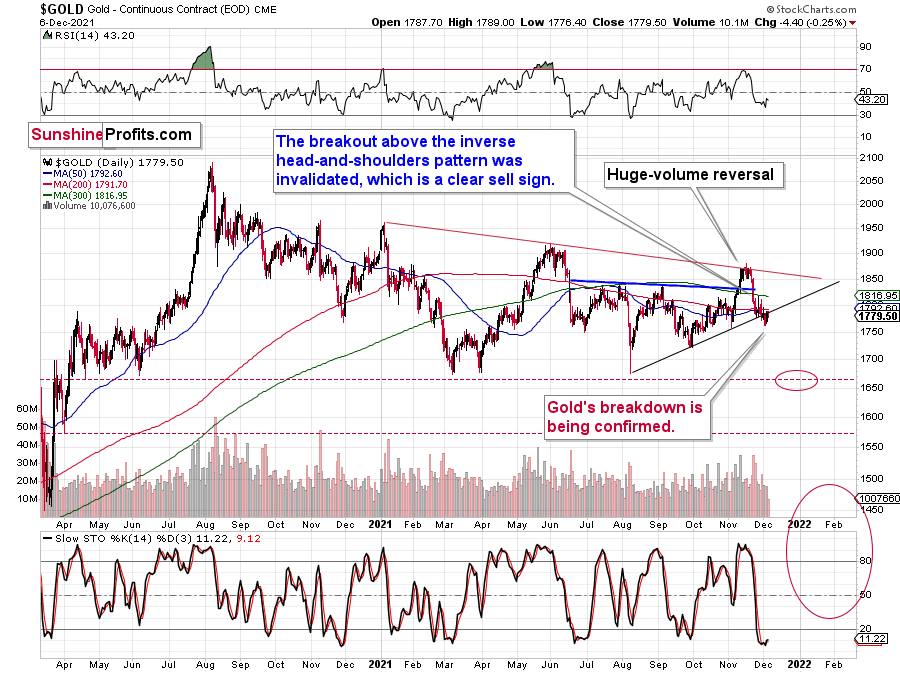
Gold is after a breakdown below its rising support line based on previous lows, and this breakdown is now being verified.
Gold broke below this support line on Thursday (Dec. 2), moved back to it on Friday (Dec. 3) without breaking back above it, and declined once again yesterday (Dec. 6). The decline was not huge (just $4.40), but it was enough as what counts is that it was the third consecutive trading day during which gold didn’t invalidate the breakdown. This makes it a confirmed breakdown, with very bearish implications going forward.
In this environment, gold, silver, and mining stocks are likely to move lower in the short term.
This is especially the case given that the USD Index is likely to move higher once again.
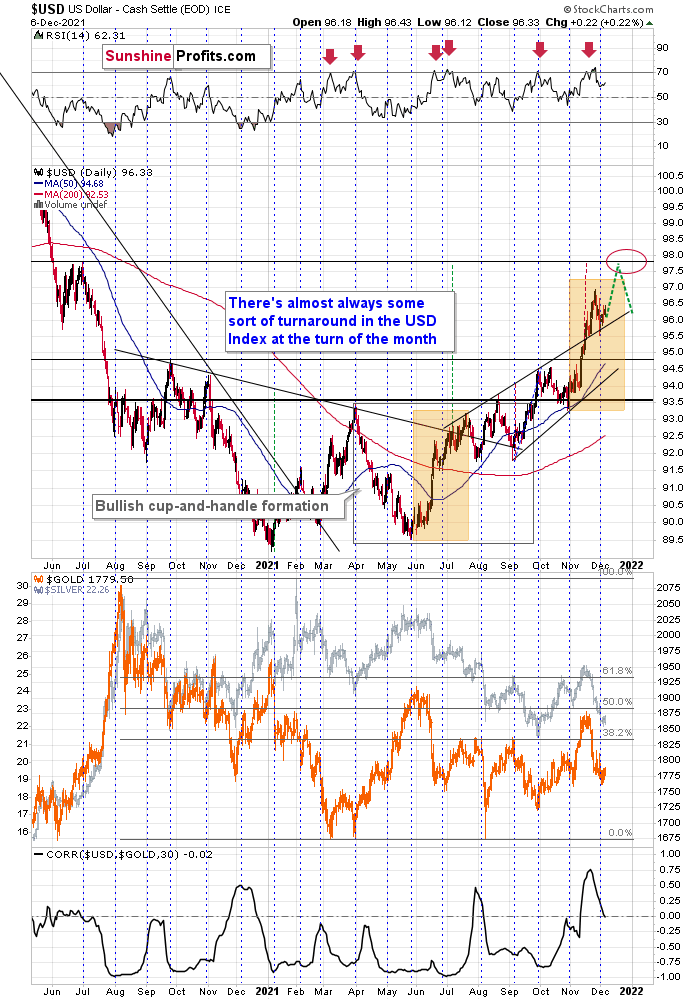
This would be in tune with what I wrote previously about the shape of the USD’s rally. Namely, that the July performance is being somewhat repeated.
This time, though, it seems that the upside target might be higher than the upper part of the orange rectangle (which would make this and the mid-2021 rallies identical).
Namely, there’s strong resistance provided by the mid-2020 high, and there’s also another trading technique pointing to the proximity of 98 to be the target for the current rally.
The USD Index broke above the rising wedge, and it then verified the breakout above this wedge (that’s the recent short-term decline). The size of the rally that is likely to follow the breakout is quite likely to be equal or similar to the width of the wedge. I marked that with red, dashed lines, and this technique confirms the target just below the 98 level.
I also marked the USD’s most likely short-term price path with green lines. It seems to me that the USD Index will rally soon, and then correct to more or less current levels (or perhaps lower).
The short-term upswing could trigger gold’s decline to the previous lows, while the following corrective pullback in the USDX could trigger gold’s corrective upswing (from its 2021 lows). This would be in perfect tune with what happened in 2013 right before the huge slide in the precious metals and mining stocks.
The mid-December FOMC could be the turning moment for the U.S. dollar and for other markets, but it’s not 100% clear whether it will be this development that triggers the short-term reversal.
So, all in all, the short-term outlook for the precious metals market remains bearish, and so does the outlook for the next few months. It’s likely that we’ll see some kind of a rebound once gold moves to its previous 2021 lows, though.
Having said that, let’s take a look at the markets from a more fundamental point of view.
A Hawkish Christmas
With inflation still a problem and the Fed shifting from observer to conqueror, the FOMC’s Dec. 14/15 policy meeting should provide dollar bulls with an early Christmas present. To explain, with politics and the financial markets on a collision course of competing interests, volatility has resurfaced. And with the PMs caught in the crossfire, their trepidation should turn into devastation over the medium term.
For context, I wrote on Nov. 18:
If prices keep rising and consumer confidence keeps falling, eventually demand destruction unfolds. As a result, if policymakers don’t solve their inflationary conundrum, failure to do so will likely push the U.S. economy into recession.
Second, the political component shouldn’t be ignored. U.S. President Joe Biden’s approval ratings keep hitting new lows along with consumer confidence. Thus, is it in his best interest to maintain the status quo? Of course not. That’s why he’s been so forceful on inflation over the last few weeks. Essentially, if he (and/or the Fed) does nothing, he’ll likely lose the next presidential election and the Democrats will likely lose control of Congress. However, if he tames inflation, then he’s a hero. And left with those two options, which one do you think he’ll choose?
To that point, with investors now coming around to our way of thinking, Bank of America highlighted the dynamic on Dec. 3.
Please see below:
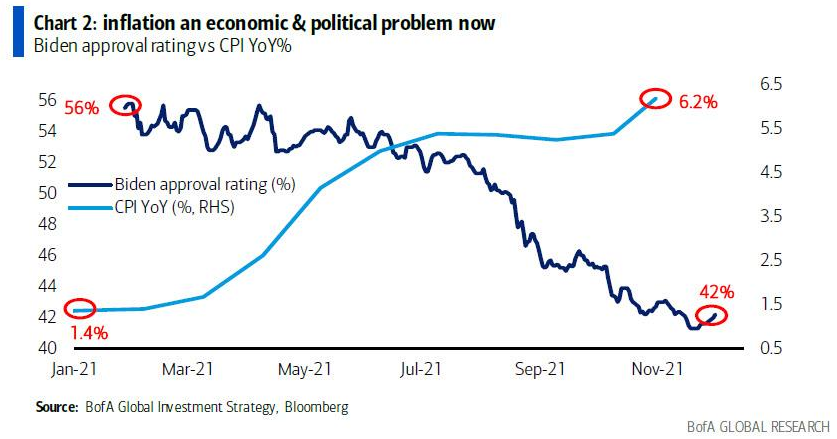
To explain, the light blue line above tracks the year-over-year (YoY) percentage change in the headline Consumer Price Index (CPI), while the dark blue line above tracks Biden’s approval rating. If you analyze the relationship, you can see that Americans aren’t celebrating the recent bout of inflation.
Thus, it’s no surprise that Biden and Fed Chairman Jerome Powell have accelerated their hawkish rhetoric in recent weeks. Remember: with political survival taking precedence over the financial markets’ performance, liquidity bulls will likely learn the hard way over the medium term.
In addition, Powell said the following on Dec. 1:
“Policy has adapted to that and will continue to adapt. We’ve seen inflation be more persistent. We’ve seen the factors that are causing higher inflation to be more persistent….
“We have to balance those two goals [the labor market and inflation] when they are in tension, as they are right now," Powell said. “But I assure you we will use our tools to make sure that this high inflation we are experiencing does not become entrenched.”
And while "tension" means that inflation is hot while the U.S. labor market is lukewarm, The Conference Board released its Employment Trends Index (ETI) on Dec. 6. And with the index increasing from 113.03 in October to 114.49 in November, it's another all-time high (the blue line below).
Please see below:
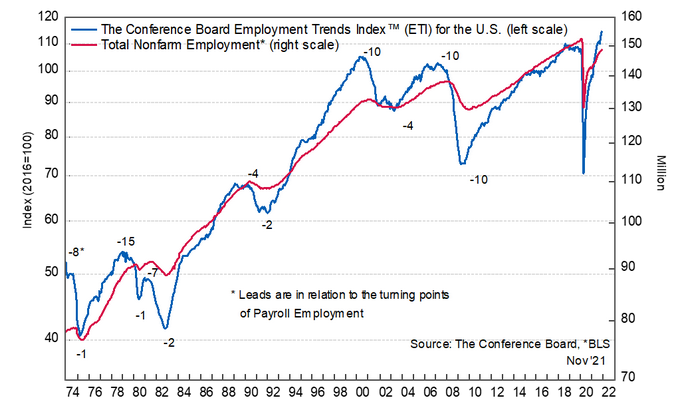
Gad Levanon, Head of The Conference Board Labor Markets Institute, said:
“The Employment Trends Index continues to advance steadily, suggesting a decent outlook for job growth over the next several months. In that context, November’s disappointing payrolls growth may be an outlier rather than a new trend. Of course, this is contingent on the emerging Omicron variant—a new wildcard that threatens to extend COVID-19’s impacts on job growth beyond Delta….
“We currently project the unemployment rate – already down to 4.2 percent – to approach 3.0 percent by the end of 2022, which would mark a 70-year low. Indeed, even if pandemic disruptions to labor supply fully subside in the year ahead, a tight labor market is likely here for the foreseeable future. Employers should expect recruiting difficulties and quit rates to remain high, fueling the upward pressure on wages.”
And how should all of this influence the Fed?
Well, with Powell wanting to “retire” the word “transitory,” the labor market is the only laggard left in the hawkish equation. However, with U.S. employment forging on at a respectable pace, calming inflation is now Biden and Powell’s top priority.
To that point, the winds of change can already be felt across the financial markets. For example, stock market volatility is rising, risk-on currencies are whipsawing, and commodities got rocked. And with more of the same likely to occur over the medium term, the PMs’ downtrend should have plenty of room to run.
Furthermore, not only does Morgan Stanley expect an “accelerated taper announcement” on Dec. 15 (like Goldman Sachs), but the investment bank also expects the FOMC to pull forward its interest rate expectations.
Please see below:
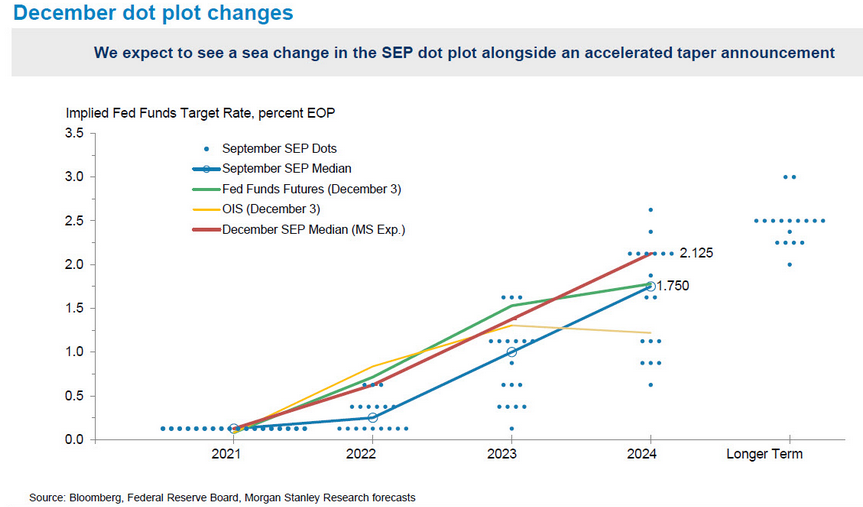
To explain, the blue line above tracks the FOMC’s median dots from its September Summary of Economic Projections. For context, the dots represent how many officials (and when) expect the U.S. Federal Funds Rate to reach certain levels.
However, if you focus your attention on the red line above, you can see that Morgan Stanley now expects the FOMC’s median dots to increase in 2022, 2023, and 2024. As a result, while I’ve been warning for months that surging inflation would elicit a hawkish shift, the death of QE may officially be announced on Dec. 15.
And as the drama unfolds, the time-tested relationship of ‘USD Index up, PMs down’ proved its worth once again. And with more room to run, the greenback has the most to gain from a hawkish Fed.
Please see below:
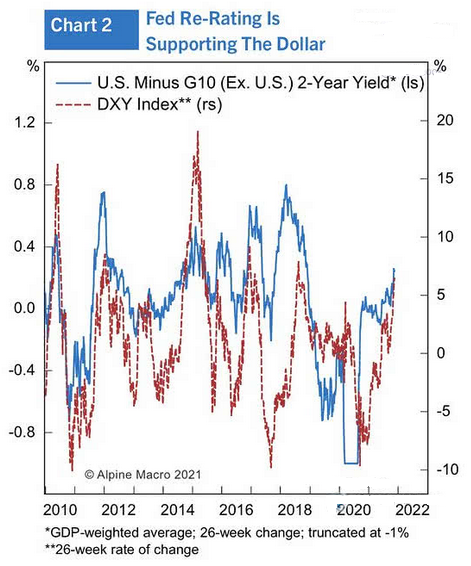
To explain, the red line above tracks the USD Index, while the blue line above tracks the spread between the U.S. 2-Year Treasury yield and the weighted-average G10 2-year yield. In a nutshell: when short-term interest rates in the U.S. outperform (underperform) other G10 countries, the blue line rises (falls).
And if you analyze the relationship, you can see that U.S. outperformance (the blue line rising) often coincides with a stronger USD Index (the red line rising). Thus, with a hawkish Fed poised to put upward pressure on short-term interest rates, the fundamental foundation supporting the U.S. dollar remains extremely strong.
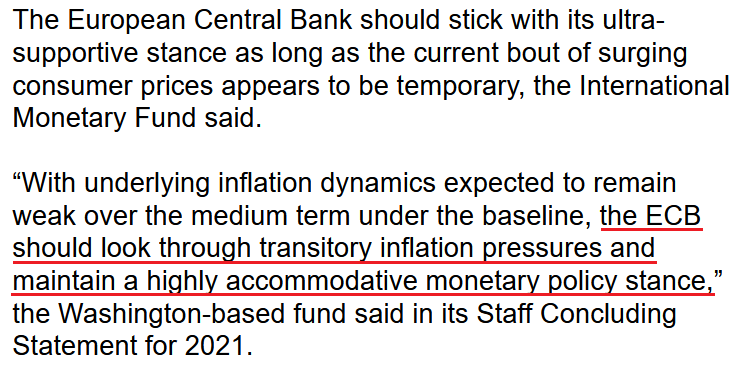
Finally, with the EUR/USD accounting for nearly 58% of the USD Index’s movement, the currency pair has an outsized influence on the dollar basket. And while annual inflation approaches 5% in the Eurozone (though it’s nearly all driven by energy prices), the International Monetary Fund (IMF) chimed in on Dec. 6.
For context, the IMF hedged by saying that the “ECB should also stand ready to scale down and then terminate asset purchases and TLTROs, followed by a gradual adjustment of policy rates, should high inflation prove to be more durable.”
However, with that kind of policy response likely months and months away, the IMF concluded:
 Source: Bloomberg
The bottom line? With Biden and Powell waging war on inflation and the ECB and its confidants waving the white flag, the EUR/USD remains fundamentally overvalued. And with relative GDP growth, relative interest rates and relative outprinting all supporting a weaker EUR/USD, the USD Index has a fundamental pathway well above my medium-/short- term target of ~98. Moreover, with the Fed poised to amplify its hawkish rhetoric/policy, the dollar’s Christmas fun has just begun.
In conclusion, the PMs were mixed on Dec. 6, as the S&P 500 helped mining stocks outperform. However, with their rallies becoming smaller and their drawdowns becoming larger, it’s likely only a matter of time before sharp re-ratings occur. As a result, the bearish thesis remains intact, and it will likely take a Christmas miracle to reverse the PMs’ downtrend.
Overview of the Upcoming Part of the Decline
- It seems to me that the current corrective upswing in gold is about to be over soon, and the next short-term move lower is about to begin. Since it appears to be another short-term move more than a continuation of a bigger decline, I think that junior miners will be likely to (at least initially) decline more than silver.
- It seems that the first stop for gold will be close to its previous 2021 lows, slightly below $1,700. Then it will likely correct a bit, but it’s unclear if I want to exit or reverse the current short position based on that – it depends on the number and the nature of the bullish indications that we get at that time.
- After the above-mentioned correction, we’re likely to see a powerful slide, perhaps close to the 2020 low ($1,450 - $1,500).
- If we see a situation where miners slide in a meaningful and volatile way while silver doesn’t (it just declines moderately), I plan to – once again – switch from short positions in miners to short positions in silver. At this time, it’s too early to say at what price levels this could take place, and if we get this kind of opportunity at all – perhaps with gold close to $1,600.
- I plan to exit all remaining short positions once gold shows substantial strength relative to the USD Index while the latter is still rallying. This may be the case with gold close to $1,350 - $1,400. I expect silver to fall the hardest in the final part of the move. This moment (when gold performs very strongly against the rallying USD and miners are strong relative to gold after its substantial decline) is likely to be the best entry point for long-term investments, in my view. This can also happen with gold close to $1,375, but at the moment it’s too early to say with certainty. I expect the final bottom to take place near the end of the year, perhaps in mid-December. It is not set in stone that PMs have to bottom at that time. If not then, then early 2022 would become a likely time target.
- As a confirmation for the above, I will use the (upcoming or perhaps we have already seen it?) top in the general stock market as the starting point for the three-month countdown. The reason is that after the 1929 top, gold miners declined for about three months after the general stock market started to slide. We also saw some confirmations of this theory based on the analogy to 2008. All in all, the precious metals sector is likely to bottom about three months after the general stock market tops. The additional confirmation will come from the tapering schedule, as markets are likely to move on the rumor and reverse on the fact as they tend to do in general.
- The above is based on the information available today, and it might change in the following days/weeks.
You will find my general overview of the outlook for gold on the chart below:
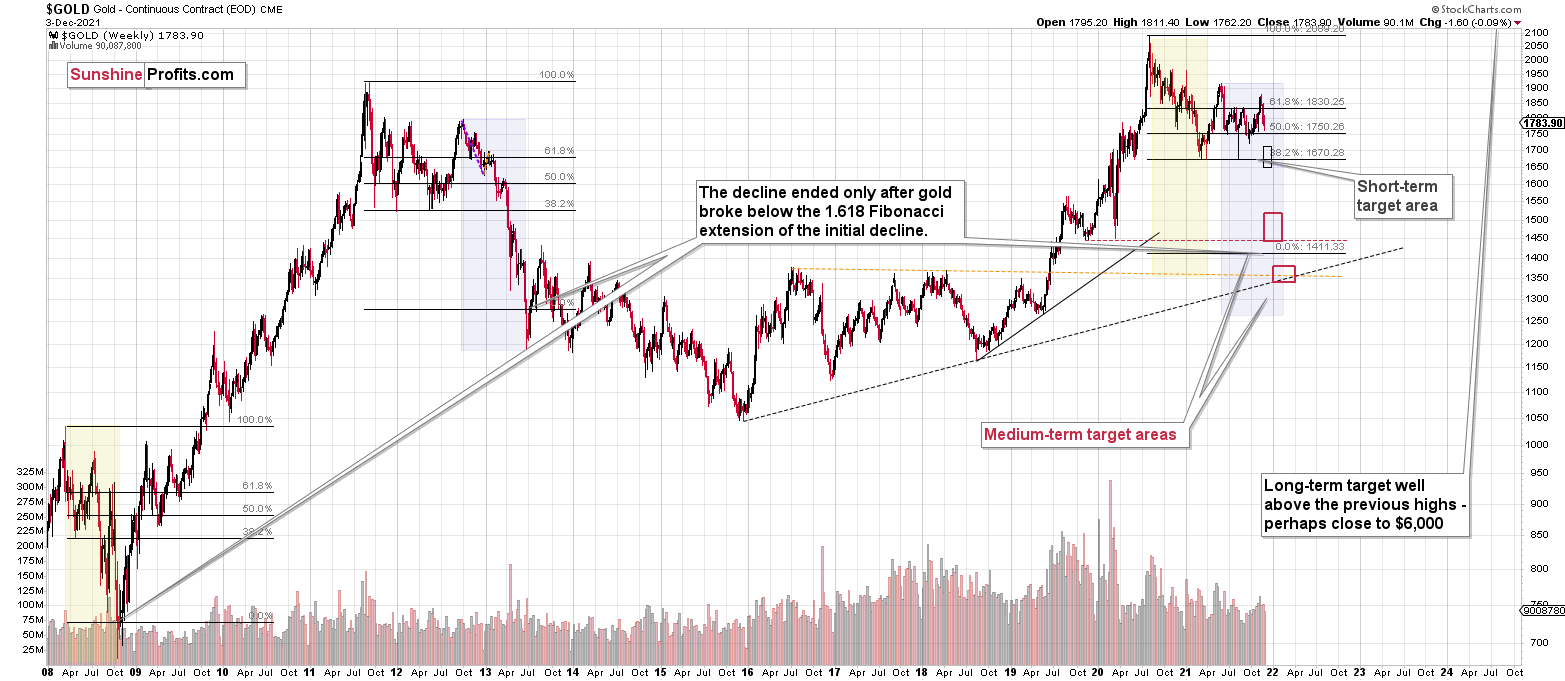
Please note that the above timing details are relatively broad and “for general overview only” – so that you know more or less what I think and how volatile I think the moves are likely to be – on an approximate basis. These time targets are not binding or clear enough for me to think that they should be used for purchasing options, warrants or similar instruments.
Letters to the Editor
Q: How much emphasis are you placing on the CPI report on the 10th? Jim Rickart predicts a massive crash as disinflation appears in the report.
A: I place little emphasis on the CPI report on the 10th as the markets could move on this report or based on any other report. Whether it is this report or something else, it doesn’t really matter to me. I will not be trying to “guesstimate” the report’s numbers, but, instead, I’ll focus on what way the markets are likely to react to a positive and negative surprise, and what they will likely do if the numbers are as expected.
Based on the way gold, silver, mining stocks, USD Index, stock markets, and the links between them performed recently and in analogous periods, it seems to me that any possible bullish reaction in the precious metals market would be rather dimmed and brief. However, a bearish reaction could start something much bigger.
I’d say that about any upcoming piece of news though. The mid-December FOMC seems more important than other upcoming events, but, as I wrote previously, it’s not the event or news released itself that’s driving the prices, but the rumors preceding the announcement. The fact itself (news) could actually trigger the opposite reaction to the likely one if the markets exaggerate the previous move.
In other words, I don’t care that much what triggers the move. I care about what kind of move it’s likely to be, as that’s the information that we need to position ourselves accordingly and make the most of the upcoming moves. One way to describe it would be to say that I prefer to place my attention on what brings real value.
Summary
Summing up, gold declined in tune with my long-term-based indications, and the medium-term downtrend appears to have resumed. Based on the analogy to 2013 and other factors, a bigger decline in gold appears to be just around the corner (regardless of what happens in the very near term).
If the new Covid-19 variant makes the vaccine rather useless, we might be in for very wild price moves in most markets. In the case of the precious metals sector, the initial move should be to the downside, but at the same time, it makes the long-term outlook even more bullish.
It seems that we might see a short-term bottom close to the middle of December, and perhaps that’s when gold will move to its previous 2021 lows. However, I don’t think that it would be the final bottom. Conversely, it seems that the final bottom would form lower after a short-term correction (from the above-mentioned December lows).
From the medium-term point of view, the key two long-term factors remain the analogy to 2013 in gold and the broad head and shoulders pattern in the HUI Index. They both suggest much lower prices ahead.
It seems that our profits from the short positions are going to become truly epic in the following months.
After the sell-off (that takes gold to about $1,350 - $1,500), I expect the precious metals to rally significantly. The final part of the decline might take as little as 1-5 weeks, so it's important to stay alert to any changes.
Most importantly, please stay healthy and safe. We made a lot of money last March and this March, and it seems that we’re about to make much more on the upcoming decline, but you have to be healthy to enjoy the results.
As always, we'll keep you - our subscribers - informed.
By the way, we’re currently providing you with the possibility to extend your subscription by a year, two years or even three years with a special 20% discount. This discount can be applied right away, without the need to wait for your next renewal – if you choose to secure your premium access and complete the payment upfront. The boring time in the PMs is definitely over, and the time to pay close attention to the market is here. Naturally, it’s your capital, and the choice is up to you, but it seems that it might be a good idea to secure more premium access now while saving 20% at the same time. Our support team will be happy to assist you in the above-described upgrade at preferential terms – if you’d like to proceed, please contact us.
To summarize:
Trading capital (supplementary part of the portfolio; our opinion): Full speculative short positions (300% of the full position) in junior mining stocks are justified from the risk to reward point of view with the following binding exit profit-take price levels:
Mining stocks (price levels for the GDXJ ETF): binding profit-take exit price: $35.73; stop-loss: none (the volatility is too big to justify a stop-loss order in case of this particular trade)
Alternatively, if one seeks leverage, we’re providing the binding profit-take levels for the JDST (2x leveraged) and GDXD (3x leveraged – which is not suggested for most traders/investors due to the significant leverage). The binding profit-take level for the JDST: $16.18; stop-loss for the JDST: none (the volatility is too big to justify a SL order in case of this particular trade); binding profit-take level for the GDXD: $32.08; stop-loss for the GDXD: none (the volatility is too big to justify a SL order in case of this particular trade).
For-your-information targets (our opinion; we continue to think that mining stocks are the preferred way of taking advantage of the upcoming price move, but if for whatever reason one wants / has to use silver or gold for this trade, we are providing the details anyway.):
Silver futures downside profit-take exit price: $19.12
SLV profit-take exit price: $17.72
ZSL profit-take exit price: $41.38
Gold futures downside profit-take exit price: $1,683
HGD.TO – alternative (Canadian) inverse 2x leveraged gold stocks ETF – the upside profit-take exit price: $12.48
HZD.TO – alternative (Canadian) inverse 2x leveraged silver ETF – the upside profit-take exit price: $30.48
Long-term capital (core part of the portfolio; our opinion): No positions (in other words: cash
Insurance capital (core part of the portfolio; our opinion): Full position
Whether you already subscribed or not, we encourage you to find out how to make the most of our alerts and read our replies to the most common alert-and-gold-trading-related-questions.
Please note that we describe the situation for the day that the alert is posted in the trading section. In other words, if we are writing about a speculative position, it means that it is up-to-date on the day it was posted. We are also featuring the initial target prices to decide whether keeping a position on a given day is in tune with your approach (some moves are too small for medium-term traders, and some might appear too big for day-traders).
Additionally, you might want to read why our stop-loss orders are usually relatively far from the current price.
Please note that a full position doesn't mean using all of the capital for a given trade. You will find details on our thoughts on gold portfolio structuring in the Key Insights section on our website.
As a reminder - "initial target price" means exactly that - an "initial" one. It's not a price level at which we suggest closing positions. If this becomes the case (like it did in the previous trade), we will refer to these levels as levels of exit orders (exactly as we've done previously). Stop-loss levels, however, are naturally not "initial", but something that, in our opinion, might be entered as an order.
Since it is impossible to synchronize target prices and stop-loss levels for all the ETFs and ETNs with the main markets that we provide these levels for (gold, silver and mining stocks - the GDX ETF), the stop-loss levels and target prices for other ETNs and ETF (among other: UGL, GLL, AGQ, ZSL, NUGT, DUST, JNUG, JDST) are provided as supplementary, and not as "final". This means that if a stop-loss or a target level is reached for any of the "additional instruments" (GLL for instance), but not for the "main instrument" (gold in this case), we will view positions in both gold and GLL as still open and the stop-loss for GLL would have to be moved lower. On the other hand, if gold moves to a stop-loss level but GLL doesn't, then we will view both positions (in gold and GLL) as closed. In other words, since it's not possible to be 100% certain that each related instrument moves to a given level when the underlying instrument does, we can't provide levels that would be binding. The levels that we do provide are our best estimate of the levels that will correspond to the levels in the underlying assets, but it will be the underlying assets that one will need to focus on regarding the signs pointing to closing a given position or keeping it open. We might adjust the levels in the "additional instruments" without adjusting the levels in the "main instruments", which will simply mean that we have improved our estimation of these levels, not that we changed our outlook on the markets. We are already working on a tool that would update these levels daily for the most popular ETFs, ETNs and individual mining stocks.
Our preferred ways to invest in and to trade gold along with the reasoning can be found in the how to buy gold section. Furthermore, our preferred ETFs and ETNs can be found in our Gold & Silver ETF Ranking.
As a reminder, Gold & Silver Trading Alerts are posted before or on each trading day (we usually post them before the opening bell, but we don't promise doing that each day). If there's anything urgent, we will send you an additional small alert before posting the main one.
Thank you.
Przemyslaw Radomski, CFA
Founder, Editor-in-chief

