
tools spotlight

-
Is a Bigger Drop in Gold Just Around the Corner?
November 24, 2021, 8:36 AMAs expected, after the applauded increase, gold fell. But will it manage to bounce off the bottom or rather slide lower?
Today’s analysis is going to be all about gold, and for a good reason. Based on yesterday’s and Monday’s sessions, November is now a down month for gold. Please let that sink in.
Gold ended last week above $1,850, with almost everyone in the market cheering and making bets, on how soon gold will move above $1,900 and then rally to new yearly highs. It was after the completion of the inverse head-and-shoulders pattern, after all!
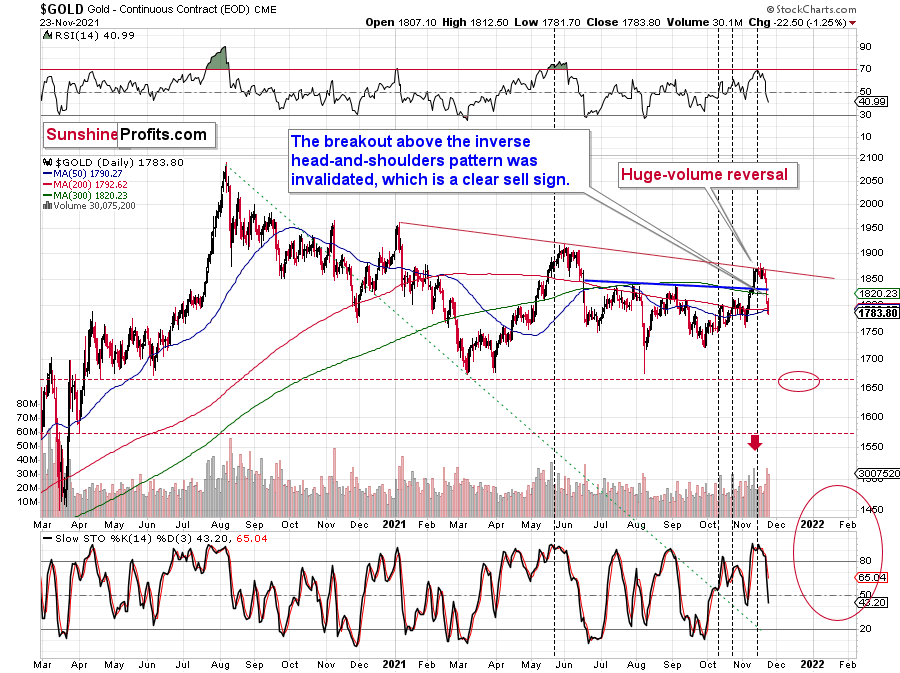
Well, I warned you that there were more long-term-based factors in place than the above-mentioned inverse head-and-shoulders pattern, and since longer-term patterns are more important than the shorter-term-based ones, the outlook was bearish, not bullish.
In fact, it was the very short-term rally that made the outlook bearish, because of three separate time-based indications for a reversal. And I don’t even mean other bearish indications like gold’s invalidation of the small breakout above the declining red resistance line.
Two of the indications that I described previously were the triangle-vertex-based reversals based on the below chart.
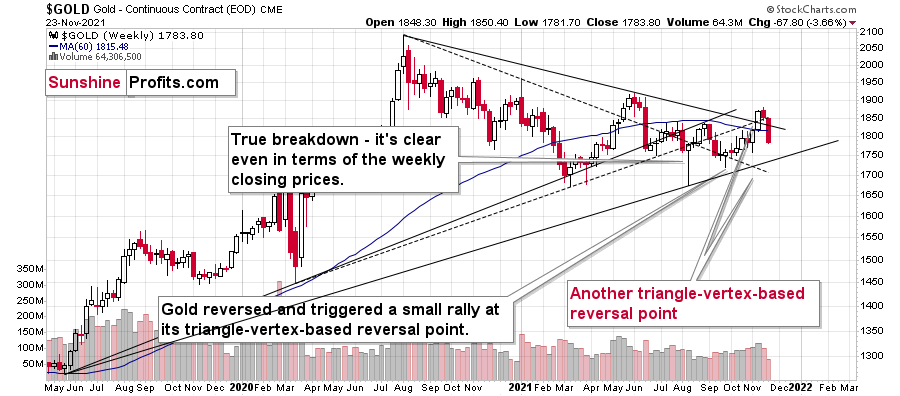
When resistance and support lines cross, markets tend to reverse their previous course. There’s no good logical explanation for why it should work, but it does. Not in every case, and I’m not promising that it will work in all cases, but I’ve seen it work so many times in the precious metals market so that I can say that ignoring these indications is a very costly endeavor.
Another indication came from gold’s long-term chart – its cyclical turning point was pointing to a major reversal, and the preceding move was up. Consequently, gold was likely to top.
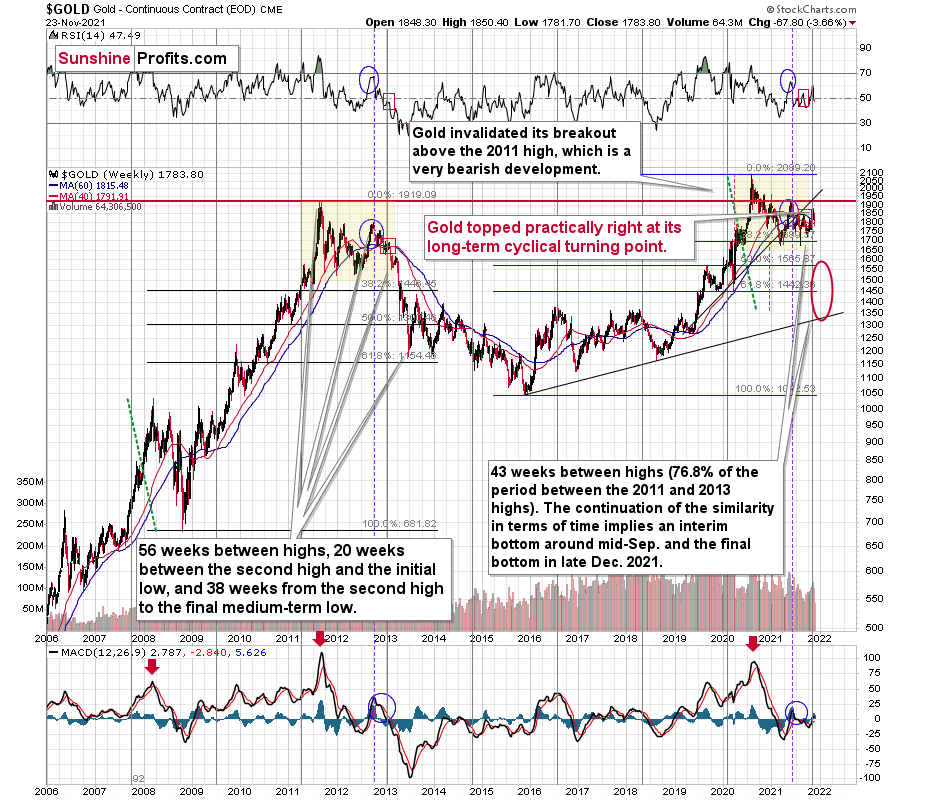
And that’s exactly what it did. Gold moved lower this week and taking into account the weekly high to yesterday’s closing price, it declined by over $100. Not bad for just two days.
But perhaps the most interesting things are now visible on gold’s monthly chart (based on monthly candlesticks).
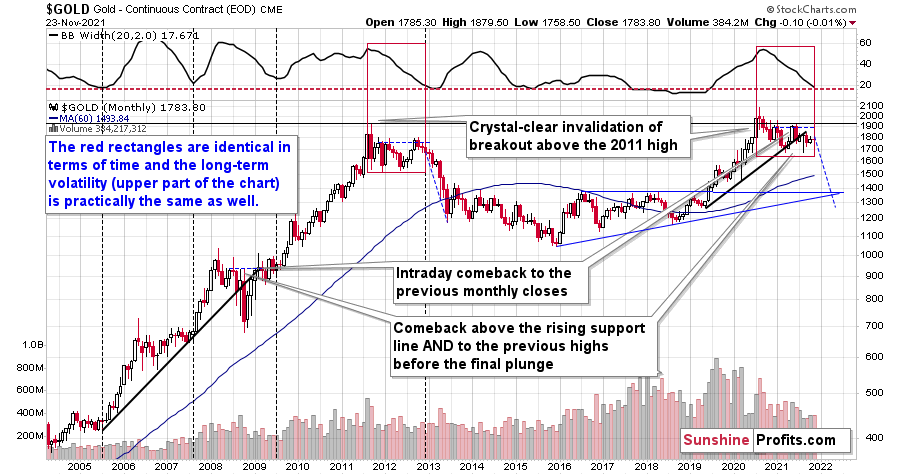
The above chart is loaded with clues. Let’s start with the similarity between now and 2013 that we see from this perspective.
The consolidation is similar not only in terms of the shape of the price move but also in terms of the decline in long-term volatility. The upper part of the above chart represents the width of the Bollinger Bands – a tool that is based on the volatility of the market. In short, greater volatility means broader Bands, meaning the above indicator would move higher. So, it’s essentially a proxy for volatility. Since we’re using monthly candlesticks here, it’s a proxy for long-term volatility.
Please note that the BB width not only moved from similar levels in 2011 and 2020 to similar levels in late-2012 and now, but it took approximately the same time to get there (if we start both moves with the final monthly high).
Like a Decade Ago?
The interesting thing about long-term volatility is that periods of low volatility tend to be followed by periods of high volatility – in either way. I marked four previous cases when we saw very low volatility after gold’s several-year-long rally, and it was indeed very close to the start of big moves.
One of those cases was the late-2012 case, which appears similar to what we see right now. Consequently, gold is likely to move quite significantly in the following months.
If the similarity to 2013 continues, gold would be likely to decline just as the blue dashed line suggests. This implies a move below $1,300. Will gold indeed decline to that low?
I doubt it, as there’s very strong support a bit below $1,400. It’s based on the previous highs and the rising support line based on the 2015 and 2018 lows.
The decline to those levels would have been enough of a reaction that was likely to follow the failed 2020 breakout above the 2011 highs. Invalidations of breakouts are strong “sell” signals, and invalidation of a breakout that was extremely important (as well as a breakout to a new all-time high), is likely to have very dire consequences.
Summing up, gold declined in tune with my long-term-based indications and the medium-term downtrend appears to have resumed. Based on the analogy to 2013 and other factors, a bigger decline in gold appears to be just around the corner (regardless of what happens in the very near term).
Thank you for reading our free analysis today. Please note that the above is just a small fraction of the full analyses that our subscribers enjoy on a regular basis. They include multiple premium details such as the interim targets for gold and mining stocks that could be reached in the next few weeks. We invite you to subscribe now and read today’s issue right away.
Sincerely,
Przemyslaw Radomski, CFA
Founder, Editor-in-chief -
War Against Public Enemy No. 1: Who Will Defeat Inflation?
November 23, 2021, 9:06 AMWith Fed Chairman Jerome Powell officially reappointed for a second term and Fed Governor Lael Brainard promoted to Vice-Chair, the chess pieces are now in place atop the FOMC. However, with inflation surging and the Fed materially behind the curve, the central bank has begun to ratchet up the hawkish rhetoric.
To explain, I wrote on Oct. 21:
While the deflationists have receded into the background and the Fed is hoping that 2022 will be more kind to its “transitory” narrative, inflation is still accelerating. And while the death of QE should help calm some of the fervor, an accelerated taper that concludes “by the middle of next year” is extremely bullish for the USD Index. Moreover, with the Fed still materially behind the inflation curve, hawkish whispers of further tightening should hit the wire in the coming months.
And right on cue, Fed Vice Chairman Richard Clarida (who still holds the position until January 2022) said on Nov. 19 that he’s concerned about the “upside risk to inflation.”
“I’ll be looking closely at the data that we get between now and the December meeting. It may well be appropriate at that meeting to have a discussion about increasing the pace at which we are reducing our asset purchases".
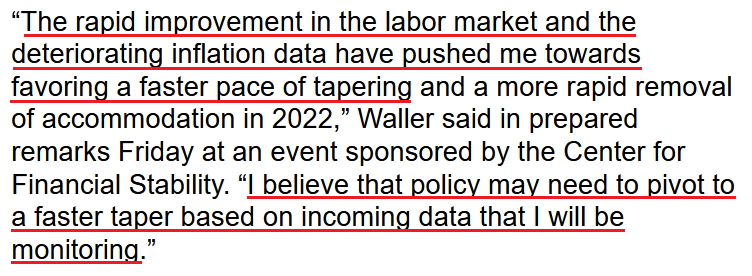
For context, the FOMC announced the taper only 20 days ago. And now, Clarida is hinting at accelerating the Fed’s already accelerated taper timeline. Furthermore, Fed Governor Christopher Waller (another voting FOMC member) said on Nov. 19 that two outcomes are possible over the coming months:
If “some other factor substantially slows the recovery, hindering the progress toward maximum employment, the FOMC could slow the taper,” Waller said. “But if the economy makes quick progress toward maximum employment or inflation data show no signs of retreating from their currently high readings, the committee may choose to speed up the taper, which would position it to accelerate subsequent steps in tightening monetary policy if necessary.”
And on which side does he reside?
 Source: Bloomberg
 Likewise, following the reappointment on Nov. 22, Powell said that “we know that high inflation takes a toll on families, especially those less able to meet the higher costs of essentials, like food, housing, and transportation. We will use our tools both to support the economy – a strong labor market – and to prevent higher inflation from becoming entrenched.”
And U.S. President Joe Biden added on Nov. 22 that he’s “confident that Chair Powell and Dr. Brainard’s focus on keeping inflation low, prices stable, and delivering full employment will make our economy stronger than ever before.”
Likewise, a statement by The White House had a similar message:
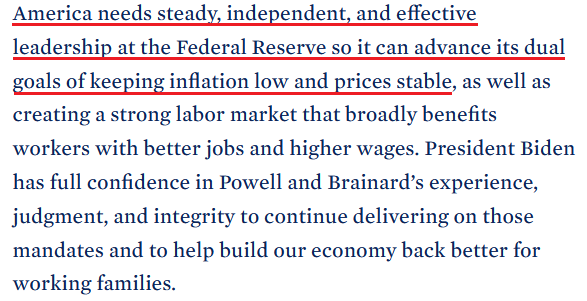 Source: The White House
Hawk Talk
And why is all of this so important? Well, because I warned on Nov. 18 that ‘the war on inflation’ is already underway. I wrote:
The University of Michigan released its Consumer Sentiment Index on Nov. 12. And with the index hitting a 10-year low, it’s no coincidence that The White House (and soon likely the Fed) has made inflation Public Enemy No. 1.
Please see below:
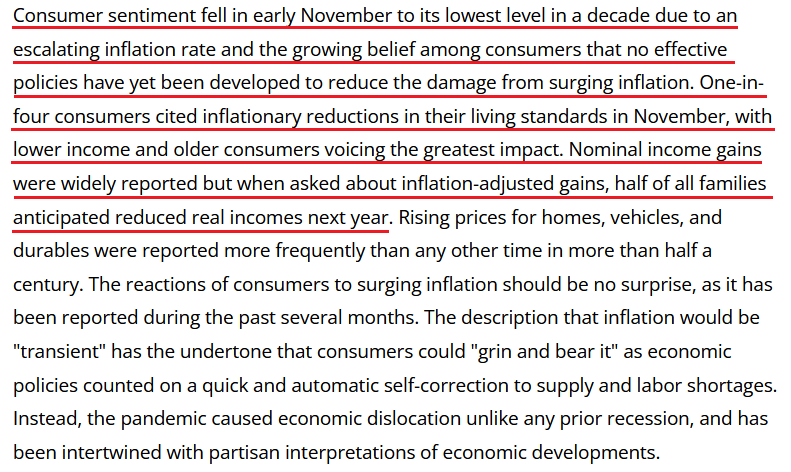 Source: the University of Michigan
Second, the political component shouldn’t be ignored. Biden’s approval ratings keep hitting new lows along with consumer confidence. Thus, is it in his best interest to maintain the status quo? Of course not. That’s why he’s been so forceful on inflation over the last few weeks. Essentially, if he (and/or the Fed) does nothing, he’ll likely lose the next presidential election and the Democrats will likely lose control of Congress. However, if he tames inflation, then he’s a hero. And left with those two options, which one do you think he’ll choose?
Thus, it’s important to remember that reappointing Powell was a hawkish move. And while the statement may seem laughable due to his dovish disposition over the last 10 months, Powell is still more hawkish than Brainard.
However, given the nature of U.S. inflation, we believe that it doesn’t matter who runs the Fed. The reality is: if prices keep rising and consumer confidence keeps falling, eventually demand destruction unfolds. Thus, whether it’s Powell or Brainard calling the shots, failure to solve the inflationary conundrum will likely push the U.S. economy into recession.
Despite that, though, investors reacted on Nov. 22. And after the reappointment of Powell lit a hawkish fire, rate hike bets began to smolder. To explain, futures traders previously expected the Fed to raise interest rates in September 2022. However, after the headline Consumer Price Index (CPI) surged by 6.2% year-over-year (YoY) on Nov. 10 – the highest YoY percentage increase since 1990 – the forecast was pulled forward to July 2022.
Now, with Powell reappointed on Nov. 22, futures traders expect the first rate hike to materialize in June 2022.
Please see below:
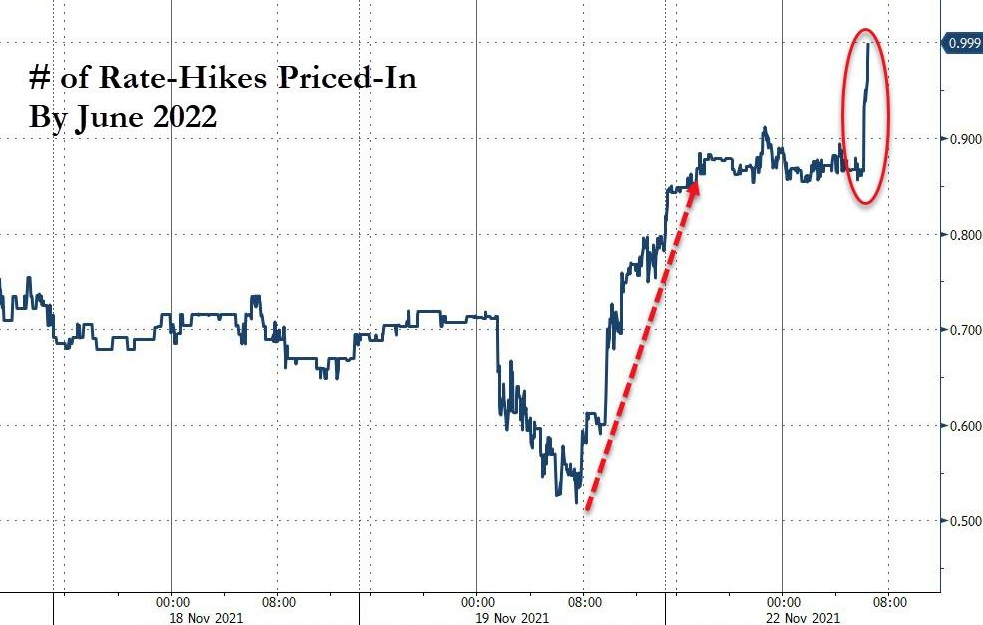 Source: Bloomberg/ZeroHedge
What’s more, the U.S. yield curve surged on Nov. 22, and the U.S. 5-Year Treasury yield hit a new 2021 high.
Please see below:
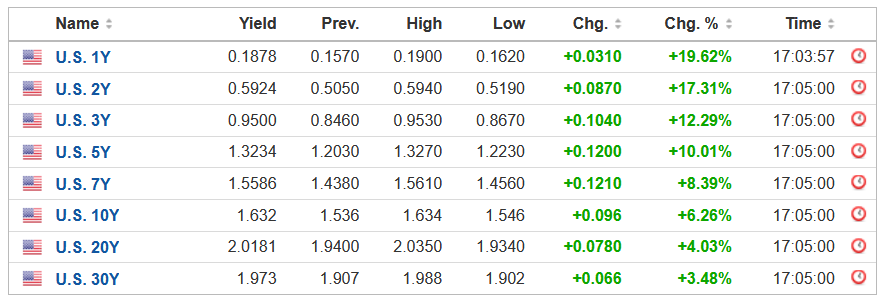 Source: Investing.com
 However, while the drama helped uplift the USD Index and upend the PMs, the ‘hawk talk’ is likely far from its peak. And with inflation still surging and the Fed still materially behind the curve, the FOMC will likely pivot from hawkish rhetoric to hawkish policy in the coming months. This means that bearish forecasts for gold and bearish forecasts for silver “have legs”.
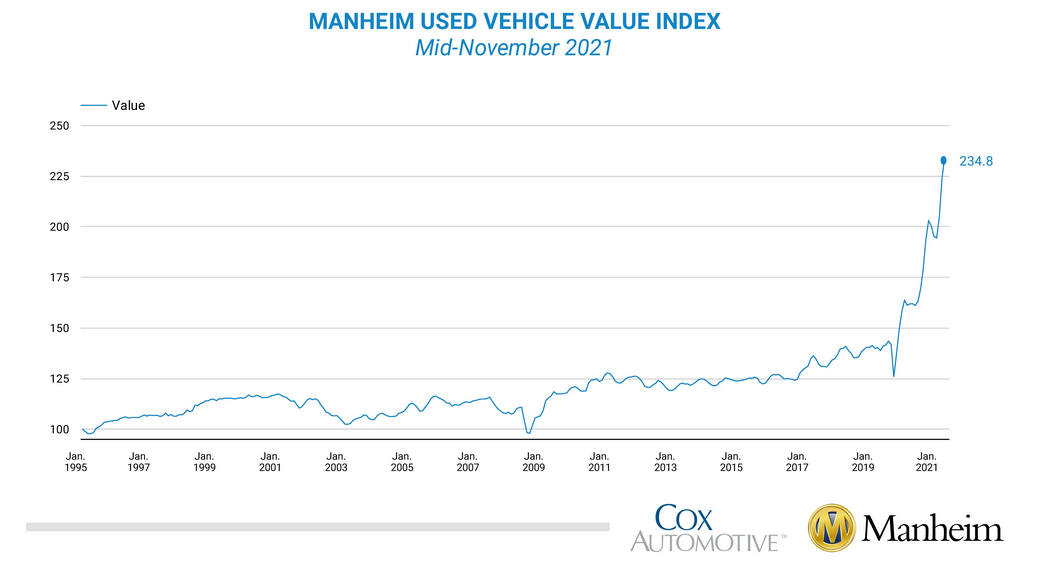
To explain, the Manheim Used Vehicle Value Index “increased 4.9% in the first 15 days of November compared to October. This brought the Manheim Used Vehicle Value Index to [a record high] 234.8, a 44.9% increase from November 2020.”
Please see below:
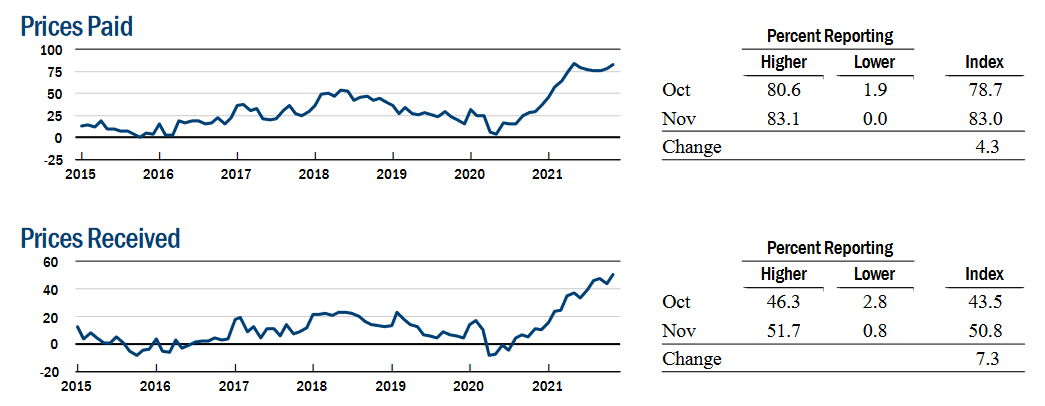
Second, the New York Fed released its Empire State Manufacturing Survey on Nov. 16. And while the headline index increased from 19.9 in October to 30.9 in November, the report revealed:
“The prices paid index edged up four points to 83.0, and the prices received index moved up seven points to a record high of 50.8, signaling ongoing substantial increases in both input prices and selling prices.”
Please see below:
 Source: New York Fed
Third, the Philadelphia Fed released its Manufacturing Business Outlook Survey on Nov. 18. And while the headline index increased from 24 in October to 39 in November, inflation remains the talk of the town. The report revealed:
“Firms continued to report increases in prices for inputs and their own goods. The prices paid diffusion index rose 10 points to 80.0, its highest reading since June’s 42-year high of 80.7. Over 82 percent of the firms reported increases in input prices, while 2 percent reported decreases. The current prices received index increased 12 points to 62.9, its highest reading since June 1974.”
On top of that, when Philadelphia manufacturing firms were asked about their pricing plans over the next four quarters, can you guess what they said?
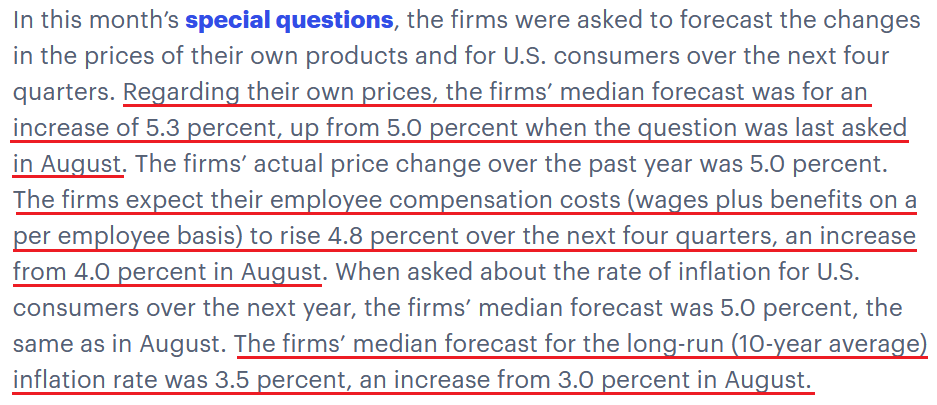 Source: Philadelphia Fed
The bottom line? 'The war on inflation' is upon us, as policymakers realize that pricing pressures won't abate without an active response. As a result, the FOMC's priorities have shifted from maximum employment to containing inflation. And while I've been warning for months that surging inflation would elicit hawkish shifts from the Fed, there is still plenty of room to run.
For example, the Fed is nowhere near its 2% annual target and likely won't be without raising interest rates. And while the U.S. dollar has been on fire recently, the more 'hawk talk' that materializes, the more bullish it is for the USD Index. As a result, while I seem to repeat the statement weekly, the U.S. dollar's fundamentals are stronger now than at any other point in 2021.
In conclusion, the PMs declined on Nov. 22, and the USD Index continued its bullish assault. And with U.S. Treasury yields waking up from their slumber, the two-headed monster showcased its fundamental might. Moreover, with inflation surging and the Fed poised to pivot even further in the coming months, gold should suffer more daily 'flash crashes' along the way.
Thank you for reading our free analysis today. Please note that the above is just a small fraction of the full analyses that our subscribers enjoy on a regular basis. They include multiple premium details such as the interim targets for gold and mining stocks that could be reached in the next few weeks. We invite you to subscribe now and read today’s issue right away.
Sincerely,
Przemyslaw Radomski, CFA
Founder, Editor-in-chief -
Like the Latest Bond Flick, the US Dollar Has No Time to Die
November 22, 2021, 8:34 AMWhile the dollar is on a tear, precious metal stocks have gotten away with it lately. But how long will their resistance last?
The USD Index (USDX)
After the USD Index’s negative response to the ECB’s monetary policy meeting on Oct. 28, I warned on Oct. 29 that dollar bears were unlikely to celebrate for much longer. I wrote:
Based on the rather random comment during the conference, the traders panicked and bought the EUR/USD, which triggered declines in the USD Index (after all, the EUR/USD is the largest component of the USDX).
Was the breakout to new 2021 lows invalidated? No. The true breakout was above the late-March highs (the August highs also served as a support level, but the March high is more important here) and it wasn’t invalidated.
What was the follow-up action? At the moment of writing these words, the USDX is up and trading at about 93.52, which is just 0.07 below the August high in terms of the closing prices. Consequently, it could easily be the case that the USD Index ends today’s session (and the week) back above this level.
You’ve probably heard the saying that time is more important than price. It’s the end of the month, so let’s check what happened in the case of previous turns of the month; that’s where we usually see major price turnarounds. I marked the short-term turnarounds close to the turns of the month with horizontal dashed blue lines, and it appears that, in the recent past, there was practically always some sort of a turnaround close to the end of the month. Consequently, seeing a turnaround (and a bottom) in the USD index now would be perfectly normal.
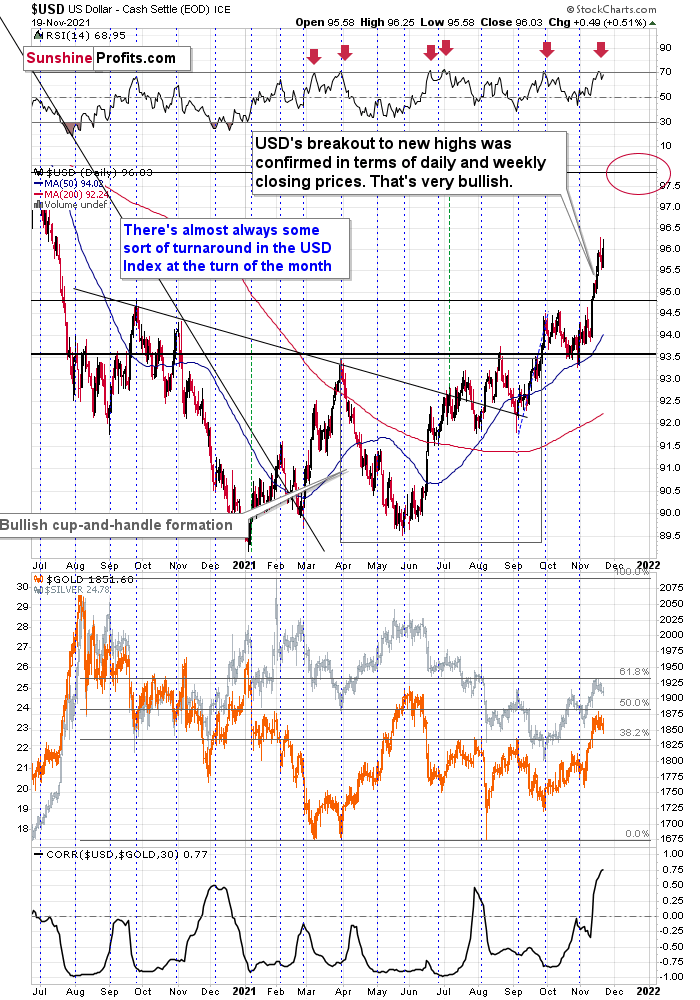
And with the USD Index making quick work of 94, 95, and now 96, the greenback’s rally continues to gain steam. What’s more, the USD Index also surged above its late 2020 resistance and 98 should be the next bullish milestone.
More importantly, however, gold, silver, and mining stocks are sensing that something is amiss. For example, while they largely ignored the USD Index’s recent ascent, their negative correlations resurfaced last week (on a very short-term basis, so far, but still). Moreover, while the precious metals’ recent rallies were likely euro-weakness-driven and not USD Index-strength-driven, the dollar basket’s uprising should elicit more pain for gold, silver, and mining stocks over the medium term.
To explain, I wrote on Nov. 17:
The euro recently declined and the prices of silver and gold recently rallied shortly after dovish comments from the eurozone. Namely, while the expansionary nature of fiscal and monetary decisions in the U.S. might be after its peak (with the infrastructure bill signed even despite high inflation numbers), the eurozone is far from limiting its expansionary (i.e., inflationary) policies, and it was just made clear recently.
That was bearish for the euro and bullish for the gold price – as more money (euros in this case) would be chasing the same amount of physical gold.
The point here is that it might have been the decline in the value of the European currency that caused gold to rally, and it had little to do with what happened in the USD Index.
Don’t get me wrong, most of the time, the gold-USD link is stable and negative. In some cases, gold shows strength or weakness by refusing to move in tune (and precisely: again) with U.S. dollar’s movement. But in this case, it seems that it’s not about the U.S. dollar at all (or mostly), but rather about what happened in the Eurozone and euro recently.
As a result, with the USD Index likely to take the lead in the coming months, the precious metals should suffer along the way. For context, the USD Index is approaching overbought territory and a short-term decline to ~95 isn’t out of the question. However, it’s more of a possibility than a given. Moreover, the greenback’s medium-term outlook remains robust, and any short-term pullback is likely a corrective downswing within a medium-term uptrend.
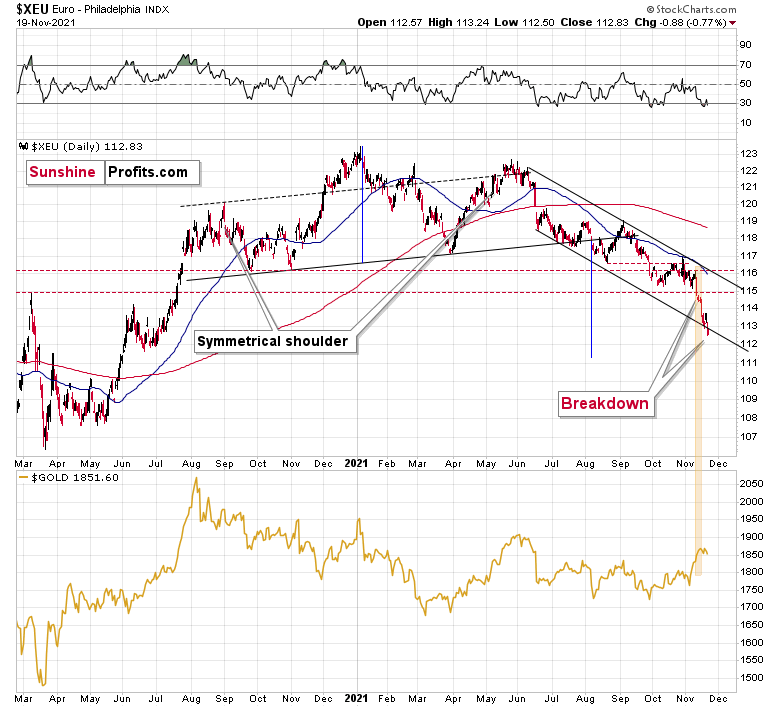
Circling back to the euro, I’ve been warning for months that the Euro Index was materially overvalued and that a sharp re-rating would likely unfold. I wrote previously:
The next temporary stop could be ~1.1500 (the March 2020 highs, then likely lower). For context, the EUR/USD accounts for nearly 58% of the movement of the USD Index, and that’s why the euro’s behavior is so important.
And after the Euro Index sunk to a new 2021 low last week, the European currency has officially fallen off a cliff. To that point, after breaking below the declining support line of its monthly channel, a drawdown to ~111 is likely next in line (which is signaled by the breakdown below its bearish head & shoulders pattern).
The Euro Index is near oversold territory and a short-term bounce may ensue, but the bearish medium-term implications remain intact.
Please see below:
Adding to our confidence (don’t get me wrong, there are no certainties in any market; it’s just that the bullish narrative for the USDX is even more bullish in my view), the USD Index often sizzles in the summer sun and major USDX rallies often start during the middle of the year. Summertime spikes have been mainstays on the USD Index’s historical record and in 2004, 2005, 2008, 2011, 2014 and 2018 a retest of the lows (or close to them) occurred before the USD Index began its upward flights (which is exactly what’s happened this time around).
Furthermore, profound rallies (marked by the red vertical dashed lines below) followed in 2008, 2011 and 2014. With the current situation mirroring the latter, a small consolidation on the long-term chart is exactly what occurred before the USD Index surged in 2014. Likewise, the USD Index recently bottomed near its 50-week moving average; an identical development occurred in 2014. More importantly, though, with bottoms in the precious metals market often occurring when gold trades in unison with the USD Index (after ceasing to respond to the USD’s rallies with declines), we’re still far away from that milestone in terms of both price and duration. Again, the recent move higher in the USD Index doesn’t necessarily apply in the case of the above rule, as it was not the strength of the USD but weakness in the euro that has driven it.
Likewise, with the USD Index now approaching its long-term rising support line (which is now resistance), a rally above the upward sloping black line below would invalidate the prior breakdown and support a move back above 100. However, with the dollar basket’s weekly RSI (Relative Strength Index) now above 70, a short-term consolidation may ensue.
Conversely, please note that the recent medium-term rally has been calmer than any major upswing witnessed over the last 20 years where the USD Index’s RSI has hit 70. I marked the recent rally in the RSI with an orange rectangle and I did the same with the second-least and third-least volatile of the medium-term upswings.
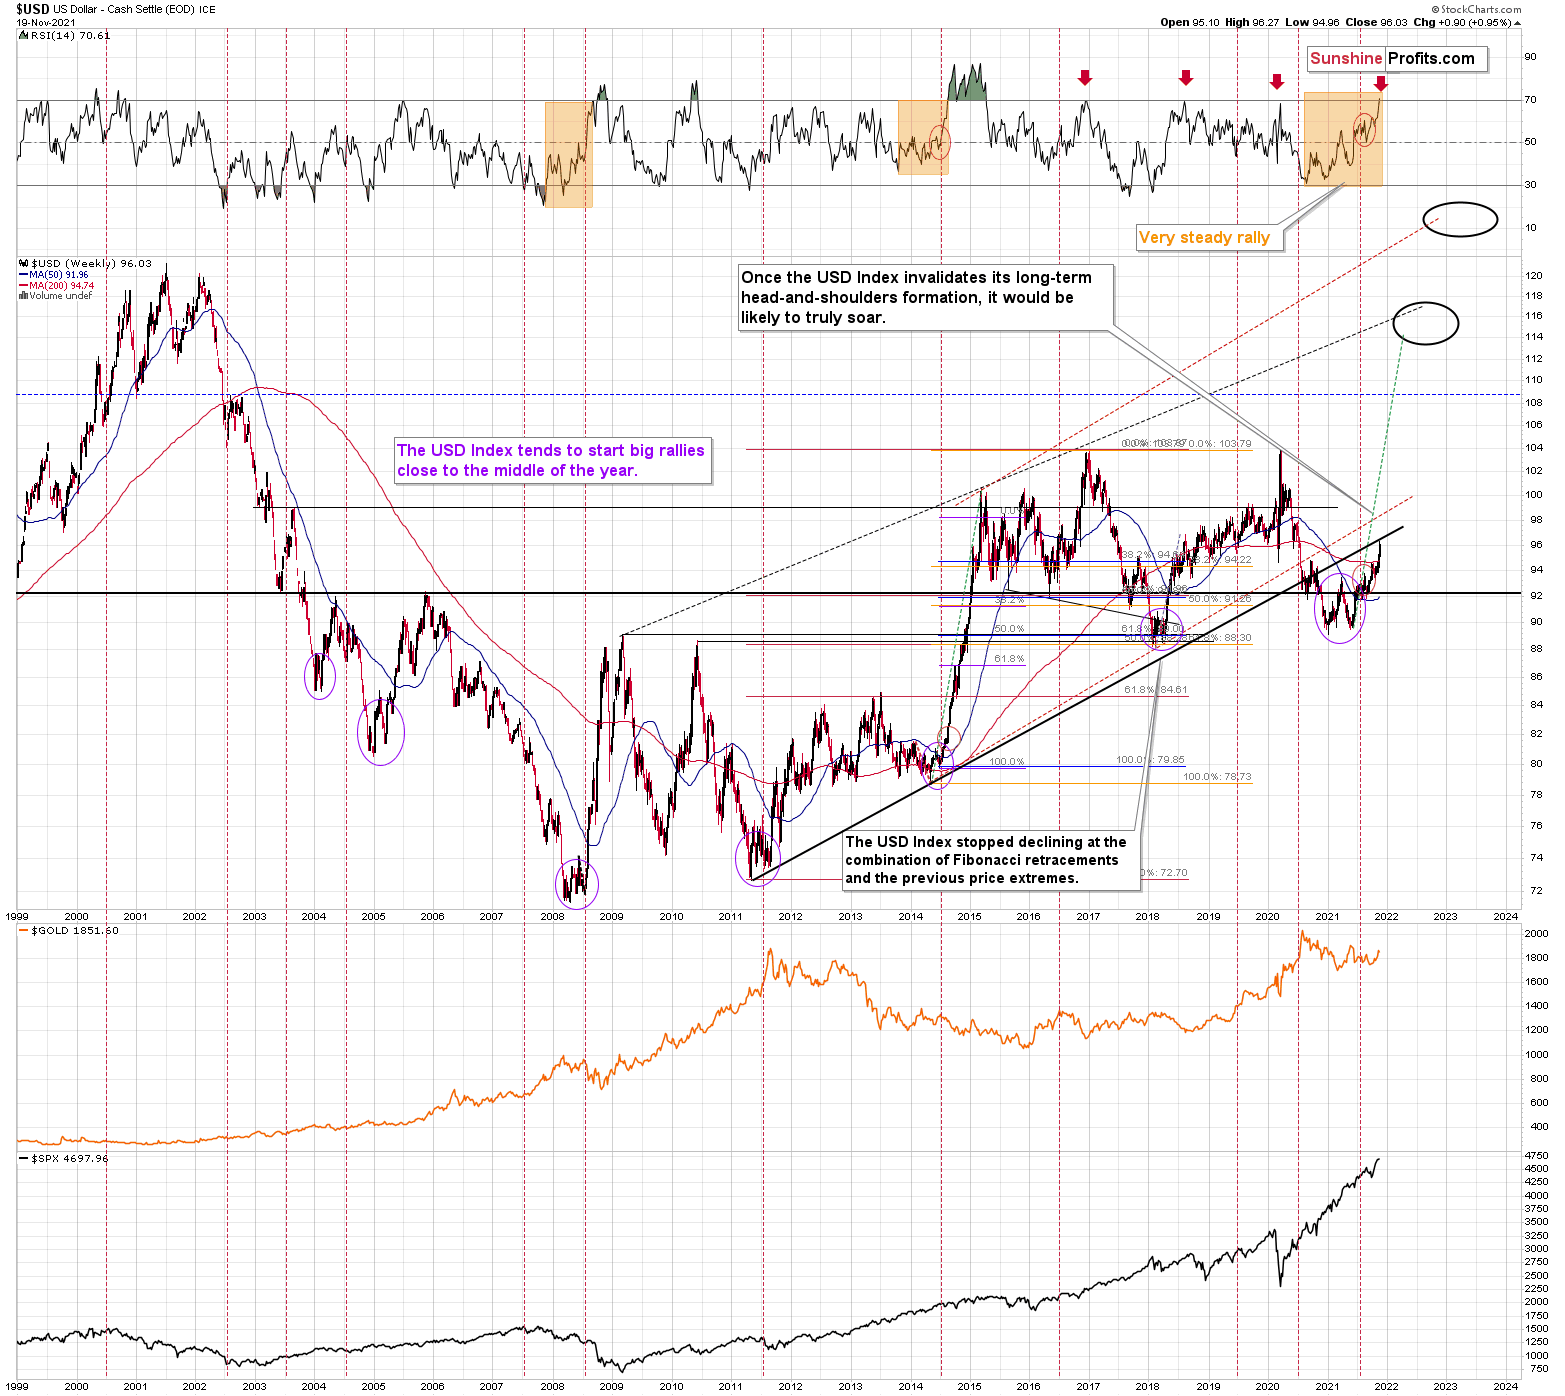
The sharp rallies in 2008 and 2014 were of much larger magnitudes. And in those historical analogies, the USD Index continued its surge for some time without suffering any material corrections.
As a result, the short-term outlook is more of a coin flip. However, the medium-term outlook remains profoundly bullish, and gold, silver, and mining stocks may resent the USD Index’s forthcoming uprising.
Just as the USD Index took a breather before its massive rally in 2014, it seems that we saw the same recently. This means that predicting higher gold prices (or the ones of silver) here is likely not a good idea.
Continuing the theme, the eye in the sky doesn’t lie. And with the USDX’s long-term breakout clearly visible, the wind still remains at the dollar’s back.
Please see below:
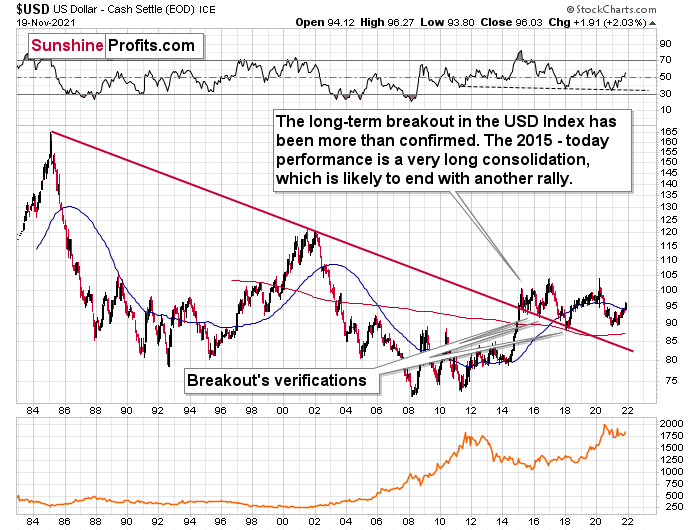
The bottom line?
With my initial 2021 target of 94.5 already hit, the ~98 target is likely to be reached over the medium term, and the USDX will likely exceed 100 at some point over the medium or long term. Keep in mind, though: we’re not bullish on the greenback because of the U.S.’ absolute outperformance. It’s because the region is fundamentally outperforming the Eurozone, the EUR/USD accounts for nearly 58% of the movement of the USD Index, and the relative performance is what really matters.
In conclusion, while the USD Index’s 2021 surge caught the consensus by surprise, I’ve been sounding the bullish alarm for many months. And with more strength likely to materialize over the medium term, the ‘death of the dollar’ narrative has been grossly over-exaggerated. Moreover, while gold, silver, and mining stocks recently ignored the greenback’s fervor, history implies that their relative strength won’t last. As a result, more downside will likely confront the precious metals over the next few months.
Thank you for reading our free analysis today. Please note that the above is just a small fraction of the full analyses that our subscribers enjoy on a regular basis. They include multiple premium details such as the interim targets for gold and mining stocks that could be reached in the next few weeks. We invite you to subscribe now and read today’s issue right away.
Sincerely,
Przemyslaw Radomski, CFA
Founder, Editor-in-chief -
Early (Gold Video) Heads-up before the Next Week
November 21, 2021, 11:26 AMIn today’s early heads-up video, I’m talking about the recent performance of gold stock prices (GDX ETF) and I’m providing my forecast for the gold stock prices in the following weeks. As I outlined last week – the outlook is bearish.
You can access the video using the following link:
-
The Slippery Slope of the USDX: Will It Drag Gold Down?
November 19, 2021, 9:29 AMIn Wednesday’s analysis, I focused on the specific situation in the currency market and its impact on the gold price. I told you that the USD Index was probably forming a short-term top, while the Euro Index was forming a short-term low. But I also wrote that – despite their usual link – this time, the decline in the USDX could actually make the gold price move lower, not higher. And that’s exactly what we saw yesterday. Specifically, I wrote the following:
“Bullish” or “bearish” refers to the future, not the past. In fact, the rally in the USD Index might need a breather as all markets – no matter how bullish or bearish they are – can’t rise or decline in a straight line without periodic corrections. The USD Index, gold, silver, mining stocks, and practically all the other markets are no exception to this rule. Even real estate prices don’t increase in the long run without periodic downturns.
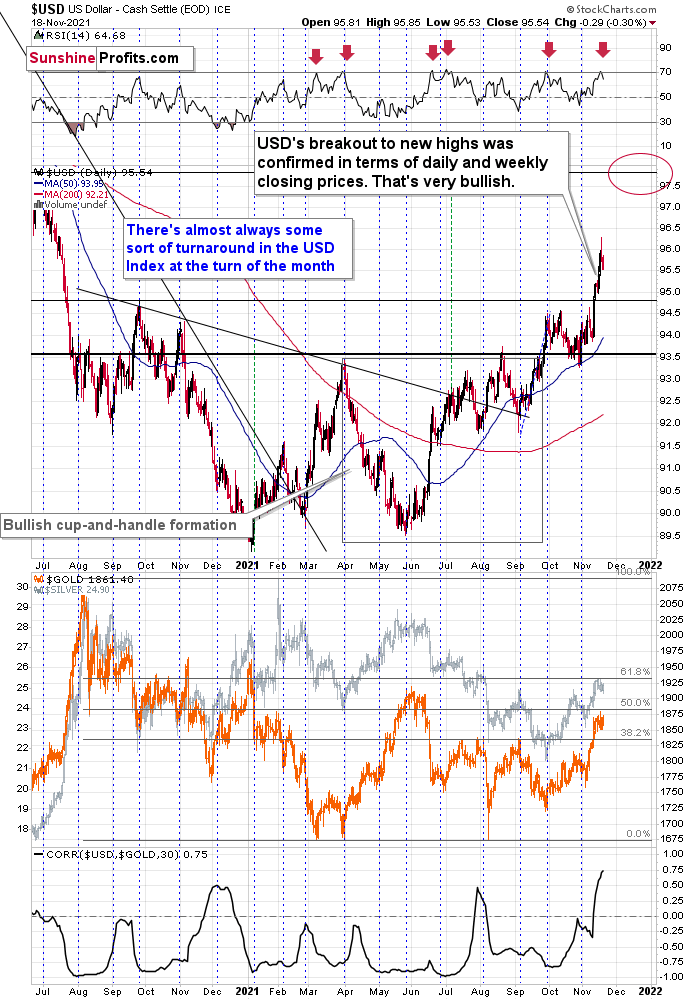
As you can see on the chart above, the U.S. currency index soared to almost 96 yesterday, and that was after an almost straight-up rally. That rally caused the RSI indicator to move above 70, which has been a quite precise short-term sell signal this year. In fact, in all the cases when we saw it, some kind of short-term correction followed.
Based on the size of the current rally, the current situation seems very similar to that of early March and late June. Back then, we saw short-term declines that took the USDX approximately a full index point lower. In the current case, this could mean a decline back to 95. This would be a perfectly natural thing for the USD Index to do right now, as the previous resistance (which is now serving as support) is located slightly below 95. The support is provided by the late-2020 high and the March 2020 low (not visible in the chart above).
“So, surely this corrective downswing in the USD Index would cause an even bigger rally in the precious metals sector, right?”
This is where things get complicated.
You see, the biggest (over 50%) part of the USD Index (which is a weighted average) is the EUR/USD currency pair. Let’s take a look at it.
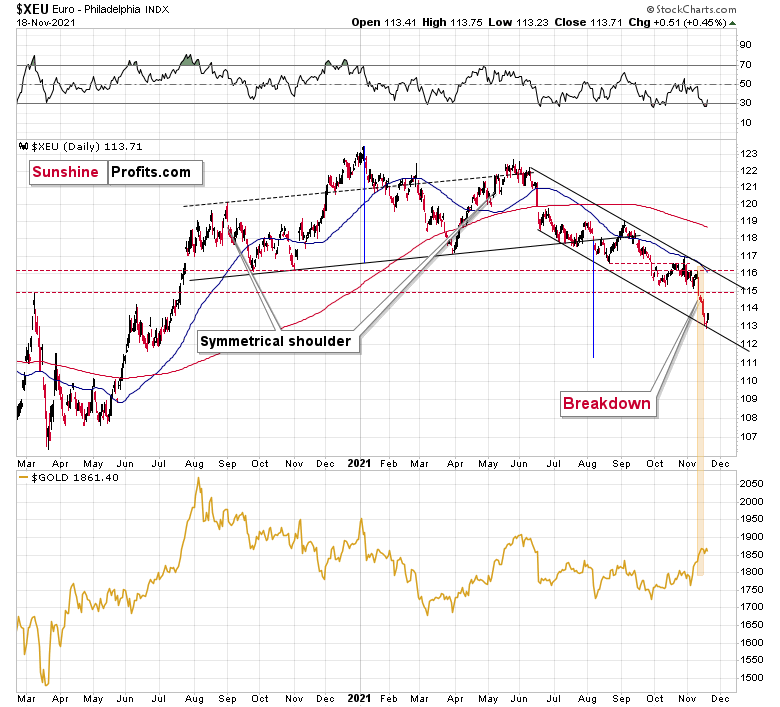
The Euro Index has dropped significantly over the past week and just as the RSI based on the USD Index flashed a sell signal, the RSI based on the Euro Index flashed a buy signal.
Also, the Euro Index just moved to the lower border of its declining trade channel, which is likely to indicate some kind of rebound.
Why am I discussing the euro here? Because that’s what’s complicated about the current USD-gold link.
The euro has recently declined and the prices of silver and gold have rallied shortly after the dovish comments from the eurozone. Namely, while the expansionary nature of fiscal and monetary policy decisions in the U.S. might be after its peak (with the infrastructure bill signed even despite high inflation numbers), the eurozone is far from limiting its expansionary (i.e. inflationary) policies and it has been made clear recently.
That was bearish for the euro and bullish for the gold price – as more money (in this case euros) would be chasing the same amount of physical gold bars.
The point here is that it might have been the decline in the value of the European currency that caused gold to rally, and it had little to do with what happened in the USD Index.
Don’t get me wrong, most of the time, the gold-USD link is stable and negative. In some cases, gold shows strength or weakness by refusing to move in line (and precisely: again) with the U.S. dollar’s movement. But in this case, it seems that it’s not about the U.S. dollar at all (or mostly), but rather about what happened in the eurozone and euro recently.
I marked the recent decline in the euro and the rally in gold with a golden rectangle.
The usual link between gold and USD would make one assume that lower USD Index values (due to higher EUR/USD values) would trigger a gold rally. However, given how things worked and the fact that we saw/heard the news coming from the Eurozone, it seems like this “temporary” and bearish for the PMs interpretation would actually prevail. It could also be the case that we see some kind of mixed reply from the precious metals sector when the USD Index and the Euro Index correct. The PMs could for example fall only after the situation regarding gold-USD link gets back to normal, that is perhaps after both currencies have corrected.
This is exactly what happened yesterday. The Euro Index moved higher, the USD Index moved lower, and gold – instead of soaring – declined.
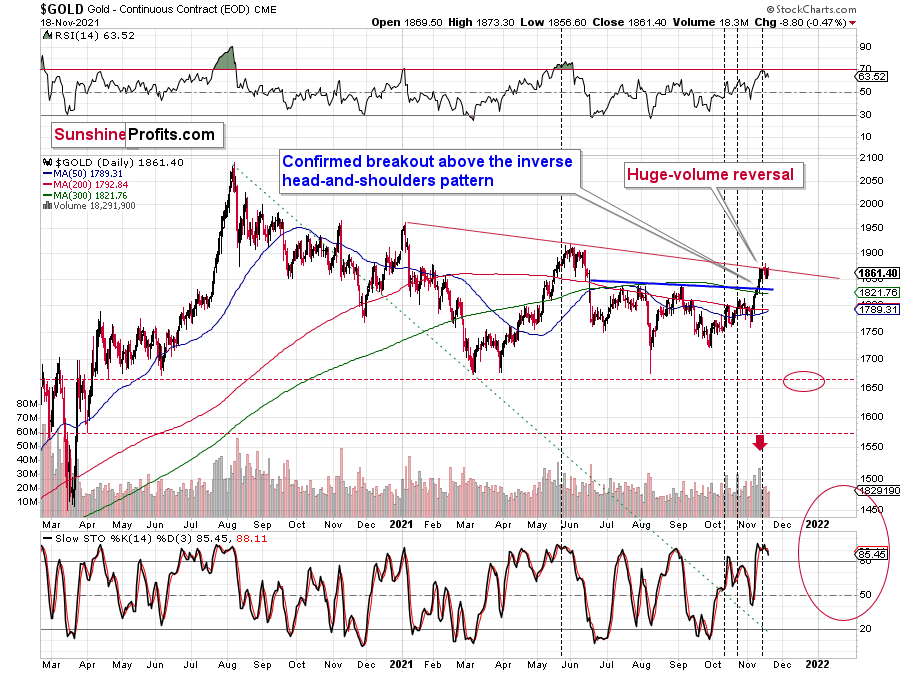
The USD Index ended the day 0.29 lower and gold declined by $8.80. That happened right after gold failed to break above its declining red resistance line. In other words, it seems quite likely that the top is in.
The RSI indicator was just close to 70, which is something that we usually see at the major tops. The sell signal from the Stochastic indicator confirms the bearish outlook as well.
Gold bulls likely expected that based on USD’s decline gold would break above the declining red resistance line, but the opposite happened. The rally in the precious metals market may have already run its course. In fact, it could be the case that the price of gold will soon invalidate the previous breakout above its inverse head and shoulders pattern. And when that happens, a very quick slide could follow.
Also, in today’s pre-market trading (at the moment of writing these words), the USD Index futures are up by 0.49, while gold is down by $0.30 (so it’s basically flat). This shows us that gold is likely transitioning from the stage where its rallies were euro-weakness based to a stage where its rallies would be USD-weakness based. And more precisely, where gold’s declines would be based on the strength of the USD Index.
Thank you for reading our free analysis today. Please note that the above is just a small fraction of the full analyses that our subscribers enjoy on a regular basis. They include multiple premium details such as the interim targets for gold and mining stocks that could be reached in the next few weeks. We invite you to subscribe now and read today’s issue right away.
Sincerely,
Przemyslaw Radomski, CFA
Founder, Editor-in-chief


Gold Investment News
Delivered To Your Inbox
Free Of Charge
Bonus: A week of free access to Gold & Silver StockPickers.
Gold Alerts
More-
Status
New 2024 Lows in Miners, New Highs in The USD Index
January 17, 2024, 12:19 PM -
Status
Soaring USD is SO Unsurprising – And SO Full of Implications
January 16, 2024, 8:40 AM -
Status
Rare Opportunity in Rare Earth Minerals?
January 15, 2024, 2:06 PM

