

Briefly: in our opinion, full (300% of the regular position size) speculative short positions in junior mining stocks are justified from the risk/reward point of view at the moment of publishing this Alert.
Today’s analysis is going to be very similar to yesterday’s issue, and there are two good reasons for it:
- Almost nothing changed in the precious metals sector
- The USD Index declined, which should have made the precious metals and mining stocks rally, but it didn’t, which further confirmed my bearish case for the short- and medium term.
In Tuesday’s analysis, I wrote the following about the 4-hour GDX ETF chart:
After verifying the breakdown below its rising support line, the GDX moved lower, just as I expected it to. Now it’s after a breakdown below its previous (November) lows, and it seems to be verifying that breakdown just as it verified the breakdown below the rising support line in late November.
The black dashed line in the above chart shows the resistance provided by the previous lows. It wasn’t invalidated. At the same time, the GDX is well below its declining red resistance line, and even if it moves close to this line but then declines, it will not be viewed as something bullish.
What happened yesterday (Wednesday) and on Tuesday is exactly what I put in bold.
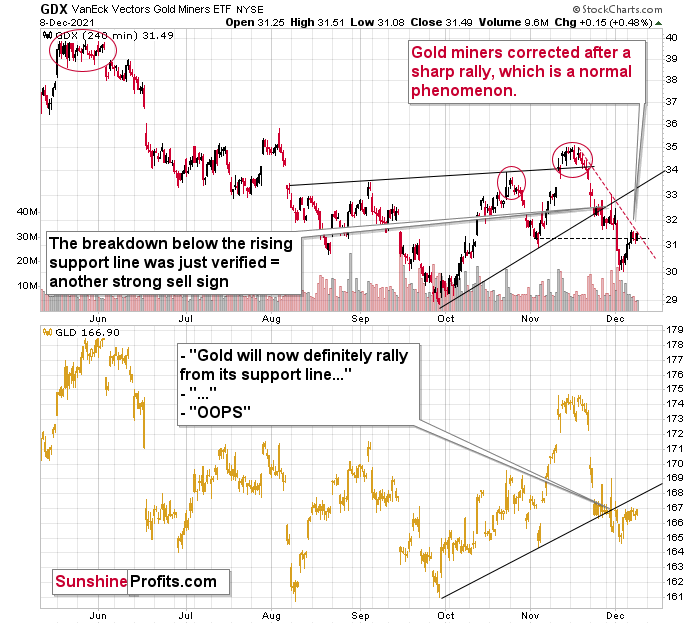
Gold miners moved to their declining red resistance lines and then they moved back down.
As far as the November lows are concerned, while it might not be 100% clear based on the above chart, it is the case that the lowest daily close in November was $31.53, and yesterday, the GDX ETF closed the day at $31.49. As the daily closes are more important than the mid-session candlestick closes, I don’t view the breakdown below the November lows as invalidated.
And what about junior mining stocks?
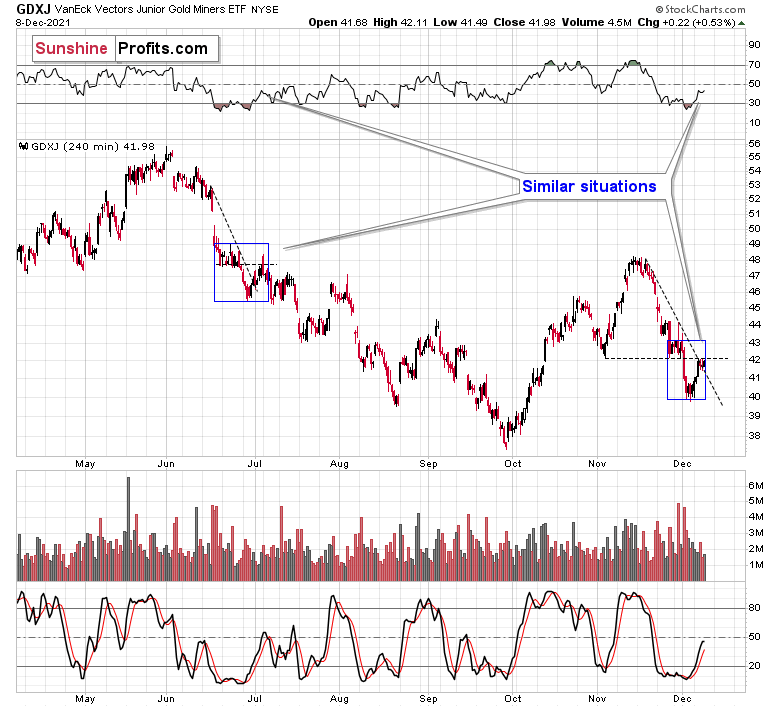
The situation is quite similar. The difference is that while the GDX closed below its November lows in terms of closing prices, the GDXJ bounced off the November lows in intraday terms.
So – no invalidation of the breakdown = the downtrend remains intact, and so does the bearish outlook.
There’s also an interesting similarity visible in the GDXJ ETF. Namely, the early July correction and a top appear to be just like what we saw recently. I marked both cases with blue rectangles and I also marked the similarity in the RSI indicator. The latter was just below 30 and now it moved to almost 50. Back in July, junior miners were verifying the breakdown below the late-April lows, just like now they are verifying the move below the November lows.
Just as the declines continued in July and in the following months, the same is likely to take place also in the near future.
Also, please note that the volume reading during yesterday’s session for both: GDX and GDXJ was rather small – and if this was the beginning of a major rally, it should have been significant.
Please note that the GDXJ moved above its declining resistance line, but this move was relatively small (the breakout is definitely not confirmed at this time), and it’s also similar to what we saw in early July. Consequently, I don’t think this is an important bullish indication.
Finally, while some people may say that the recent decline in mining stocks was only due to the decline in the general stock market, please note that the general stock market – the S&P 500 index – moved back up. The S&P 500 rallied by over 2% on Tuesday and by 0.31% yesterday, and it moved almost to its previous highs. Did GDX or GDXJ move even near their recent (November) highs? No. They are verifying the breakdown below the November lows, instead. Consequently, the outlook for the mining stocks is very bearish.
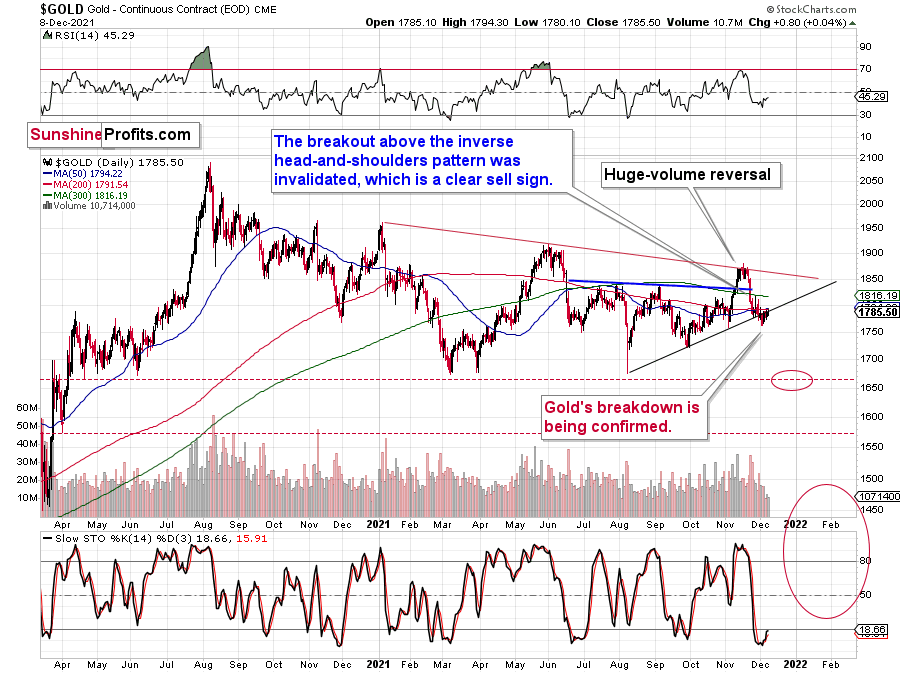
Gold was up by just $0.80 yesterday and the volume was very low. This does not look like the start of a new uptrend, but rather as the final part of the post-breakdown verification.
Plus, as I mentioned at the beginning of today’s analysis, gold “should have” rallied given the decline in the USD Index, and it didn’t. Technically, a rally by 80 cents is still a rally, but effectively, it means that gold was flat.
If the move lower in the USD Index was similarly small, it would be normal. But while gold moved higher by mere 0.04%, the USD Index declined by 0.51% - over 10x as much.
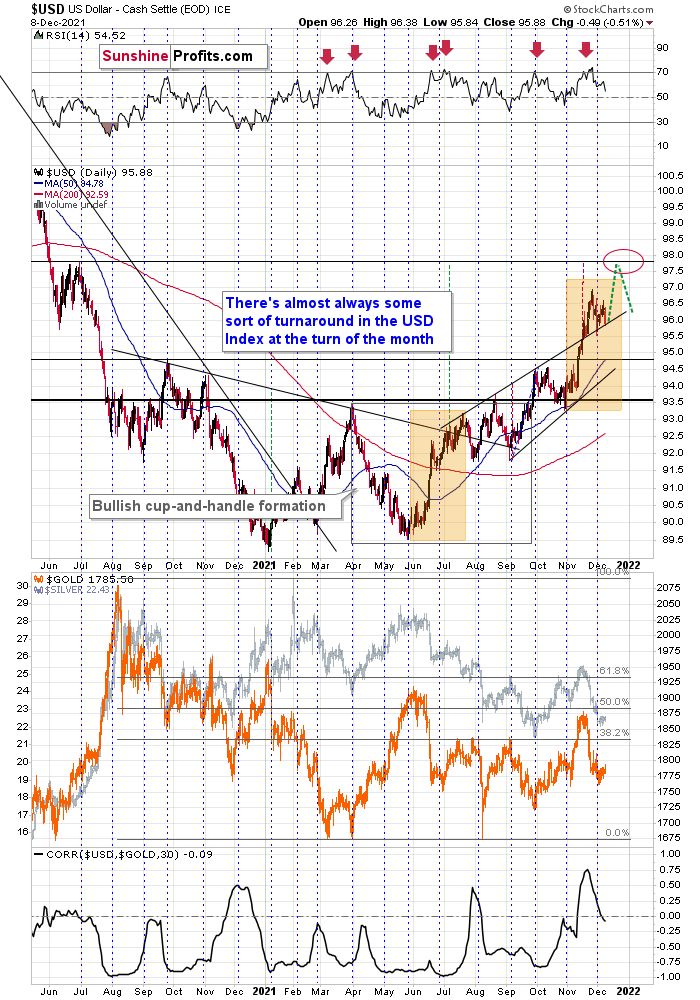
Consequently, it seems that gold (and mining stocks) just can’t wait to start declining once again. And while triggers for price moves are not necessary (when the markets are vulnerable enough, they can move even on more or less random and unimportant developments), the rally in the USD Index might serve as one.
After all, the U.S. currency just moved back to its previous resistance line, and it has once again verified it as support. Consequently, the next move is likely to be to the upside. This, in turn, is likely to have negative implications for the precious metals sector.
Having said that, let’s take a look at the markets from a more fundamental point of view.
Don’t Be Fooled by the Daily Dollar
With the USD Index stuck in consolidation mode, its decline on Dec. 8 may seem material. However, while the greenback cools off after its recent sprint higher, the USD Index's fundamentals are still running hot.
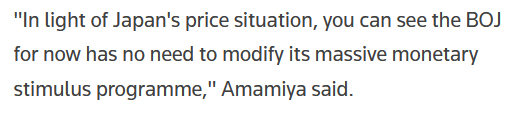
To explain, Japan's Cabinet Office revealed on Dec. 8 that third-quarter GDP declined by 3.6% year-over-year (YoY) and underperformed the preliminary reading of a 3% contraction. On top of that, Bank of Japan (BoJ) Governor Masayoshi Amamiya said on Dec. 8 that looser-for-longer monetary policy will remain intact since inflation is still "well below" the BoJ's 2% annual target.
Please see below:
 Source: Reuters
As secondary evidence of the U.S. dollar’s fundamental prowess, the Bank of Canada (BoC) released its monetary policy statement on Dec. 8. An excerpt read:
“CPI inflation is elevated…. [However], gasoline prices, which had been a major factor pushing up CPI inflation, have recently declined. Meanwhile, core measures of inflation are little changed since September. The Bank continues to expect CPI inflation to remain elevated in the first half of 2022 and ease back towards 2 percent in the second half of the year. The Bank is closely watching inflation expectations and labour costs to ensure that the forces pushing up prices do not become embedded in ongoing inflation.”
And contrasting the recent hawkish rhetoric from Fed Chairman Jerome Powell, BoC Governor Tiff Macklem maintained his dovish disposition:
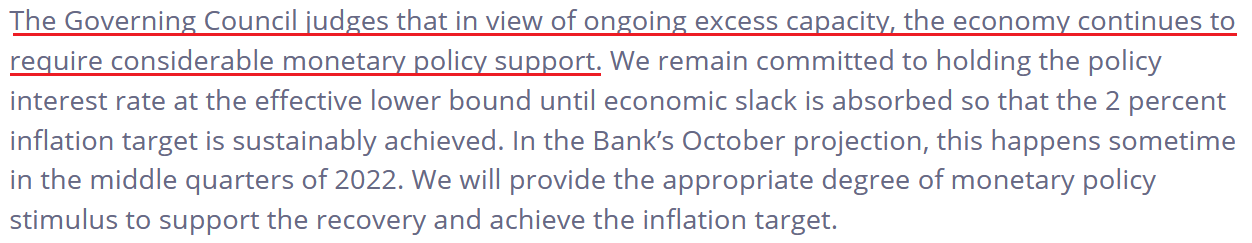 Source: BoC
Third, the EUR/USD is clearly the head of the snake. And while the currency pair rallied sharply alongside the risk-on sentiment, Danske Bank told clients on Dec. 7 that "Peak EUR" has already occurred and that shorting the EUR/USD is its top trade for 2022.
"2022 is likely to bring more of the most recent history. European institutions are conducting a EUR-negative policy in their fight against COVID-19, which will have negative ramifications beyond the COVID-19 crisis itself," wrote Chief Analyst Kristoffer Kjær Lomholt.
Moreover, Lomholt specifically highlighted the Eurozone’s declining Terms of Trade (ToT). For context, ToT compares a regions’ export prices to its import prices. In a nutshell: when a region sells its exports for more than it pays for its imports, its ToT increases. Conversely, when a region sells its exports for less than it pays for its imports, its ToT decreases.
And since “the surge in (commodity) prices has negatively affected Europe (import prices) and positively helped US (export prices),” he expects “more to come as liquidity tightens, global growth expectations increasingly peak, and the market sees more asymmetry between EUR and USD across factors such as economic dynamism.”
Please see below:
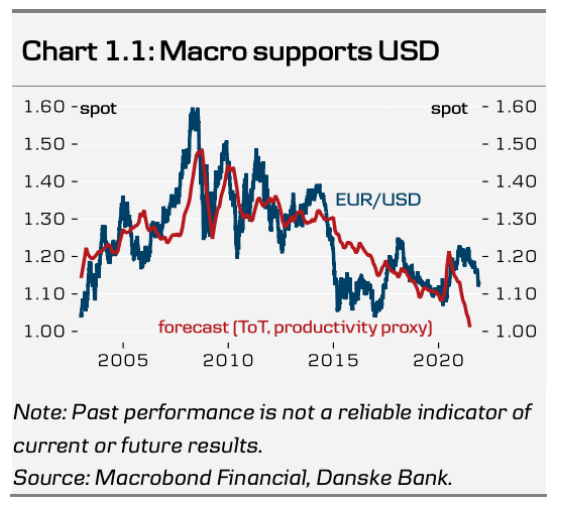
To explain, the blue line above tracks the EUR/USD, while the red line above tracks the relative Eurozone-U.S. ToT. If you analyze the relationship, you can see that U.S. outperformance often coincides with a weaker EUR/USD. And with the red line falling off a cliff recently, the currency pair remains far from its fair value. As a result, Danske Bank expects the EUR/USD to hit 1.0800 in 2022.
Fourth, after the Bank of England (BoE) was perceived as the hawkish bank on the block in October, officials voted 7-2 to keep interest rates unchanged on Nov. 4. For context, I wrote on Nov. 5:
After criticism erupted following the overpromise and under-deliver event, BoE Governor Andrew Bailey said that “I don’t think it’s our job to steer markets day by day and week by week.”
And how did investors react?
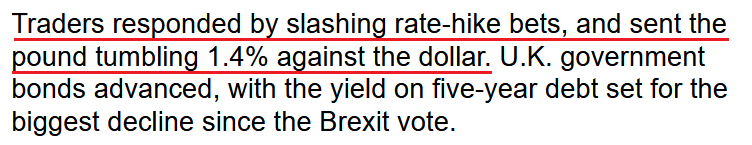 Source: Bloomberg
To that point, Goldman Sachs did a complete 180 on Dec. 8, telling clients that its prior forecast of a 15 basis point hike in December has been delayed until February.
"Previously, we had thought a 15bp hike in December was more likely than not, but this was a close call,” Goldman Sachs rates strategists wrote. “We now think risk management considerations will dominate in next week’s MPC deliberations. We now look for a 15bp rise in the February MPC meeting."
And why is all of this so important?
Well, with the USD/JPY, the USD/CAD, the EUR/USD, and the GBP/USD combined to account for more than 92% of the USD Index’s movement, the dollar is still the cleanest shirt within the FX basket of dirty laundry.
For context, U.S. fundamentals are far from perfect. However, relative performance is what matters. And with the BoJ in ultra-ease mode, the BoC standing pat, the ECB dismissing a 2022 rate hike, and the BoE now confronted with rising coronavirus cases, the USD Index’s price action on Dec. 8 was likely an outlier.
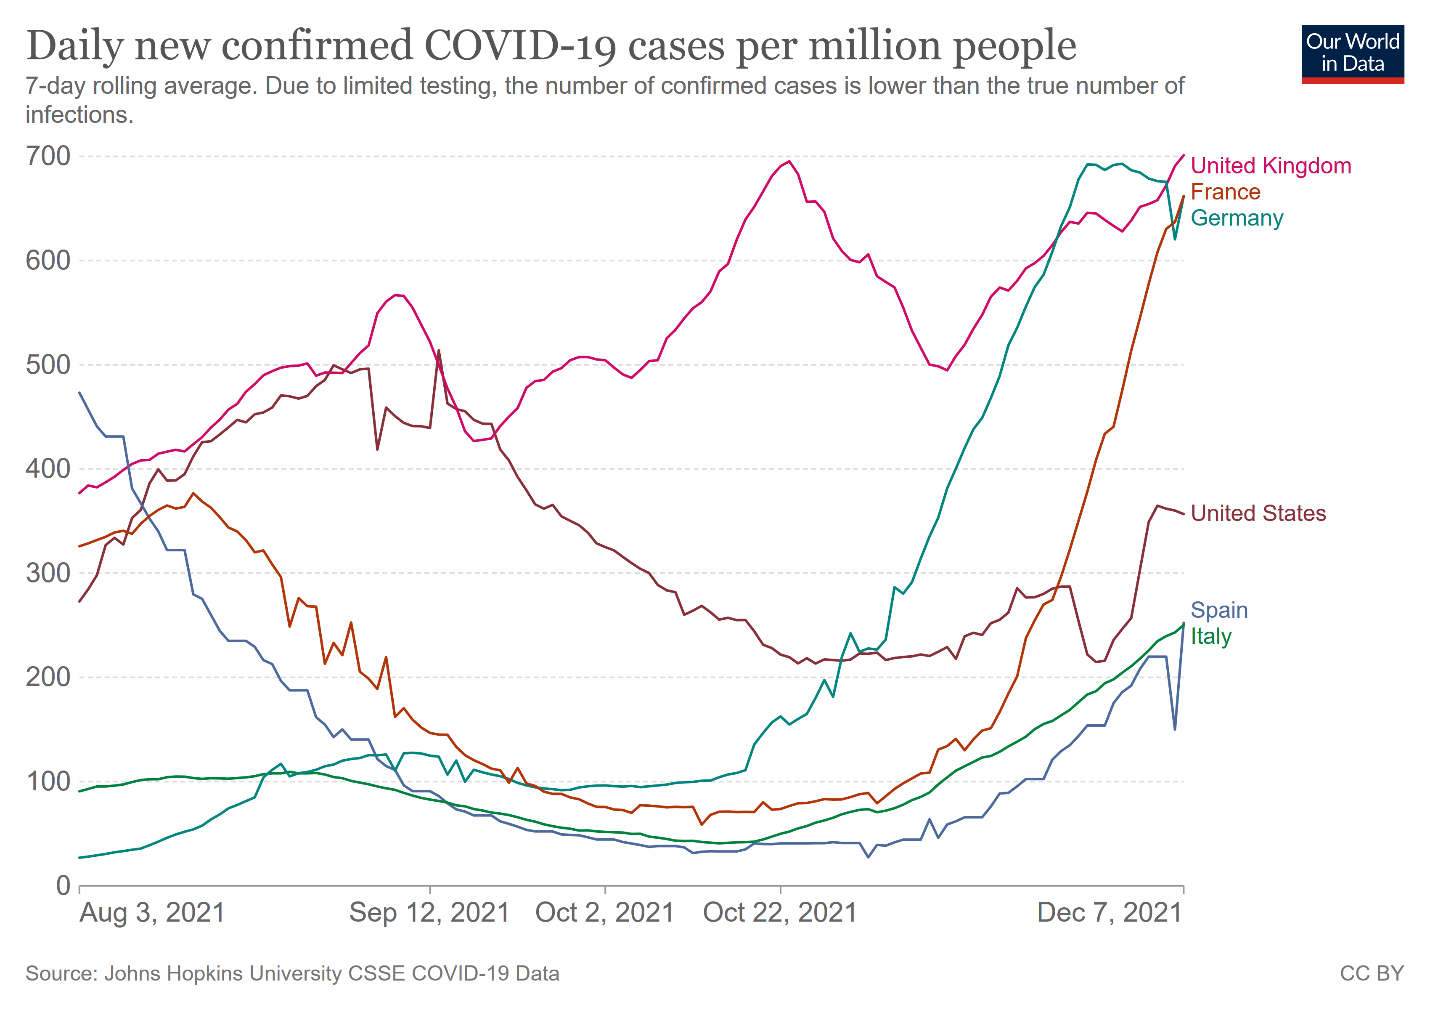
For your reference, coronavirus cases have risen materially in the Eurozone, while U.S. cases have remained roughly flat.
Please see below:
What’s more, U.K. Prime Minister Boris Johnson announced new restrictions on Dec. 8. Thus, disrupting economic activity only weakens the fundamental value of the British pound:
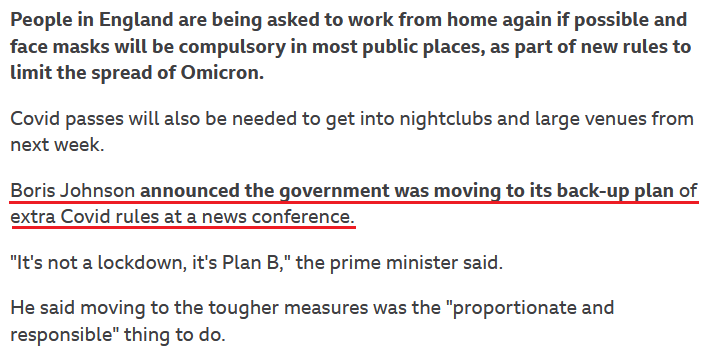 Source: the BBC
Finally, while the news has largely faded from the front page, the number of Chinese property developers suffering debt woes continues to increase. And whether it’s Evergrande, Kaisa Group or the China Aoyuan Group, hundreds of billions of dollars of debt remains in limbo.
As a result, while a Chinese property crisis would likely usher the USD Index well above 100, a simple slowdown of the Chinese economy is also bullish for the greenback.
Please see below:
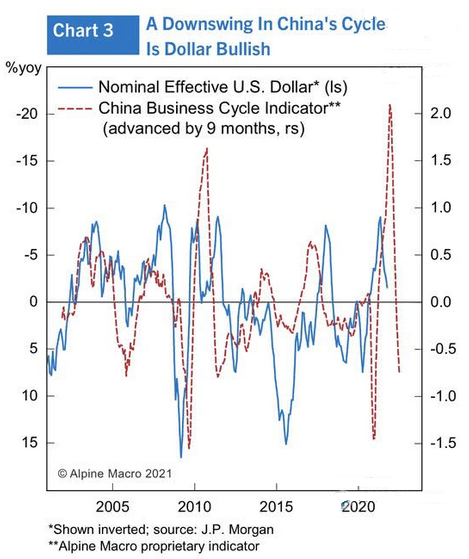
To explain, the red line above tracks Alpine Macro’s China Business Cycle Indicator (advanced by nine months), while the blue line above tracks the inverted (scale flipped upside down) USD Index. If you analyze the relationship, you can see that a weak Chinese economy often supports the USD Index’s uprisings. And with a sharp slowdown already present and expected to continue, more weakness could propel the USD Index to triple digits in 2022.
The bottom line? While daily sentiment garners all of the attention, technicals and fundamentals will likely rule the day over the medium term. And with King Dollar still holding the currency throne, the USD Index will likely rule the weeks and months ahead as well. Moreover, with the PMs often moving inversely to the greenback, they’re unlikely to celebrate if/once the dollar party gains more power.
In conclusion, the PMs were mixed on Dec. 8, and mining stocks outperformed once again. However, as mentioned on Dec. 8, the S&P 500’s ascent often uplifts the junior miners. Despite that, though, with corporate buybacks done for the year on Dec. 10, the algorithms may enable the sell programs soon after. As a result, the S&P 500’s days of uplifting mining stocks could be nearing their end. Likewise, with a shift in sentiment likely to support the U.S. dollar, the greenback’s already robust fundamentals should grow even stronger.
Overview of the Upcoming Part of the Decline
- It seems to me that the current corrective upswing in gold is about to be over soon, and the next short-term move lower is about to begin. Since it appears to be another short-term move more than a continuation of a bigger decline, I think that junior miners will be likely to (at least initially) decline more than silver.
- It seems that the first stop for gold will be close to its previous 2021 lows, slightly below $1,700. Then it will likely correct a bit, but it’s unclear if I want to exit or reverse the current short position based on that – it depends on the number and the nature of the bullish indications that we get at that time.
- After the above-mentioned correction, we’re likely to see a powerful slide, perhaps close to the 2020 low ($1,450 - $1,500).
- If we see a situation where miners slide in a meaningful and volatile way while silver doesn’t (it just declines moderately), I plan to – once again – switch from short positions in miners to short positions in silver. At this time, it’s too early to say at what price levels this could take place, and if we get this kind of opportunity at all – perhaps with gold close to $1,600.
- I plan to exit all remaining short positions once gold shows substantial strength relative to the USD Index while the latter is still rallying. This may be the case with gold close to $1,350 - $1,400. I expect silver to fall the hardest in the final part of the move. This moment (when gold performs very strongly against the rallying USD and miners are strong relative to gold after its substantial decline) is likely to be the best entry point for long-term investments, in my view. This can also happen with gold close to $1,375, but at the moment it’s too early to say with certainty. I expect the final bottom to take place near the end of the year, perhaps in mid-December. It is not set in stone that PMs have to bottom at that time. If not then, then early 2022 would become a likely time target.
- As a confirmation for the above, I will use the (upcoming or perhaps we have already seen it?) top in the general stock market as the starting point for the three-month countdown. The reason is that after the 1929 top, gold miners declined for about three months after the general stock market started to slide. We also saw some confirmations of this theory based on the analogy to 2008. All in all, the precious metals sector is likely to bottom about three months after the general stock market tops. The additional confirmation will come from the tapering schedule, as markets are likely to move on the rumor and reverse on the fact as they tend to do in general.
- The above is based on the information available today, and it might change in the following days/weeks.
You will find my general overview of the outlook for gold on the chart below:
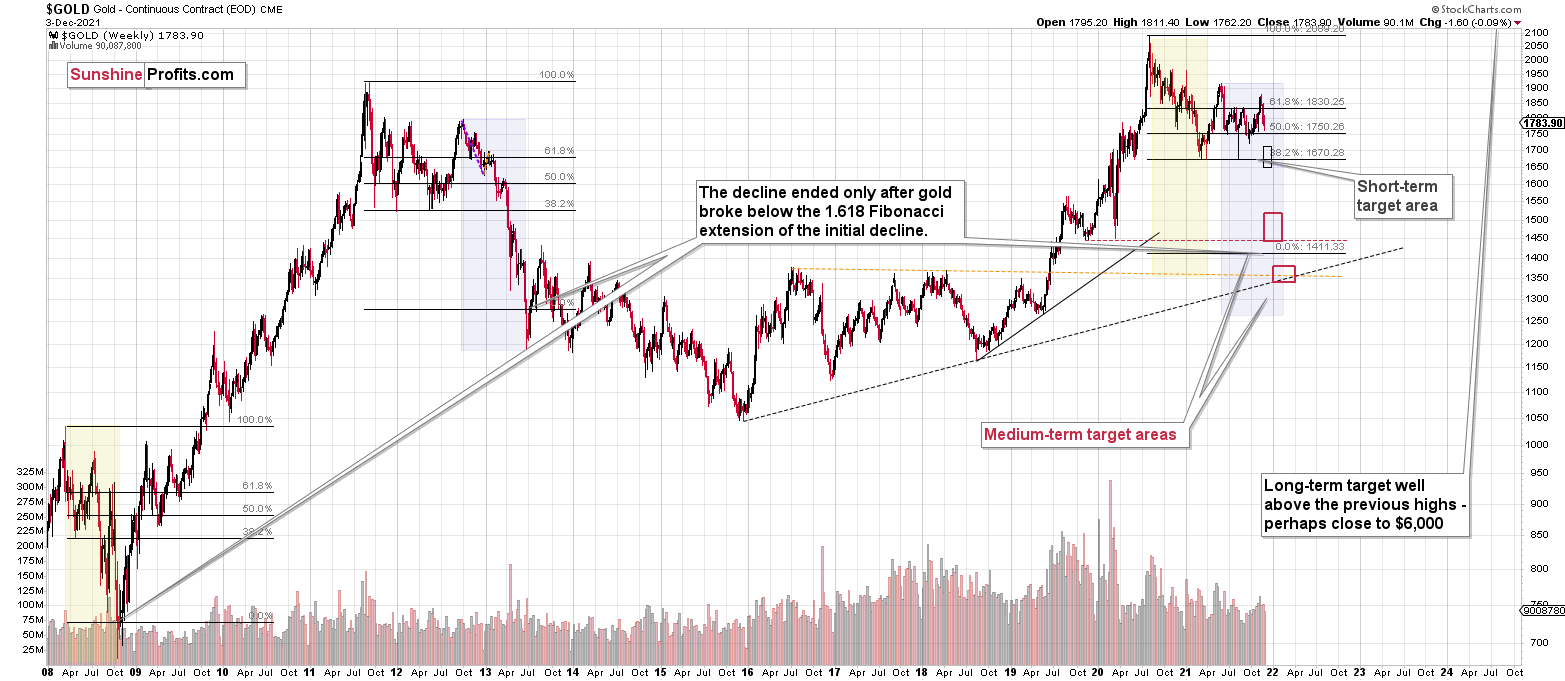
Please note that the above timing details are relatively broad and “for general overview only” – so that you know more or less what I think and how volatile I think the moves are likely to be – on an approximate basis. These time targets are not binding or clear enough for me to think that they should be used for purchasing options, warrants or similar instruments.
Summary
Summing up, gold declined in tune with my long-term-based indications, and the medium-term downtrend appears to have resumed. Based on the analogy to 2013 and other factors, a bigger decline in gold appears to be just around the corner (regardless of what happens in the very near term).
If the new Covid-19 variant makes the vaccine rather useless, we might be in for very wild price moves in most markets. In the case of the precious metals sector, the initial move should be to the downside, but at the same time, it makes the long-term outlook even more bullish.
It seems that we might see a short-term bottom close to the middle of December, and perhaps that’s when gold will move to its previous 2021 lows. However, I don’t think that it would be the final bottom. Conversely, it seems that the final bottom would form lower after a short-term correction (from the above-mentioned December lows).
From the medium-term point of view, the key two long-term factors remain the analogy to 2013 in gold and the broad head and shoulders pattern in the HUI Index. They both suggest much lower prices ahead.
It seems that our profits from the short positions are going to become truly epic in the following months.
After the sell-off (that takes gold to about $1,350 - $1,500), I expect the precious metals to rally significantly. The final part of the decline might take as little as 1-5 weeks, so it's important to stay alert to any changes.
Most importantly, please stay healthy and safe. We made a lot of money last March and this March, and it seems that we’re about to make much more on the upcoming decline, but you have to be healthy to enjoy the results.
As always, we'll keep you - our subscribers - informed.
By the way, we’re currently providing you with the possibility to extend your subscription by a year, two years or even three years with a special 20% discount. This discount can be applied right away, without the need to wait for your next renewal – if you choose to secure your premium access and complete the payment upfront. The boring time in the PMs is definitely over, and the time to pay close attention to the market is here. Naturally, it’s your capital, and the choice is up to you, but it seems that it might be a good idea to secure more premium access now while saving 20% at the same time. Our support team will be happy to assist you in the above-described upgrade at preferential terms – if you’d like to proceed, please contact us.
To summarize:
Trading capital (supplementary part of the portfolio; our opinion): Full speculative short positions (300% of the full position) in junior mining stocks are justified from the risk to reward point of view with the following binding exit profit-take price levels:
Mining stocks (price levels for the GDXJ ETF): binding profit-take exit price: $35.73; stop-loss: none (the volatility is too big to justify a stop-loss order in case of this particular trade)
Alternatively, if one seeks leverage, we’re providing the binding profit-take levels for the JDST (2x leveraged) and GDXD (3x leveraged – which is not suggested for most traders/investors due to the significant leverage). The binding profit-take level for the JDST: $16.18; stop-loss for the JDST: none (the volatility is too big to justify a SL order in case of this particular trade); binding profit-take level for the GDXD: $32.08; stop-loss for the GDXD: none (the volatility is too big to justify a SL order in case of this particular trade).
For-your-information targets (our opinion; we continue to think that mining stocks are the preferred way of taking advantage of the upcoming price move, but if for whatever reason one wants / has to use silver or gold for this trade, we are providing the details anyway.):
Silver futures downside profit-take exit price: $19.12
SLV profit-take exit price: $17.72
ZSL profit-take exit price: $41.38
Gold futures downside profit-take exit price: $1,683
HGD.TO – alternative (Canadian) inverse 2x leveraged gold stocks ETF – the upside profit-take exit price: $12.48
HZD.TO – alternative (Canadian) inverse 2x leveraged silver ETF – the upside profit-take exit price: $30.48
Long-term capital (core part of the portfolio; our opinion): No positions (in other words: cash
Insurance capital (core part of the portfolio; our opinion): Full position
Whether you already subscribed or not, we encourage you to find out how to make the most of our alerts and read our replies to the most common alert-and-gold-trading-related-questions.
Please note that we describe the situation for the day that the alert is posted in the trading section. In other words, if we are writing about a speculative position, it means that it is up-to-date on the day it was posted. We are also featuring the initial target prices to decide whether keeping a position on a given day is in tune with your approach (some moves are too small for medium-term traders, and some might appear too big for day-traders).
Additionally, you might want to read why our stop-loss orders are usually relatively far from the current price.
Please note that a full position doesn't mean using all of the capital for a given trade. You will find details on our thoughts on gold portfolio structuring in the Key Insights section on our website.
As a reminder - "initial target price" means exactly that - an "initial" one. It's not a price level at which we suggest closing positions. If this becomes the case (like it did in the previous trade), we will refer to these levels as levels of exit orders (exactly as we've done previously). Stop-loss levels, however, are naturally not "initial", but something that, in our opinion, might be entered as an order.
Since it is impossible to synchronize target prices and stop-loss levels for all the ETFs and ETNs with the main markets that we provide these levels for (gold, silver and mining stocks - the GDX ETF), the stop-loss levels and target prices for other ETNs and ETF (among other: UGL, GLL, AGQ, ZSL, NUGT, DUST, JNUG, JDST) are provided as supplementary, and not as "final". This means that if a stop-loss or a target level is reached for any of the "additional instruments" (GLL for instance), but not for the "main instrument" (gold in this case), we will view positions in both gold and GLL as still open and the stop-loss for GLL would have to be moved lower. On the other hand, if gold moves to a stop-loss level but GLL doesn't, then we will view both positions (in gold and GLL) as closed. In other words, since it's not possible to be 100% certain that each related instrument moves to a given level when the underlying instrument does, we can't provide levels that would be binding. The levels that we do provide are our best estimate of the levels that will correspond to the levels in the underlying assets, but it will be the underlying assets that one will need to focus on regarding the signs pointing to closing a given position or keeping it open. We might adjust the levels in the "additional instruments" without adjusting the levels in the "main instruments", which will simply mean that we have improved our estimation of these levels, not that we changed our outlook on the markets. We are already working on a tool that would update these levels daily for the most popular ETFs, ETNs and individual mining stocks.
Our preferred ways to invest in and to trade gold along with the reasoning can be found in the how to buy gold section. Furthermore, our preferred ETFs and ETNs can be found in our Gold & Silver ETF Ranking.
As a reminder, Gold & Silver Trading Alerts are posted before or on each trading day (we usually post them before the opening bell, but we don't promise doing that each day). If there's anything urgent, we will send you an additional small alert before posting the main one.
Thank you.
Przemyslaw Radomski, CFA
Founder, Editor-in-chief

