
tools spotlight

-
Hyperinflation vs. Aggressive Fed – What Will Gold Do?
November 18, 2021, 9:35 AMJust yesterday, we considered the probability that gold would move to $1,900 this week to be less than 40%. Now, however, as silver has not recorded any better results and the strength of PM is relative to the USD index - these chances are close to 50/50. Even so, keep in mind that even if gold is rising, it does not mean that mining will largely follow it. On the contrary.
It seems quite likely that the miners' last peak is behind us, but it may be a while before the decline really begins. Is this the beginning of the end of a relatively wide topping pattern? If so, a very similar situation to the one we saw with the GDX ETF could repeat itself. You can read more about the technical situation in the premium version of today’s analysis, and in the free part of today’s analysis I’m going to discuss a few fundamental issues that also should be addressed at this time.
While I’ve been warning for months that inflation would come in much hotter than the Fed or market participants had expected, now, inflation is front-page news. However, amid the U.S. dollar’s recent surge, the commodities complex is sending an ominous warning to gold, silver, and mining stocks.
For example, copper prices are down by nearly 6% this week (as of the Nov. 17 close), while crude is down by more than 4% and natural gas is down by more than 11% over the last week and a half. And while I warned previously that the narrative of ‘hyperinflation’ is much more semblance than substance – due to the fact that perpetually higher prices eventually lead to demand destruction – the U.S. government’s war on inflation is intensifying.
To explain, I wrote on Nov. 11:
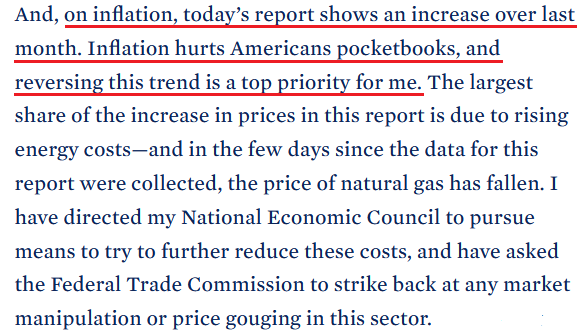
Surging inflation is now rattling The White House. Releasing a “Statement by President Biden on Today’s Economic News” on Nov. 10, an excerpt read:
 Source: The White House
Moreover, Biden added:
“I am travelling to Baltimore today to highlight how my Infrastructure Bill will bring down these costs, reduce these bottlenecks, and make goods more available and less costly. And I want to reemphasize my commitment to the independence of the Federal Reserve to monitor inflation, and take steps necessary to combat it.”
And firing another missile on Nov. 17, Biden wrote a letter to the U.S. Federal Trade Commission (FTC) that outlined accusations of “illegal conduct” and anti-consumer behavior by oil & gas companies. An excerpt read:
“The Federal Trade Commission has authority to consider whether illegal conduct is costing families at the pump. I believe you should do so immediately.
“I do not accept hard-working Americans paying more for gas because of anti-competitive or otherwise potentially illegal conduct. I, therefore, ask that the Commission further examine what is happening with oil and gas markets, and that you bring all of the Commission's tools to bear if you uncover any wrongdoing.”
For context, the U.S. Energy Department said that crude accounts for half of the cost of retail gasoline – with taxes, refining, transportation, and distribution making up the rest of the spread.
More importantly, though, with investors, the Fed, and The White House now realizing that inflation won’t abate on its own, the latter has gone on the offensive. And with its monetary counterpart poised to follow suit in the coming months, the PMs are caught in the crossfire.
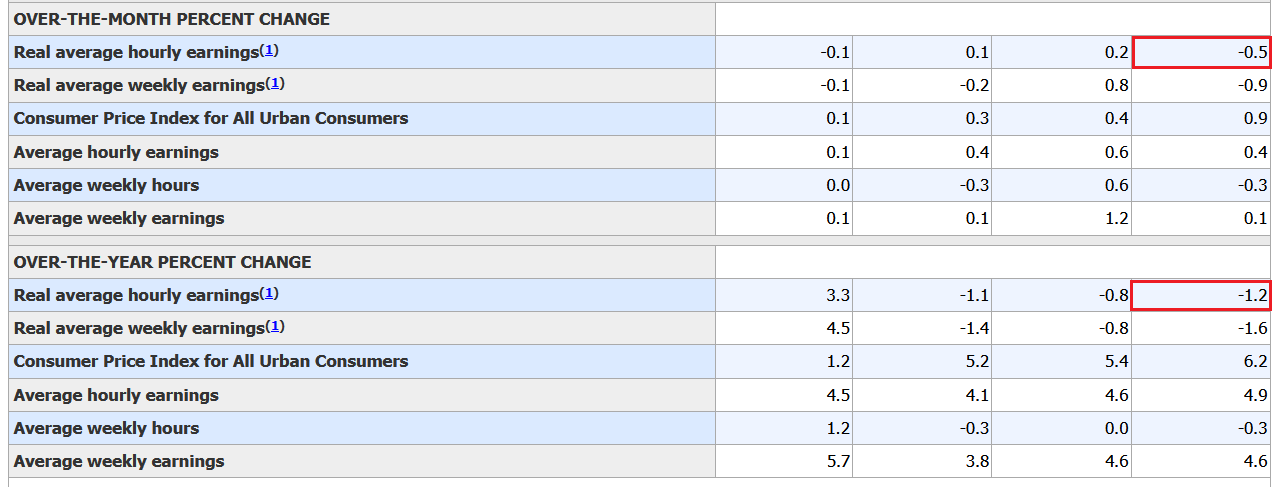
To explain, surging inflation is a tax on consumers. And with perpetual price increases reducing consumers’ purchasing power, unabated inflation threatens to derail the U.S. economic recovery. As evidence, real average hourly earnings – which subtracts the inflation rate from the percentage change in U.S. average hourly earnings – decreased by 0.5% month-over-month (MoM) and 1.2% year-over-year (YoY) in October (the red boxes below).
Please see below:
 Source: U.S. Bureau of Labor Statistics (BLS)
In a nutshell: the data means that inflation is rising at a faster pace than average U.S. wages and consumers’ purchasing power has declined. For example, if average wages increase from $100 to $105, consumers are worse off if the average cost of goods increases from $100 to $106. Moreover, the longer this dynamic persists, the more it hurts the U.S. economic recovery.
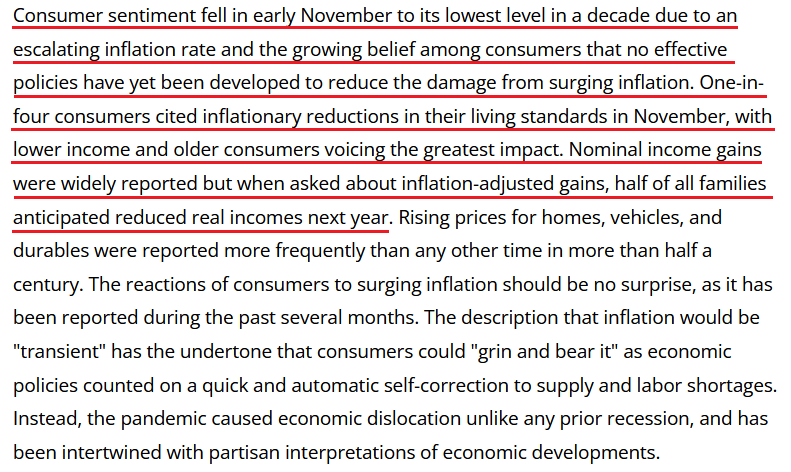
Likewise, the University of Michigan released its Consumer Sentiment Index on Nov. 12. And with the index hitting a 10-year low, it’s no coincidence that The White House (and soon likely the Fed) has made inflation Public Enemy No. 1.
Please see below:
 Source: the University of Michigan
Thus, the hyper-inflationists are missing the forest through the trees. In their argument, they assume that high U.S. debt levels make raising interest rates impossible. As a result, the U.S. government will allow inflation to run rampant and the U.S. dollar will crash in the process. However, while it’s an interesting story, it’s unrealistic. And why is that?
Well, for one, not raising interest rates will likely do more harm to the U.S. economy than tightening monetary policy. And the reasons are outlined above: if prices keep rising and consumer confidence keeps falling, eventually demand destruction unfolds. As a result, if policymakers don’t solve their inflationary conundrum, failure to do so will likely push the U.S. economy into recession.
Second, the political component shouldn’t be ignored. Biden’s approval ratings keep hitting new lows along with consumer confidence. Thus, is it in his best interest to maintain the status quo? Of course not. That’s why he’s been so forceful on inflation over the last few weeks. Essentially, if he (and/or the Fed) does nothing, he’ll likely lose the next presidential election and the Democrats will likely lose control of Congress. However, if he tames inflation, then he’s a hero. And left with those two options, which one do you think he’ll choose?
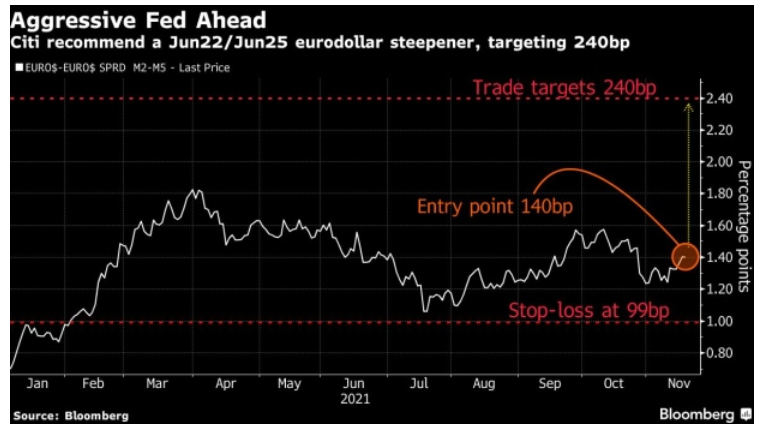
Third, the Fed has already tapered and FOMC officials’ hawkish rhetoric should accelerate in the coming months. To explain, Citigroup and Morgan Stanley expect a faster-tightening cycle once interest rate hikes begin (expected) in 2022. And on Nov. 17, Citigroup recommended a June 2022-June 2025 eurodollar steeper trade – a position that profits if additional rate hikes are priced into the U.S. yield curve.
“We think that as liftoff gets underway, the slope is likely to increase as some of the uncertainties around the global economy, such as supply-chain bottlenecks, start dissipating,” wrote Citigroup strategist Jabaz Mathai.
Currently, swap markets have priced in an 18 basis point rate hike – which is 72% of a typical 25 basis point rate hike – at the Fed’s June 2022 policy meeting. Thereafter, roughly 150 basis points – or six additional rate hikes – are expected by the end of 2025.
However, Citigroup’s trade predicts that the 140 basis points will turn into as much as 240 basis points by the end of 2025 (which implies roughly four more rate hikes than what’s currently priced in). Thus, with inflation now in Biden’s crosshairs, it won’t be surprising if the Fed pivots in the same direction.
Please see below:
Finally, with the Fed and the ECB warning about overvalued assets in their respective financial stability reviews, allowing inflation to sizzle will only increase investors’ bids for any and all inflation hedges. In turn, this will only enhance the stock market’s disconnect from fundamentals, and higher commodity prices will reinvigorate the cost-push inflationary spiral.
As a result, Goldman Sachs CEO David Solomon said on Nov. 17 that the liquidity-fueled circus is likely nearing its end.
“When I step back and think about my 40-year career, there have been periods of time when greed has far outpaced fear. We are in one of those periods. My experience says those periods aren't long-lived. Something will rebalance it and bring a little bit more perspective. And given it feels like inflation is running above trend, chances are interest rates will move up and that will take some of the exuberance out of certain markets.”
The bottom line? While the PMs remain upbeat for now, their fundamental outlooks continue to deteriorate. And while some investors assume that hyperinflation will crash the U.S. economy, policymakers understand this. As a result, avoiding that catastrophe is now on their radar. And while copper and crude have already noticed it, it’s likely only a matter of time before the PMs realize this as well.
In conclusion, the PMs rallied on Nov. 17 and their upbeat attitudes continued to shine through. However, with the fundamental narrative that’s underpinning their strength likely to collapse, their prices should suffer a similar fate. As a result, the medium-term outlook still remains bearish and lower lows should materialize over the next few months.
Thank you for reading our free analysis today. Please note that the above is just a small fraction of the full analyses that our subscribers enjoy on a regular basis. They include multiple premium details such as the interim targets for gold and mining stocks that could be reached in the next few weeks. We invite you to subscribe now and read today’s issue right away.
Sincerely,
Przemyslaw Radomski, CFA
Founder, Editor-in-chief -
Gold – USD Relationship Status: It’s Complicated
November 17, 2021, 6:49 AMIf the dollar goes through a corrective downswing, it’s more bullish for gold? Not if a decline in the euro caused gold to rise in the first place.
Another day, another new yearly high for the USD Index. The U.S. currency soars just like it has since the beginning of the year, in tune with what I said at that time, (and against what almost everyone else said about its outlook). The rally accelerated recently, with the USD Index soaring by 0.78 this week – and it’s only Wednesday today.
So, surely that’s bullish for the USD Index? - one might ask.
No.
“Bullish” or “bearish” relates to the future, not to the past. In fact, the rally in the USD Index might need a breather as all markets – no matter how bullish or bearish the situation is in them – can’t rally or decline in a straight line, without periodic corrections. The USD Index, gold, silver, mining stocks, and practically all the other markets are no exception from this rule. Even the real estate prices don’t increase over the long run without periodic downturns.
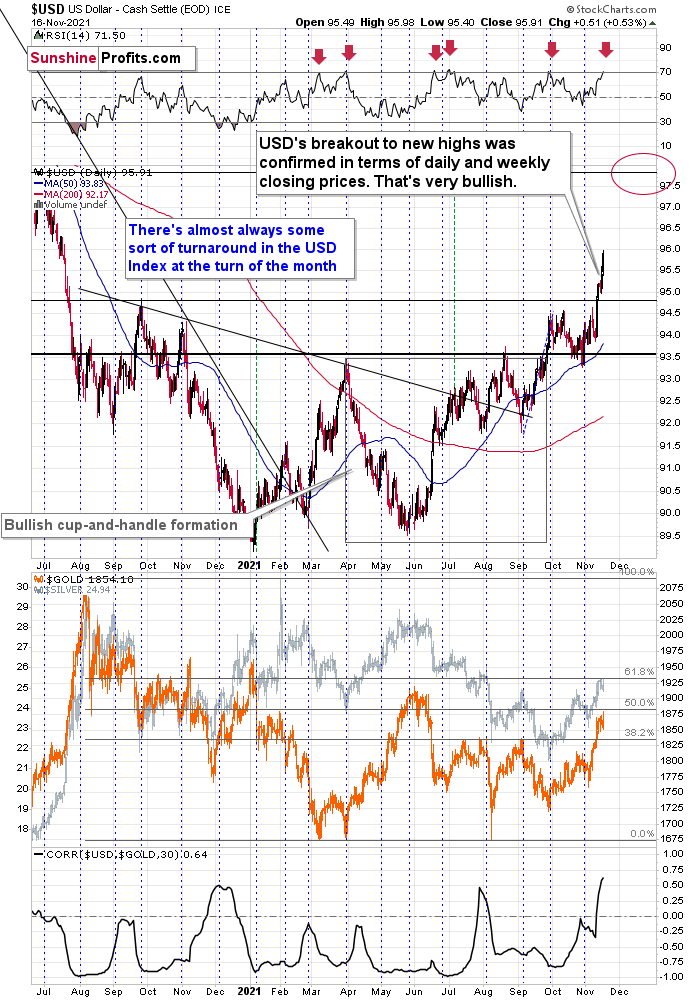
As you can see on the above chart, the U.S currency index soared to almost 96 yesterday and it’s after an almost straight-up rally. This rally caused the RSI indicator to move above 70, and this has been a quite precise short-term sell signal this year. In fact, in all cases when we saw it, some kind of short-term correction followed.
Based on the size of the current rally, it seems that the current situation is most similar to what we saw in early March and in late June. That’s when we saw short-term declines that took the USDX approximately a full index point lower. In the current case, it could mean a decline back to 95. This would be a perfectly natural thing for the USD Index to do right now, given that the previous resistance (which now serves as support) is located slightly below 95. The support is provided by the late-2020 high and the March 2020 low (not visible on the above chart).
So, surely this corrective downswing in the USD Index would cause an even bigger rally in the precious metals sector, right?
That’s where things get complicated.
You see, the biggest (over 50%) part of the USD Index (which is a weighted average) is the EUR/USD currency pair. Let’s take a look at it.
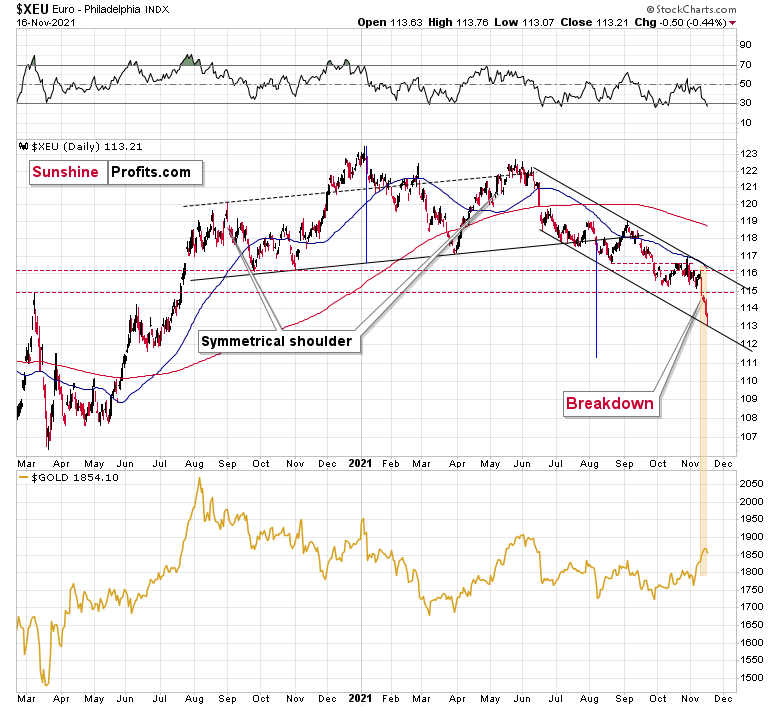
The Euro Index moved sharply lower last week and just like the RSI based on the USD Index flashed a sell signal, the RSI based on the Euro Index flashed a buy signal.
Also, the Euro Index just moved to the lower border of its declining trade channel, which is likely to indicate some kind of rebound.
Why am I discussing the euro here? Because that’s what’s complicated about the current USD-gold link.
The euro recently declined and the prices of silver and gold recently rallied shortly after dovish comments from the eurozone. Namely, while the expansionary nature of fiscal and monetary decisions in the U.S. might be after its peak (with the infrastructure bill signed even despite high inflation numbers), the eurozone is far from limiting its expansionary (i.e., inflationary) policies, and it was just made clear recently.
That was bearish for the euro and bullish for the gold price – as more money (euros in this case) would be chasing the same amount of physical gold bars.
The point here is that it might have been the decline in the value of the European currency that caused gold to rally, and it had little to do with what happened in the USD Index.
Don’t get me wrong, most of the time, the gold-USD link is stable and negative. In some cases, gold shows strength or weakness by refusing to move in tune (and precisely: again) with the U.S. dollar’s movement. But in this case, it seems that it’s not about the U.S. dollar at all (or mostly), but rather about what happened in the Eurozone and euro recently.
I marked the recent decline in the euro and the rally in gold with a golden rectangle.
The usual link between gold-USD would have one assume that lower USD Index values (due to higher EUR/USD values) would trigger a rally in gold. However, given how things worked and the fact that we saw/heard the news coming from the Eurozone, it seems like this “temporary” and “bearish for the PMs” interpretation would actually prevail. It could also be the case that we see some kind of mixed reply from the precious metals sector when the USD Index and the Euro Index correct. The PMs could for example fall only after the situation regarding the gold-USD link gets back to normal – that is perhaps after both currencies correct.
Thank you for reading our free analysis today. Please note that the above is just a small fraction of the full analyses that our subscribers enjoy on a regular basis. They include multiple premium details such as the interim targets for gold and mining stocks that could be reached in the next few weeks. We invite you to subscribe now and read today’s issue right away.
Sincerely,
Przemyslaw Radomski, CFA
Founder, Editor-in-chief -
Gold: Massive Bearish Clouds Looming on the Horizon?
November 16, 2021, 7:33 AMContrary to yesterday’s long analysis, today’s issue is going to be rather short, as nothing really happened on the precious metals market yesterday. The thing that did happen was the USD Index moving higher.
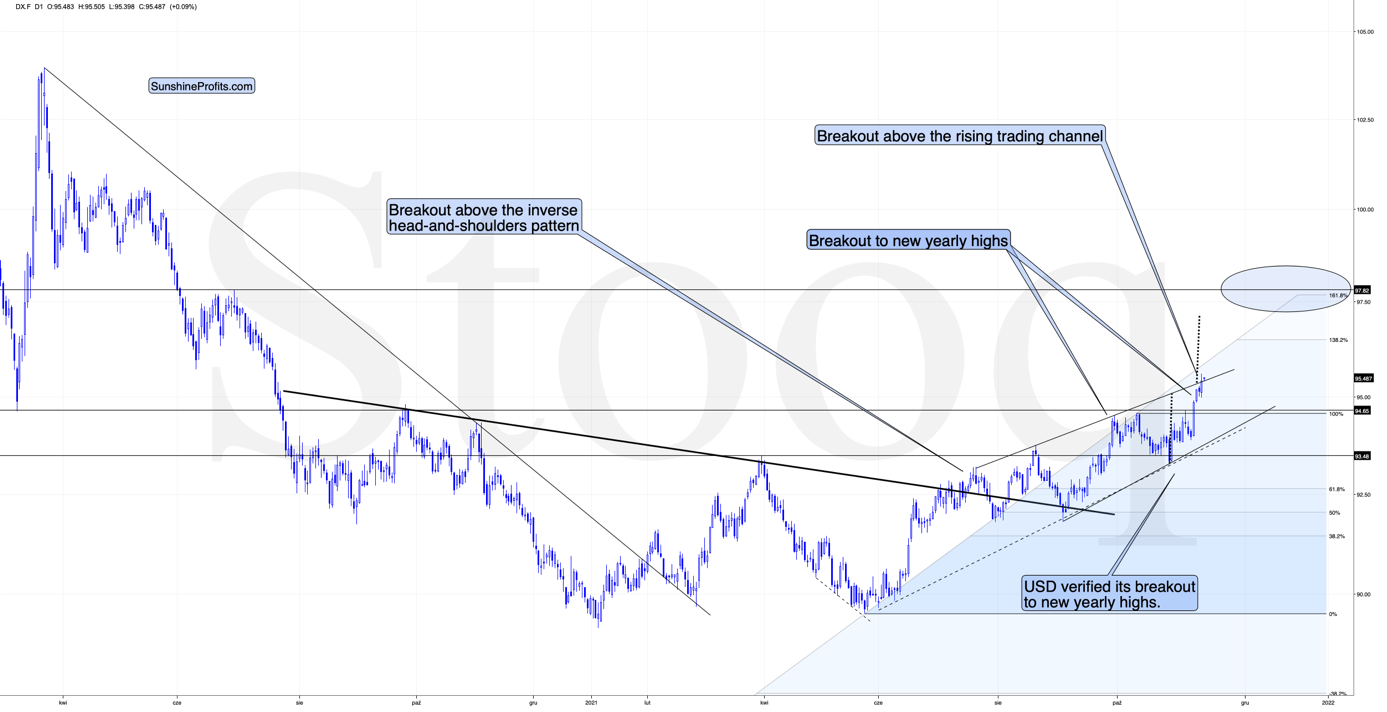
The U.S. currency index once again broke to new yearly highs, and – more importantly – it also broke above its rising trend channel. This breakout is not yet confirmed, but it is already notable. The implication of this breakout is that we’re likely to see a post-breakout rally at least equal in size to the height of the trading channel that the USDX just broke above. I marked the above with dotted lines in the above chart.
This means that a rally to about 97 has now become even more likely. That’s bearish for the precious metals market due to its historically low correlation with the USDX.
Still, we also have a bullish lining for the PMs here. The thing is that yesterday was once again a day when PMs and miners refused to decline despite USD’s rally. This is a bullish sign for the PMs as it shows their strength. Will this sign continue to hold? Will PMs rally? Does it invalidate the bearish outlook altogether, or is it just a small bullish blip on the radar that also indicates massive bearish clouds on the horizon?
Based on numerous other indications, I continue to think that the latter interpretation is more likely to be the correct one.
If the USDX rallies to 97 or so, then gold will have quite a few chances to catch up with its bearish reaction to the former’s strength.
Components of the Bearish Picture
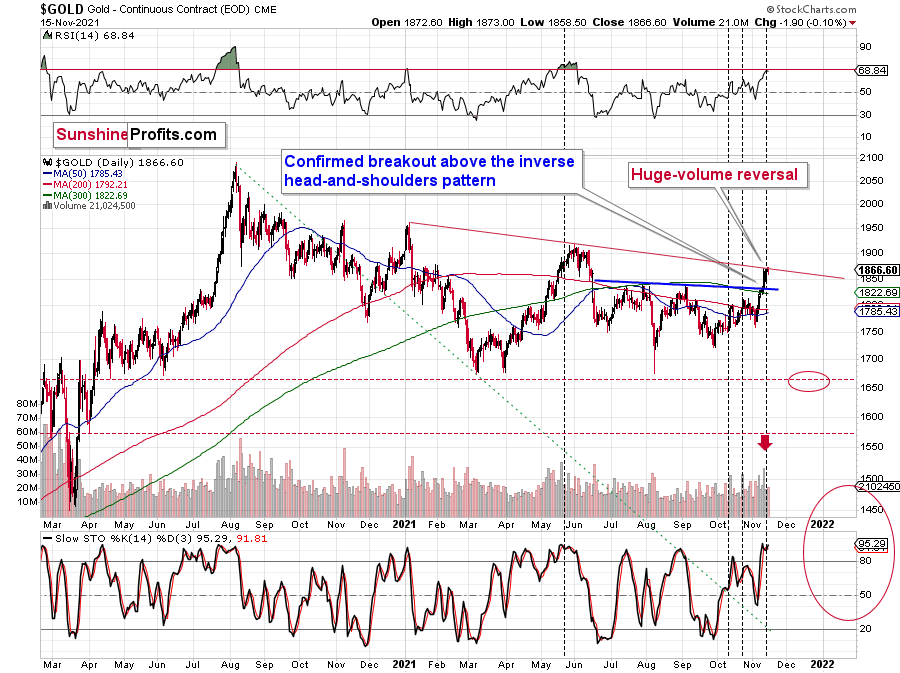
Speaking of the gold price, there’s one factor that I didn’t feature yesterday. That’s the fact that right now gold is at a declining resistance line based on the previous medium-term 2021 highs. The highs are important, and so is the resistance line. This, plus the RSI very close to 70, plus the situation in the USD Index, creates a situation in which gold is likely to decline soon.
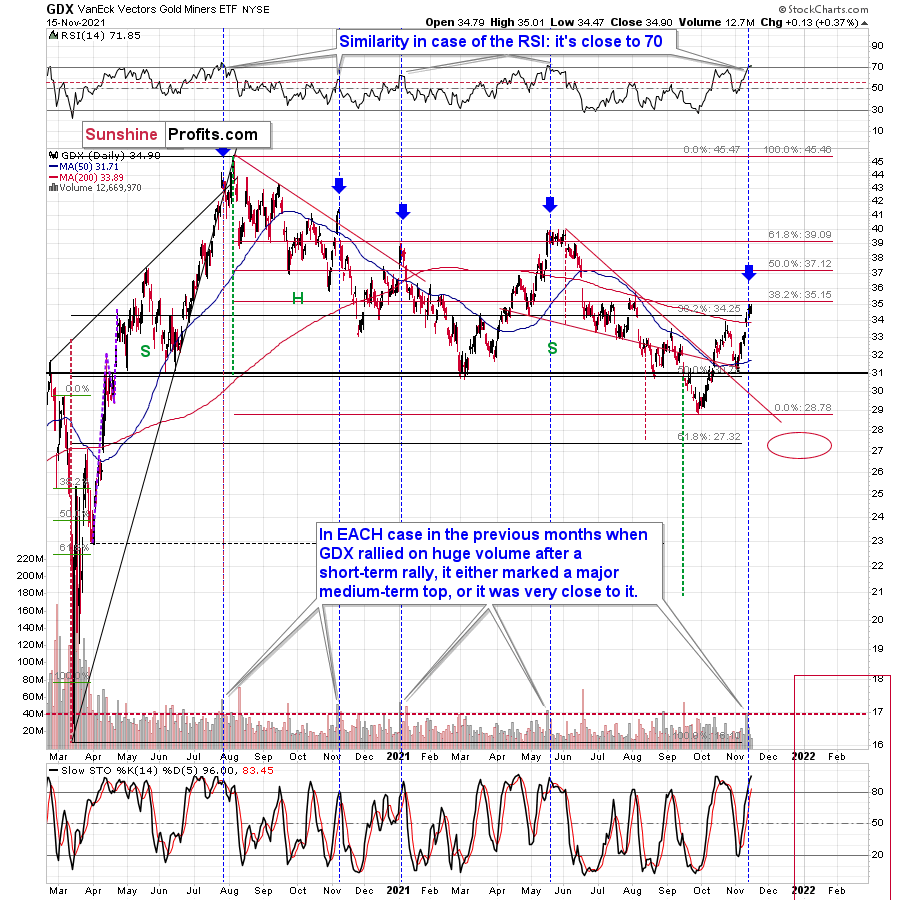
Just as gold did nothing yesterday, the same happened in the mining stocks - nothing. They (the GDX that is) once again moved to their recent intraday high on an intraday basis but ended the day below $35. This level has kept the rallies in check since late June, and now it has been strengthened by the 38.2% Fibonacci retracement level.
This, plus the fact that the RSI is above 70, creates a bearish picture. In fact, my previous comments on the above chart remain up-to-date:
To explain, the GDX ETF rallied on huge volume on Nov. 11 and there were only 4 cases in the recent past when we saw something like that after a visible short-term rally.
In EACH of those 4 cases, GDX was after a sharp daily rally.
In EACH of those 4 cases, GDX-based RSI indicator (upper part of the chart above) was trading close to 70.
The rallies that immediately preceded these 4 cases:
- The July 27, 2020 session was immediately preceded by a 29-trading-day rally that took the GDX about 42% higher. It was 7 trading days before the final top (about 24% of time).
- The November 5, 2020 session was immediately preceded by a 5-trading-day rally that took the GDX about 14%-15% higher (the high-volume day / the top). It was 1 trading day before the final top (20% of time).
- The January 4, 2021 session was immediately preceded by a 26-trading-day rally that took the GDX about 17%-18% higher (the high-volume day / the top). It was 1 trading day before the final top (about 4% of time).
- The May 17, 2021 session was immediately preceded by a 52-trading-day rally that took the GDX about 30% higher. It was 7 trading days before the final top (about 13% of time).
So, as you can see these sessions have even more in common than it seemed at the first sight. The sessions formed soon before the final tops (4% - 24% of time of the preceding rally before the final top), but the prices didn’t move much higher compared to how much they had already rallied before the high-volume sessions.
Consequently, since history tends to rhyme, we can expect the GDX ETF to move a bit higher here (but not significantly so) and we can expect this extra move higher to take between additional 0 to 7 trading days (based on the Nov. 12 session, so as of Nov. 16, it’s between 0 and 5 trading days).
Why 0 – 5 trading days (as of today – Nov. 16)? Because with the 4% timeline now in the rearview, the latter represents the updated 24% timeframe based on the preceding rally (that took 30 trading days).
Since it’s unlikely to take the mining stocks much higher, and the reversal could take place as soon as today, I don’t think that making adjustments to the current short positions in the mining stocks is justified from the risk to reward point of view.
Is there a meaningful resistance level that would be likely to trigger a decline in mining stocks? Yes! The GDX ETF is just below its 38.2% Fibonacci retracement level based on the August 2020 – September 2021 decline. The resistance is slightly above $35, so that’s when the final top could form.
As a result, those historical readings provided us with great shorting opportunities. And while I’m not increasing my short position, if I didn’t already have one in place, I would consider the current setup as offering a great risk-reward proposition.
The Silver Concern
One thing that’s concerning for the short term is the fact that the silver price is not outperforming the price of gold right now.
As a reminder, whenever silver outperforms gold on a short-term basis, it indicates that a top might be just around the corner. However, it hasn’t outperformed recently, which might mean that the final top is not yet in.
In yesterday’s “Letters to the Editor” section, I wrote that, in my view, the chance of gold moving to $1,900 this week was less than 40%. I think it’s now – based on silver’s lack of outperformance and the PMs’ strength relative to the USD Index – closer to 50/50.
Still, please note that even if gold rallies here, it doesn’t mean that mining stocks must follow it to a major extent. If it’s the final part of the upswing, gold stocks are likely to underperform (while silver might outperform).
Thank you for reading our free analysis today. Please note that the above is just a small fraction of the full analyses that our subscribers enjoy on a regular basis. They include multiple premium details such as the interim targets for gold and mining stocks that could be reached in the next few weeks. We invite you to subscribe now and read today’s issue right away.
Sincerely,
Przemyslaw Radomski, CFA
Founder, Editor-in-chief -
Will You Allow Gold to Break Your Heart?
November 15, 2021, 9:06 AMInfatuated with gold? Many people are, but love affairs with commodities (or stocks) are dangerous. They’ll steal your heart, then dump you.
Our critics often forget that we’re focusing on the medium-term outlook in precious metals, not intraday price moves. They’ll say “Look, gold moved up today. You were wrong Radomski.” That’s nice, but where will it be one or two months from now?
While gold, silver and mining stocks’ optimism resurfaced with a vengeance last week, the trio have broken plenty of hearts since peaking in August 2020. Thus, will the current rallies end in marriage or be another mirage?
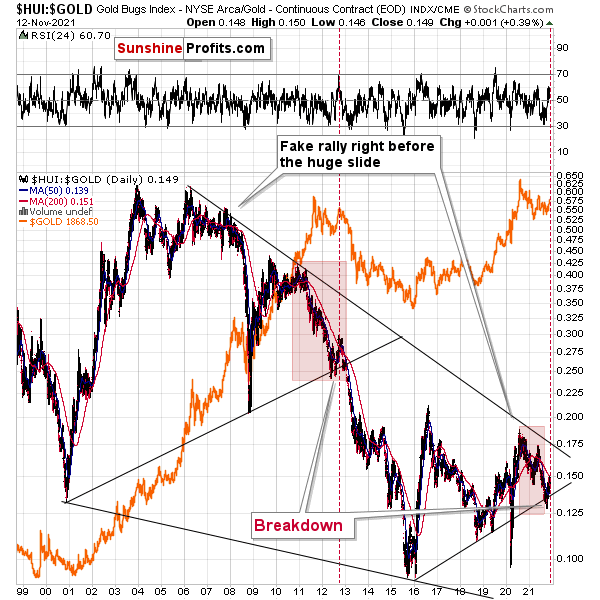
To begin, while the HUI Index/gold ratio invalidated the breakdown below its rising support line, a similar development occurred in 2013 and the downtrend still resumed.
On top of that, I marked (with the shaded red boxes below) just how similar the current price action is to 2013. And back then, after a sharp decline was followed by a small corrective upswing before the plunge, the ratio’s current behavior mirrors its historical counterpart. Furthermore, the end of the corrective upswing in 2013 occurred right before the gold price sunk to its previous lows (marked with red vertical dashed lines in the middle of the chart below). Thus, the ratio is already sending ominous warnings about the PMs’ future path.
Even more revealing, the ratio is dangerously close to its 200-day moving average. And when a similar development occurred in 2013 – with the ratio rising slightly above its 200-day moving average (marked with the red vertical dashed line below) – a sharp reversal occurred, mining stocks materially underperformed, and the ratio plunged.
Please see below:
Likewise, while the GDX ETF rallied again last week, I warned previously that a corrective upswing to $35 was a possibility (the senior miners reached this level intraday on Nov. 12). However, with the GDX ETF’s RSI (Relative Strength Index) signaling overbought conditions, the air should come out of the balloon sooner rather than later.
Please see below:
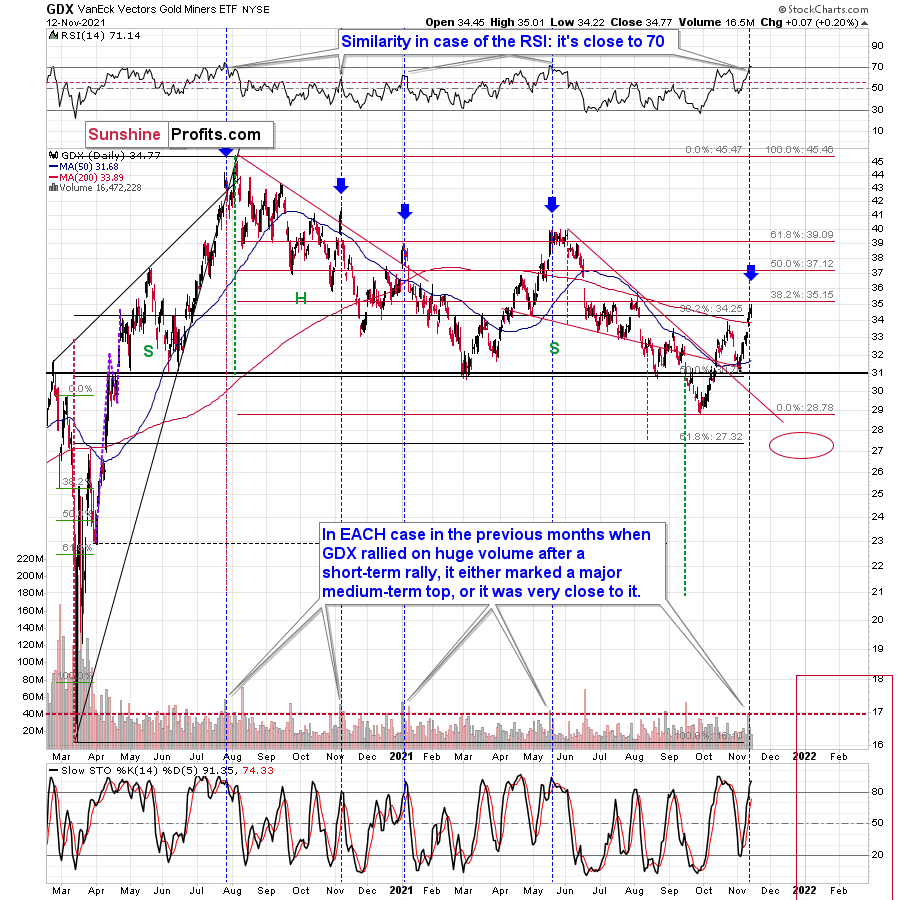
To explain, the GDX ETF rallied on huge volume on Nov. 11 and there were only 4 cases in the recent past when we saw something like that after a visible short-term rally.
In EACH of those 4 cases, GDX was after a sharp daily rally.
In EACH of those 4 cases, GDX-based RSI indicator (upper part of the chart above) was trading close to 70.
The rallies that immediately preceded these 4 cases:
- The July 27, 2020 session was immediately preceded by a 29-trading-day rally that took the GDX about 42% higher. It was 7 trading days before the final top (about 24% of time).
- The November 5, 2020 session was immediately preceded by a 5- trading -day rally that took the GDX about 14%-15% higher (the high-volume day / the top). It was 1 trading day before the final top (20% of time).
- The January 4, 2021 session was immediately preceded by a 26-trading-day rally that took the GDX about 17%-18% higher (the high-volume day / the top). It was 1 trading day before the final top (about 4% of time).
- The May 17, 2021 session was immediately preceded by a 52-trading-day rally that took the GDX about 30% higher. It was 7 trading days before the final top (about 13% of time).
So, as you can see, these sessions have even more in common than it seemed at first sight. The sessions formed soon before the final tops (4% - 24% of time of the preceding rally before the final top), but the prices didn’t move much higher compared to how much they had already rallied before the high-volume sessions.
Consequently, since the history tends to rhyme, we can expect the GDX ETF to move a bit higher here, but not significantly so, and we can expect this extra move higher to take between an additional 0 and 7 trading days (based on the Nov. 12 session, so as of Nov. 15 it’s between 0 and 6 trading days).
Why 0 – 6 trading days (as of today – Nov. 15)? Because with the 4% timeline now in the rearview, the latter represents the updated 24% timeline based on the preceding rally (that took 30 trading days).
Since it’s unlikely to take the mining stocks much higher, and the reversal could take place as soon as today (also in gold and silver price), I don’t think that making adjustments to the current short positions in the mining stocks is justified from the risk to reward point of view.
Is there a meaningful resistance level that would be likely to trigger a decline in mining stocks? Yes! The GDX ETF is just below its 38.2% Fibonacci retracement level based on the August 2020 – September 2021 decline. The resistance is slightly above $35, so that’s when the final top could form.
As for the GDXJ ETF, the gold junior miners have already hit their 38.2% Fibonacci retracement level (potential resistance) and the top may be upon us. Moreover, when the GDXJ ETF’s RSI increased above (or near) 70 in mid-2020 and in mid-2021, sharp drawdowns followed.
As a result, those historical readings provided us with great shorting opportunities.
In conclusion, investors have fallen in love with gold, silver, and mining stocks once again. However, when it comes time for matrimony, the precious metals often leave investors at the altar. As a result, while we remain bullish on gold, silver, and mining stocks’ long-term prospects, timing is important. And while the recent upswings may seem like the beginning of a new bull market, several reliable indicators beg to differ. Thus, caution is warranted, and new lows will likely materialize over the medium term.
Thank you for reading our free analysis today. Please note that the above is just a small fraction of the full analyses that our subscribers enjoy on a regular basis. They include multiple premium details such as the interim targets for gold and mining stocks that could be reached in the next few weeks. We invite you to subscribe now and read today’s issue right away.
Sincerely,
Przemyslaw Radomski, CFA
Founder, Editor-in-chief -
Early (Gold Video) Heads-up before the Next Week
November 14, 2021, 9:54 AMThe early heads-up video is available to premium subscribers.


Gold Investment News
Delivered To Your Inbox
Free Of Charge
Bonus: A week of free access to Gold & Silver StockPickers.
Gold Alerts
More-
Status
New 2024 Lows in Miners, New Highs in The USD Index
January 17, 2024, 12:19 PM -
Status
Soaring USD is SO Unsurprising – And SO Full of Implications
January 16, 2024, 8:40 AM -
Status
Rare Opportunity in Rare Earth Minerals?
January 15, 2024, 2:06 PM

