

-
Biden Signs a Bill to Revive Infrastructure… and Gold!
November 16, 2021, 7:46 AMGold rallied thanks to the changed narrative on inflation, and Biden’s infrastructure plan can only add to the inflationary pressure. Huge price moves ahead?
I have a short quiz for you! What the government should do to decrease inflation that reached the highest level in 30 years?
A) Decrease its expenditure to make room for the Fed to hike the federal funds rate.
B) Press the US central bank to tighten its monetary policy.
C) Deregulate the markets and lower taxes to boost the supply side of the economy.
D) Introduce a huge infrastructure plan that will multiply spending on energy, raw materials, and inputs in general.
Please guess which option the US government chose. Yes, the worst possible. Exam failed! At the beginning of November, Congress passed a bipartisan infrastructure bill. And President Biden signed it on Monday (November 15, 2021).
To be clear, I’m not claiming that America doesn’t need any investment in infrastructure. Perhaps it needs it, and perhaps it’s a better idea than social spending on unemployment benefits that discourage work. I don’t want to argue about the adequacy of large government infrastructure projects, although government spending generally fails to stimulate genuine economic growth and governments rarely outperform the private sector in effectiveness.
My point is that $1.2 trillion infrastructure spending is coming at the worst possible moment. The US economy is facing supply shortages and high inflation caused by surging demand, which choked the ports and factories. In short, too much money is chasing too few goods, and policymakers decided to add additional money into the already blocked supply chains! I have no words of admiration for the intellectual abilities of the members of Congress and the White House!
Indeed, the spending plan does not have to be inflationary if financed purely by taxes and borrowing. However, the Fed will likely monetize at least part of the newly issued federal debt, and you know, to build or repair infrastructure, workers are needed, and steel, and concrete, and energy. The infrastructure spending, thus, will add pressure to the ongoing energy crisis and high producer price inflation, not to mention the shortage of workers.
Implications for Gold
What does the passing of the infrastructure bill imply for the gold market? Well, it should be supportive of the yellow metal. First, it will increase the fiscal deficits by additional billions of dollars (the Congressional Budget Office estimates that the bill will enlarge the deficits by $256 billion). Second, government spending will add to the inflationary pressure, which gold should also welcome.
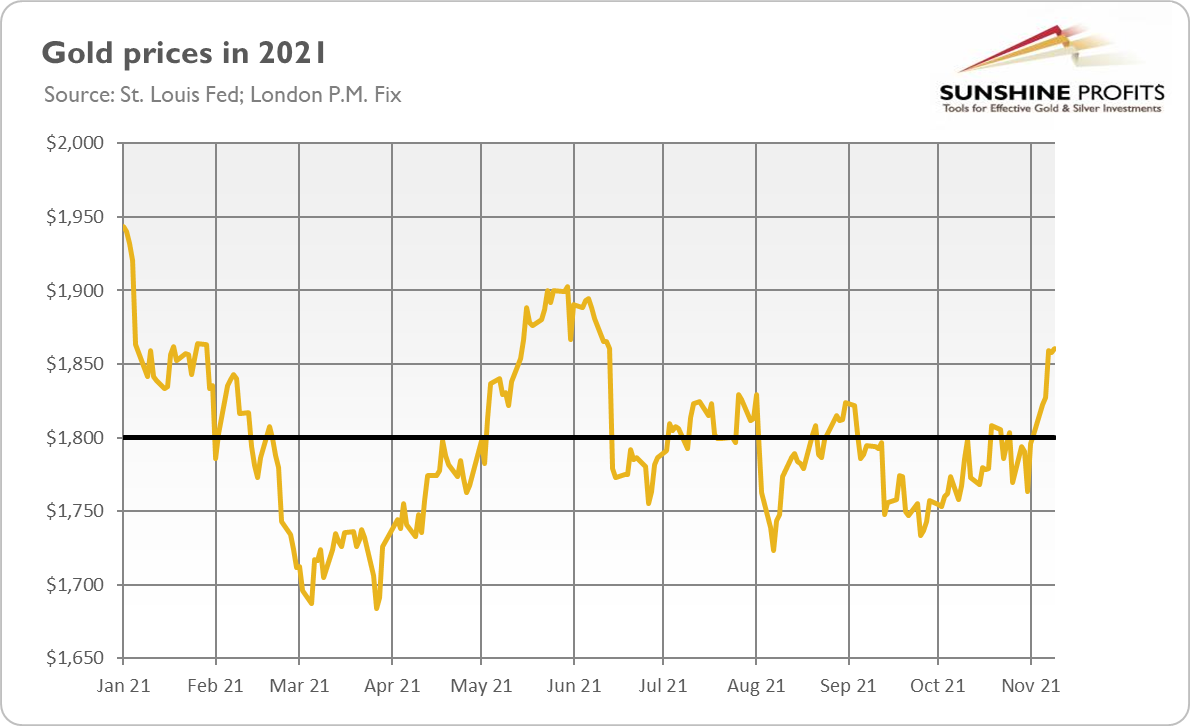
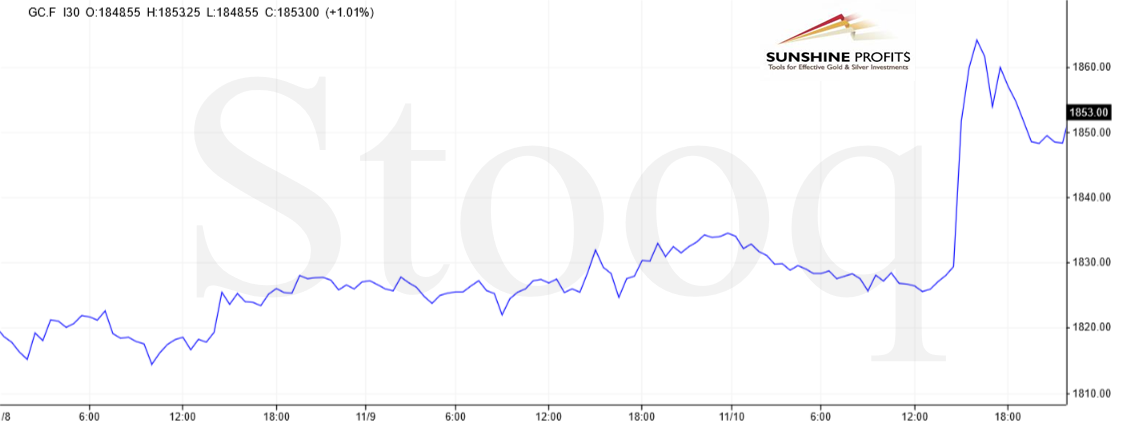
After all, gold recalled last week that it is a hedge against high and accelerating inflation. As the chart below shows, gold not only jumped above the key level of $1,800, but it even managed to cross $1,850 on renewed inflation worries. The infrastructure bill was probably discounted by the traders, so its impact on the precious metals market should be limited. However, generally, all news that could intensify inflationary fears should be supportive of the yellow metal.
You see, the narrative has changed. So far, the thinking was that higher inflation implies faster tapering and interest rates hikes and, thus, lower gold prices. This is why gold was waiting on the sidelines for the past several months despite high inflation. Investors also believed that inflation would be transitory. However, the recent CPI report forced the markets to embrace the fact that inflation could be more persistent.
What’s more, tapering of quantitative easing started, which erased some downward pressure on gold. Moreover, despite the slowdown in the pace of asset purchases, the Fed will maintain its accommodative stance and stay behind the curve. So, at the moment, the reasoning is that high inflation implies elevated fears, which is good for gold. I have always believed that gold’s more bullish reaction to accelerating inflation was a matter of time. It’s possible that this time has just come.
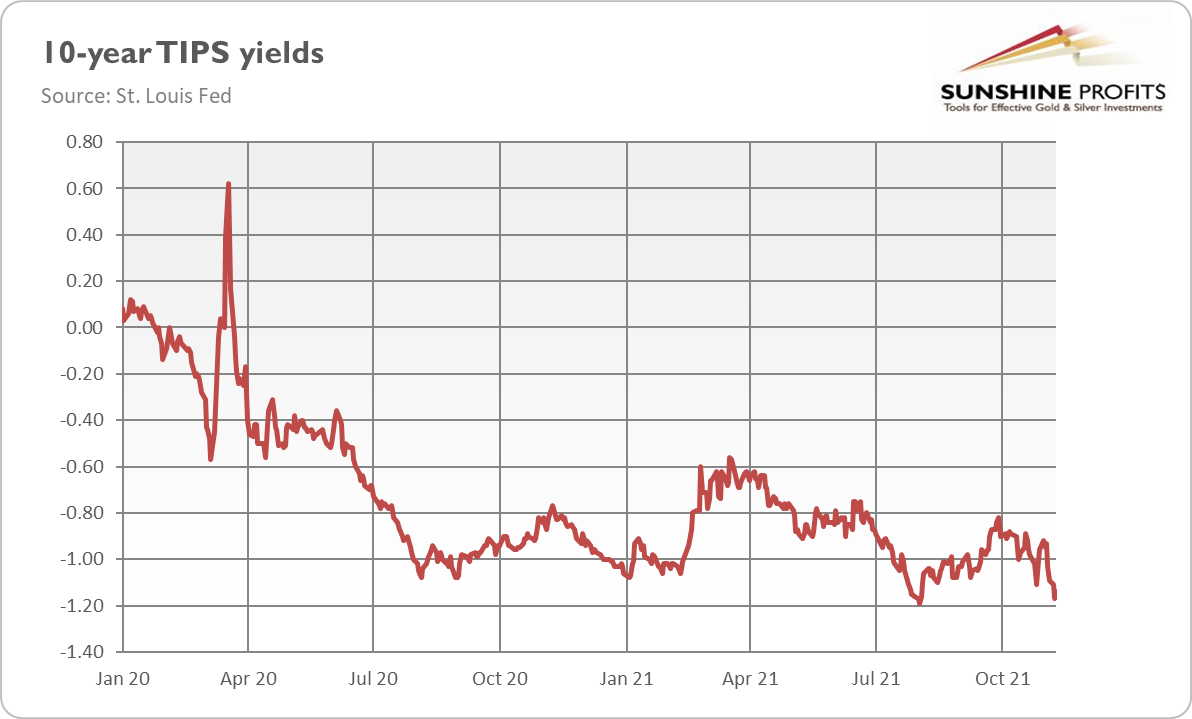
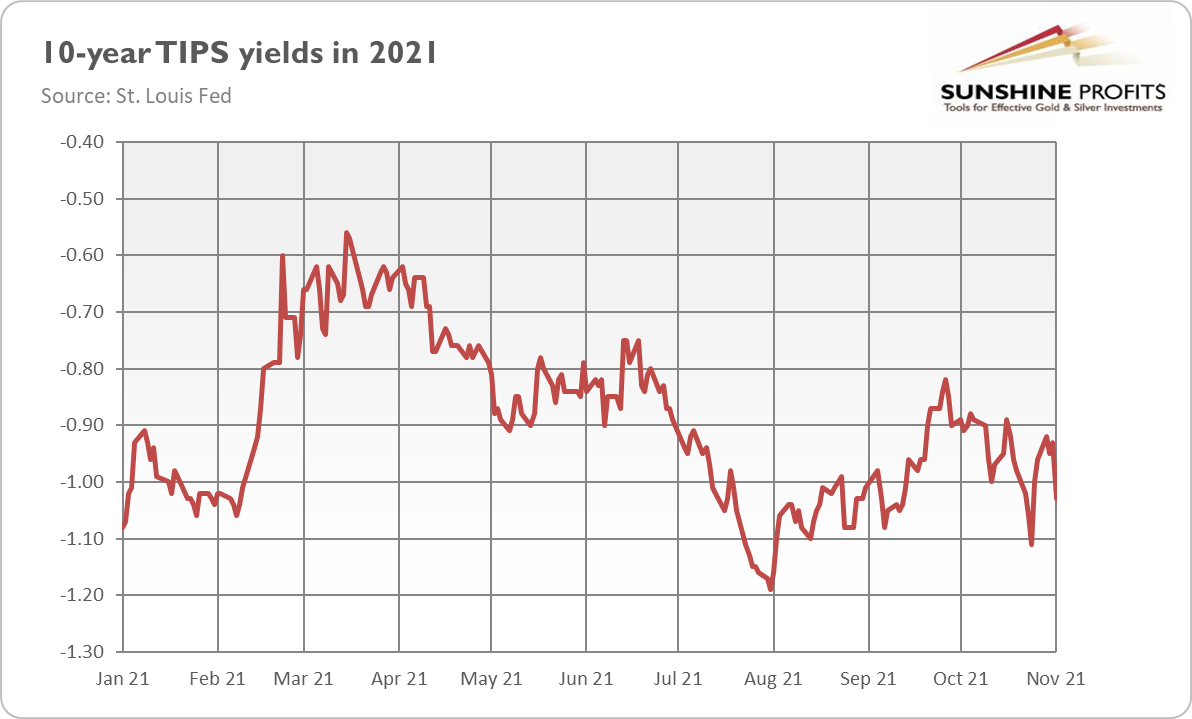
Having said that, investors should remember that market narratives can change quickly. At some point, the Fed will probably step in and send some hawkish signals, which could calm investors and pull some of them out of the gold market. My second concern is that gold could have reacted not to accelerating inflation, but rather to the plunge in the real interest rates. As the chart below shows, the yields on 10-year TIPS have dropped to -1.17, a level very close to the August bottom.
When something reaches the bottom, it should rebound later. And if real interest rates start to rally, then gold could struggle again. However, I’ll stop complaining now and allow the bulls to celebrate the long-awaited breakout. It’s an interesting development compared to the last months, that’s for sure!
If you enjoyed today’s free gold report, we invite you to check out our premium services. We provide much more detailed fundamental analyses of the gold market in our monthly Gold Market Overview reports, and we provide daily Gold & Silver Trading Alerts with clear buy and sell signals. To enjoy our gold analyses in their full scope, we invite you to subscribe today. If you’re not ready to subscribe yet, and you are not on our gold mailing list yet, we urge you to sign up there as well for daily yellow metal updates. Sign up now!
Arkadiusz Sieron, PhD
Sunshine Profits: Analysis. Care. Profits.-----
Disclaimer: Please note that the aim of the above analysis is to discuss the likely long-term impact of the featured phenomenon on the price of gold and this analysis does not indicate (nor does it aim to do so) whether gold is likely to move higher or lower in the short- or medium term. In order to determine the latter, many additional factors need to be considered (i.e. sentiment, chart patterns, cycles, indicators, ratios, self-similar patterns and more) and we are taking them into account (and discussing the short- and medium-term outlook) in our Gold & Silver Trading Alerts.
-
Inflation to the Moon - Gold Wears a Space Suit!
November 11, 2021, 9:39 AMInflation rears its ugly head, surging at the fastest pace since 1990. The yellow metal has finally reacted as befits an inflation hedge: went up.
Do you know what ambivalence is? It is a state of having two opposing feelings at the same time –this is exactly how I feel now. Why? Well, the latest BLS report on inflation shows that consumer inflation surged in October, which is something I hate because it lowers the purchasing power of money, deteriorating the financial situation of most people, especially the poorest and the least educated who don’t know how to protect against rising prices.
On the other hand, I feel satisfaction, as it turned out that I was right in claiming that high inflation would be more persistent than the pundits claimed. After the September report on inflation, I wrote: “I’m afraid that consumer inflation could increase even further in the near future”. Sieron vs. Powell: 1:0!
Indeed, the CPI rose 0.9% last month after rising 0.4% in September. The core CPI, which excludes food and energy prices, accelerated to 0.6% in October from 0.1% in the preceding month. And, as the chart below shows, the overall CPI annual rate accelerated from 5.4% in September to 6.2% in October, while the core CPI annual rate jumped from 4% to 4.6%. This surge (and a new peak) is a final blow to the Fed’s fairy tale about transitory inflation.
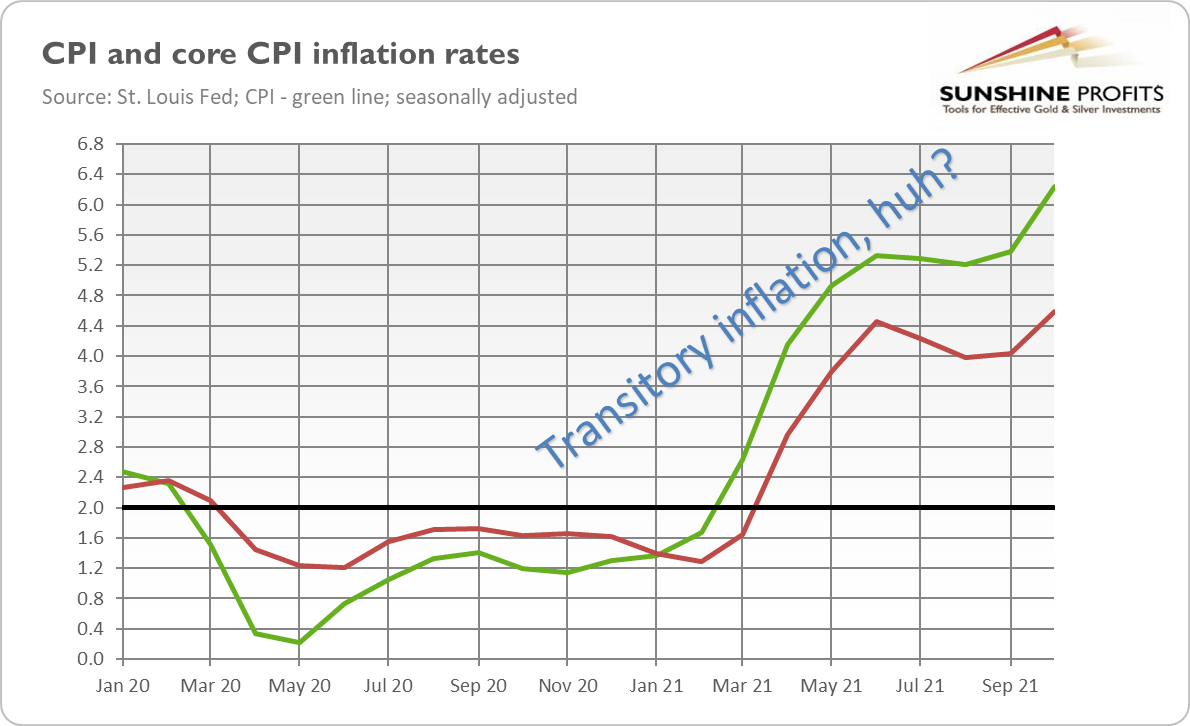
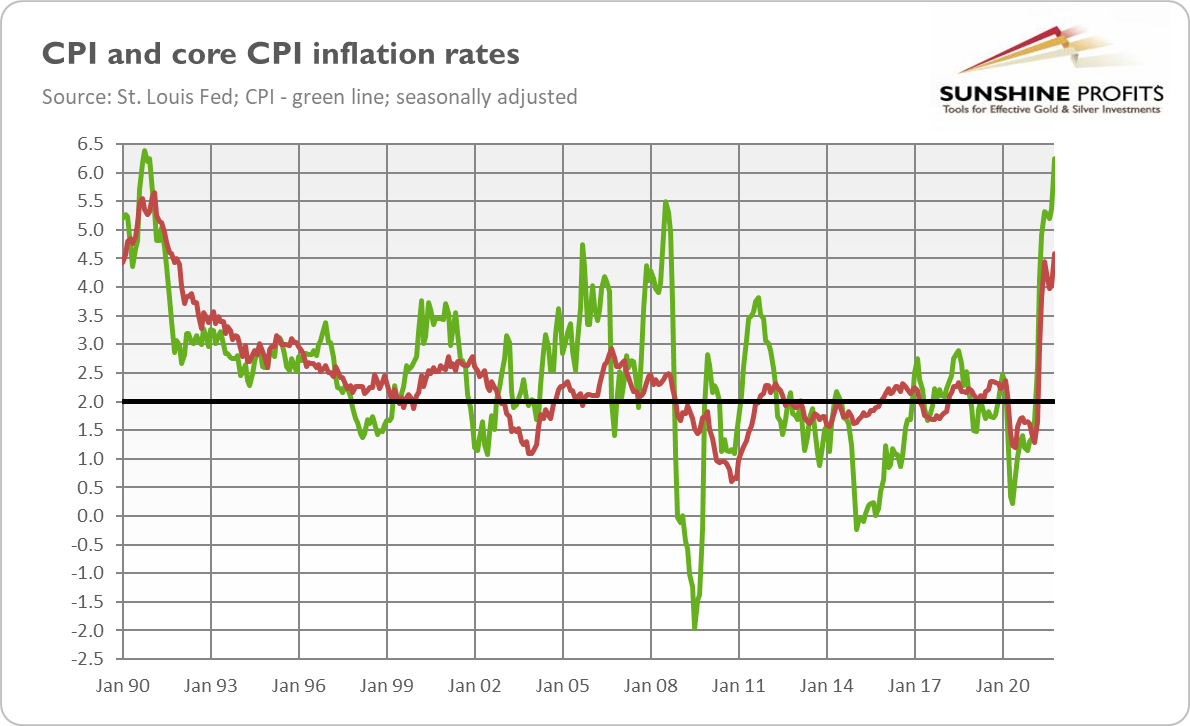
As one can see in the chart above, the CPI rate has stayed above the Fed’s target since March 2021, and it won’t decline to 2% anytime soon. This contradicts all definitions of transitoriness I know. What’s more, the October surge in inflation was not only above the expectations – it was also the biggest jump since November 1990, as the chart below shows.
Unfortunately for Americans, it might not be the last word of inflation. This is because over 80% of CPI subcomponents were above the Fed’s target of 2%, which clearly indicates that high inflation is not caused merely by the reopening of the economy but also by the broad-based factors such as the surge in the money supply.
Implications for Gold
Ladies and gentlemen, gold finally reacted to surging inflation! As the chart below shows, the price of gold (Comex futures) spiked from below $1,830 to above $1,860 after the BLS report on CPI.
Why did gold finally notice inflation and react as a true inflation hedge? Well, it seems that the narrative changed. Until recently, investors believed the Fed that inflation would be transitory. Reality, however, has disproved this story.
Another factor I would like to mention is the FOMC’s recent announcement of tapering of its quantitative easing. That event removed some downward pressure from the gold market. By the way, this is something I also correctly predicted in the Fundamental Gold Report that commented on September inflation report: “it seems that until the Fed tapers its quantitative easing, gold will remain under downward pressure. Nonetheless, when it finally happens, better times may come for gold.”
Indeed, yesterday’s rally suggests that gold recalled its function as a hedge against inflation. Until today, I was cautious in announcing the breakout in the gold market, as the yellow metal jumped above $1,800 only recently. However, the fact that gold managed not only to stay above $1,800 but also to continue its march upward (in tandem with the US dollar!) suggests that there is bullish momentum right now.
Having said that, investors should remember about the threat of a more hawkish Fed. Higher inflation could support the monetary hawks within the FOMC and prompt the US central bank to raise interest rates sooner rather than later. The prospects of a tightening cycle could weigh on gold.
However, as long as investors focus stronger on inflation than on tightening of monetary policy, and as long as the real interest rates decrease, or at do not increase, gold can go up.
If you enjoyed today’s free gold report, we invite you to check out our premium services. We provide much more detailed fundamental analyses of the gold market in our monthly Gold Market Overview reports, and we provide daily Gold & Silver Trading Alerts with clear buy and sell signals. To enjoy our gold analyses in their full scope, we invite you to subscribe today. If you’re not ready to subscribe yet, and you are not on our gold mailing list yet, we urge you to sign up there as well for daily yellow metal updates. Sign up now!
Arkadiusz Sieron, PhD
Sunshine Profits: Analysis. Care. Profits.-----
Disclaimer: Please note that the aim of the above analysis is to discuss the likely long-term impact of the featured phenomenon on the price of gold and this analysis does not indicate (nor does it aim to do so) whether gold is likely to move higher or lower in the short- or medium term. In order to determine the latter, many additional factors need to be considered (i.e. sentiment, chart patterns, cycles, indicators, ratios, self-similar patterns and more) and we are taking them into account (and discussing the short- and medium-term outlook) in our Gold & Silver Trading Alerts.
-
How Strange! Gold Rises on Strong Payrolls!
November 9, 2021, 8:51 AMUS economy added 531,000 jobs in October, surpassing expectations. Gold reacted… in a bullish way, and jumped above $1,800!
The October nonfarm payrolls came surprisingly strong. As the chart below shows, the US labor market added 531,000 jobs last month, much above the expectations (MarketWatch’s analysts forecasted 450,000 added jobs). So, it’s a nice change from the last two disappointing reports. What’s more, the August and September numbers were significantly revised up – by 235,000 combined. Let’s keep in mind that we also have the additions of 1,091,000 in July and 366,000 in August (after an upward revision).
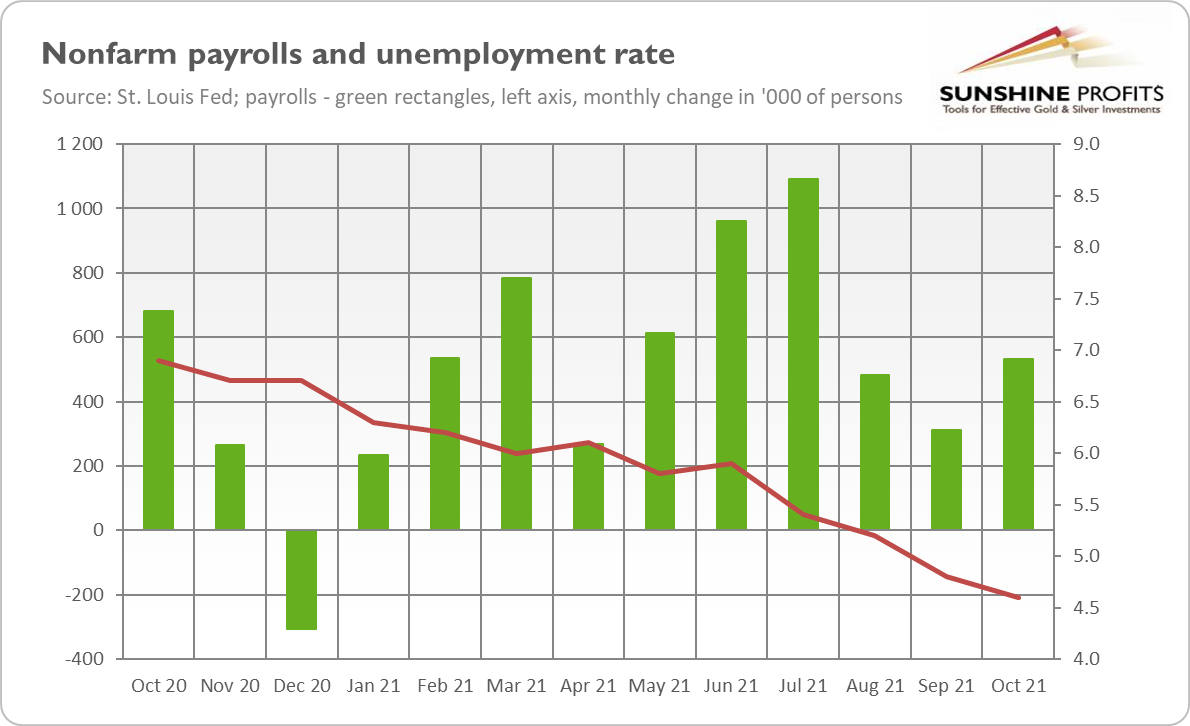
Additionally, the unemployment rate declined from 4.8% to 4.6%, as the chart above shows. It’s a positive surprise, as economists expected a drop to 4.7%. In absolute terms, the number of unemployed people fell by 255,000 - to 7.4 million. It’s a much lower level compared to the recessionary peak (23.1 million), however, it’s still significantly higher than before the pandemic (5.7 million and the unemployment rate of 3.5%).
Implications for Gold
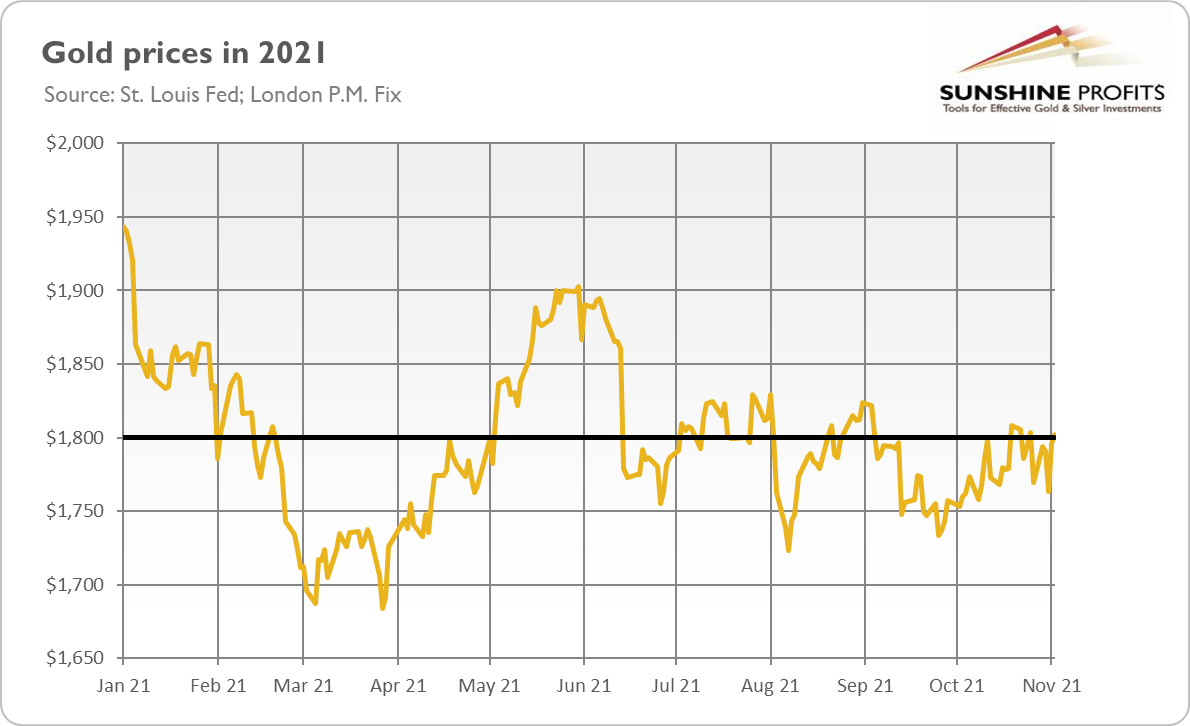
What does the recent employment report imply for the precious market? Well, gold surprised observers and rallied on Friday despite strong nonfarm payrolls. As the chart below shows, the London P.M. Fix surpassed the key level of $1,800.
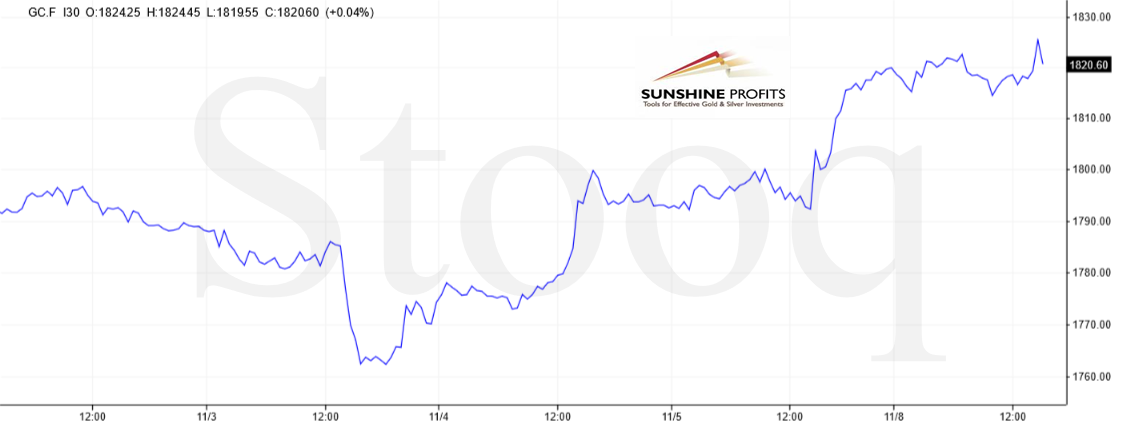
To show gold’s reaction more clearly, let’s take a look at the chart below, which shows that the price of gold futures initially declined after the October Employment Situation Report release. Only after a while, it rebounded and rallied to about $1,820.
It’s a surprising behavior, as gold usually reacted negatively to strong economic data. Until now, gold liked weak employment reports as they increased the chances of a dovish Fed that would continue its easy monetary policy. Now, something has changed. But what?
Well, some analysts would say that nothing has changed at all. Instead, they would tell us that the latest employment report is not as strong as it seems. In particular, the labor force participation rate was unmoved at 61.6% in October and has remained within a narrow range of 61.4% to 61.7% since June 2020, as the chart below shows. The lack of any improvement in the labor force participation rate could be interpreted as a lack of full employment and used by the Fed as an excuse to leave interest rates unchanged for a long time.
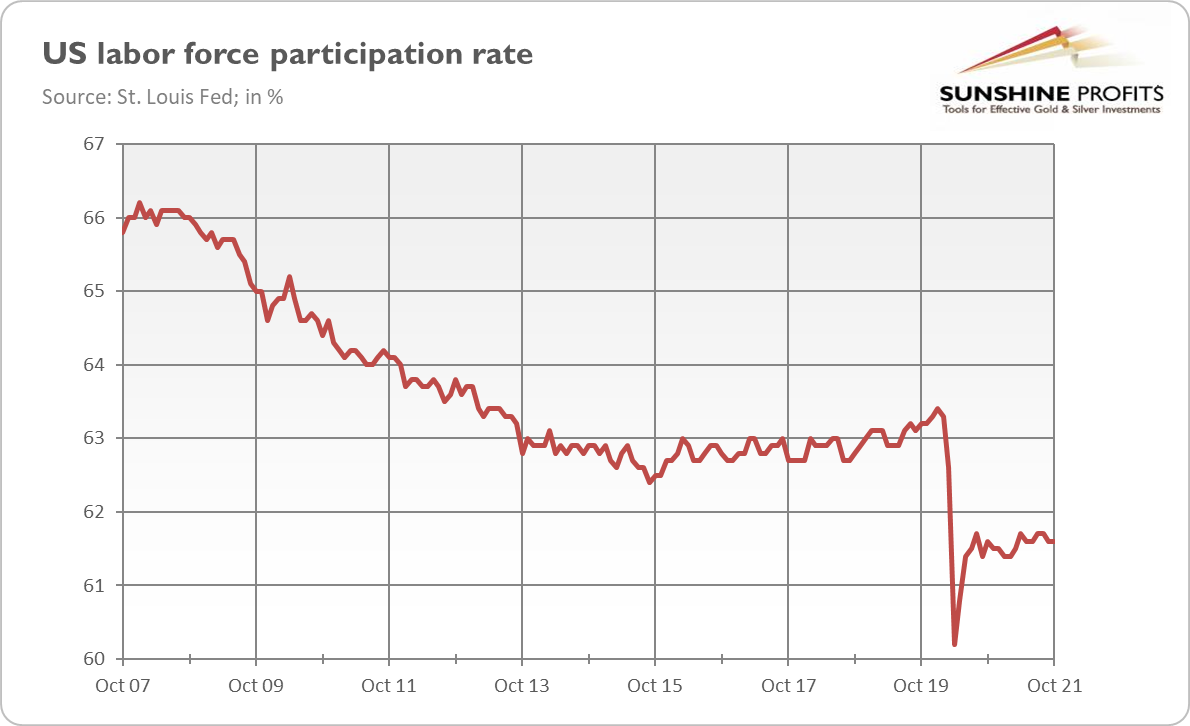
I’m not convinced by this explanation. “Full employment” does not mean that all people are working, but all people who want to work are working. And, as the chart above shows, the fact that after the Great Recession the labor participation rate didn’t move back to the pre-crisis level didn’t prevent the Fed from hiking interest rates in 2015-2019.
There is also another possibility. It might be the case that investors are now focusing on inflation. The employment report showed that the average hourly earnings have increased by 4.9% over the past twelve months, raising some concerns about wage inflation and general price pressure in the economy. Remember: context is crucial. If the new narrative is more about high inflation, good news may be positive for gold if they also indicate strong inflationary pressure.
Although I like this explanation, it’s not free from shortcomings. You see, stronger inflation concerns should increase inflation premium and bond yields. However, the opposite is true: the real interest rates declined last week (see the chart below), enabling gold to catch its breath. After all, the markets are expecting a more dovish Fed than before the announcement of tapering. This is a fundamentally positive development for the gold market.
Having said that, it’s too early to declare the start of the breakout. If inflation stays high, the US central bank could have no choice but to hike interest rates next year. Also, although the recent jump despite strong payrolls is encouraging, gold has yet to prove that it can stay above $1,800.
If you enjoyed today’s free gold report, we invite you to check out our premium services. We provide much more detailed fundamental analyses of the gold market in our monthly Gold Market Overview reports, and we provide daily Gold & Silver Trading Alerts with clear buy and sell signals. To enjoy our gold analyses in their full scope, we invite you to subscribe today. If you’re not ready to subscribe yet, and you are not on our gold mailing list yet, we urge you to sign up there as well for daily yellow metal updates. Sign up now!
Arkadiusz Sieron, PhD
Sunshine Profits: Analysis. Care. Profits.-----
Disclaimer: Please note that the aim of the above analysis is to discuss the likely long-term impact of the featured phenomenon on the price of gold and this analysis does not indicate (nor does it aim to do so) whether gold is likely to move higher or lower in the short- or medium term. In order to determine the latter, many additional factors need to be considered (i.e. sentiment, chart patterns, cycles, indicators, ratios, self-similar patterns and more) and we are taking them into account (and discussing the short- and medium-term outlook) in our Gold & Silver Trading Alerts.
-
Huge News! The Fed’s Tapering Is Finally Here!
November 4, 2021, 9:39 AMThe Fed has announced tapering of its quantitative easing! Preparing for the worst, gold declined even before the release - will it get to its feet? .
Ladies and gentlemen, please welcome to the stage the one and only tapering of the Fed’s quantitative easing! Yesterday was that day – the day when the FOMC announced a slowdown in the pace of its asset purchases:
In light of the substantial further progress the economy has made toward the Committee's goals since last December, the Committee decided to begin reducing the monthly pace of its net asset purchases by $10 billion for Treasury securities and $5 billion for agency mortgage-backed securities. Beginning later this month, the Committee will increase its holdings of Treasury securities by at least $70 billion per month and of agency mortgage‑backed securities by at least $35 billion per month.
It’s all but a bombshell, as this move was widely expected by the markets. However, what can be seen as surprising is the Fed’s decision to scale back its asset purchases already in November instead of waiting with the actual start until December. Hawks might be pleased – contrary to doves and gold bulls.
How is the tapering going to work? The Fed will reduce the monthly pace of its net asset purchases by $10 billion for Treasury securities and $5 billion for agency mortgage-backed securities each month:
Beginning in December, the Committee will increase its holdings of Treasury securities by at least $60 billion per month and of agency mortgage-backed securities by at least $30 billion per month. The Committee judges that similar reductions in the pace of net asset purchases will likely be appropriate each month, but it is prepared to adjust the pace of purchases if warranted by changes in the economic outlook.
So, instead of buying Treasuries worth $80 billion and agency mortgage‑backed securities worth $40 billion (at least), the Fed will purchase $70 billion of Treasuries later this month and $35 billion of MBS, respectively. Then, it will buy $60 billion of Treasuries and $30 billion of MBS in December, $50 billion of Treasuries and $25 billion of MBS in January, and so on until the last round of purchases in May 2022. This means that the quantitative easing will be completed by mid-year if nothing changes along the way.
The announcement of the tapering was undoubtedly the biggest event; however, I would like to point out one more modification. The sentence “inflation is elevated, largely reflecting transitory factors” was replaced in the newest statement with “inflation is elevated, largely reflecting factors that are expected to be transitory”. It’s not a big alteration, but “expected to be” is weaker than simply “is”. This means that the Fed’s confidence in its own transitory narrative has diminished, which implies that inflation might be more persistent than initially thought, which could support gold prices more decisively at some point in the future.
The Fed also explained why prices are rising: “Supply and demand imbalances related to the pandemic and the reopening of the economy have contributed to sizable price increases in some sectors”. Unsurprisingly, the Fed didn’t mention the surge in the money supply and the unconventional monetary and fiscal policies, just “imbalances”!
Implications for Gold
What does the Fed’s announcement of a slowdown in asset purchases imply for the gold market? Well, the yellow metal showed little reaction to the FOMC statement, as tapering was in line with market expectations. Actually, gold prices fell to three-week lows in the morning — right after the publication of positive economic data but before the statement. However, gold started to rebound after the FOMC announcement, as the chart below shows.
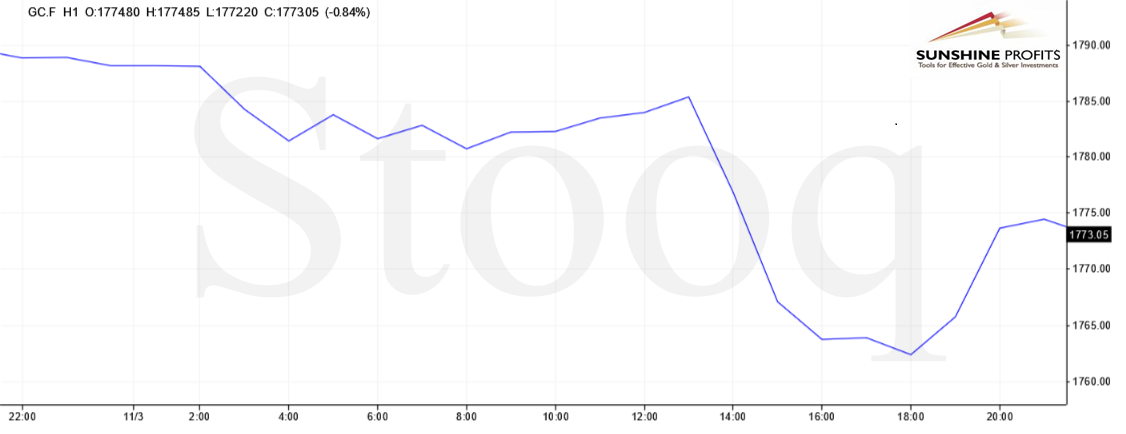
Why? The likely reason is that both the statement and Powell’s press conference were less hawkish than expected. After all, the Fed did very little to signal interest rate hikes.
What’s more, Powell expressed some dovish remarks. For instance, he said that it was a bad time to hike interest rates: “it will be premature to raise rates today” (…) We don’t think it is a good time to raise interest rates because we want to see the labor market heal more.”
The bottom line is that gold’s reaction to the FOMC statement was muted, as tapering was apparently already priced in. The lack of bearish reaction is a positive sign. However, gold’s struggle could continue for a while, perhaps until the Fed starts its tightening cycle. For now, all eyes are on Friday’s non-farm payrolls. Stay tuned!
If you enjoyed today’s free gold report, we invite you to check out our premium services. We provide much more detailed fundamental analyses of the gold market in our monthly Gold Market Overview reports, and we provide daily Gold & Silver Trading Alerts with clear buy and sell signals. To enjoy our gold analyses in their full scope, we invite you to subscribe today. If you’re not ready to subscribe yet, and you are not on our gold mailing list yet, we urge you to sign up there as well for daily yellow metal updates. Sign up now!
Arkadiusz Sieron, PhD
Sunshine Profits: Analysis. Care. Profits.-----
Disclaimer: Please note that the aim of the above analysis is to discuss the likely long-term impact of the featured phenomenon on the price of gold and this analysis does not indicate (nor does it aim to do so) whether gold is likely to move higher or lower in the short- or medium term. In order to determine the latter, many additional factors need to be considered (i.e. sentiment, chart patterns, cycles, indicators, ratios, self-similar patterns and more) and we are taking them into account (and discussing the short- and medium-term outlook) in our Gold & Silver Trading Alerts.
-
Here We Go Again - Gold Simply Can’t Stand $1,800!
November 2, 2021, 9:40 AMThe yellow metal couldn’t face the downward pressure and declined abruptly on Friday. What happened, and why did it fail?
Friday was a brutal time for gold. The price of the yellow metal dropped sharply from around $1,795 to $1,775 in the early morning hours in the US. Am I surprised? Not at all. In Thursday’s edition of the Fundamental Gold Report, I wrote that “gold may struggle until the Fed’s tightening cycle starts. You have been warned!”, and, as if on cue, gold wasn’t able to maintain its position around $1,800 and declined. Actually, gold prices have been testing and failing to hold this key psychological level for the last three weeks.
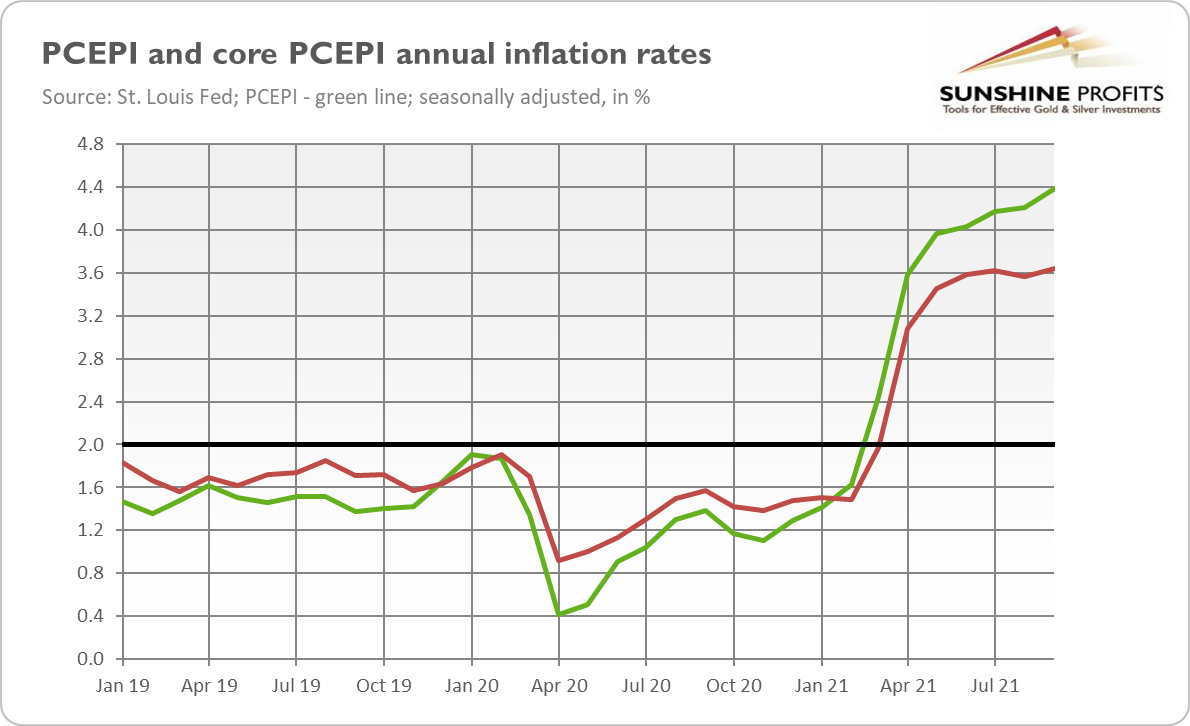
What exactly happened on Friday? Well, the Bureau of Economic Analysis published the report on personal income and outlays in September 2021. The publication shows that U.S. nominal consumer spending increased 0.6%, while the disposable personal income declined 1.3%, reflecting a decrease in government social benefits.
Additionally, the annual rate of change in personal consumption expenditures price index accelerated from 4.2% in August to 4.4% in September (see the chart below), the highest pace since January 1991.
Wait. Inflation rose, but gold prices declined? Exactly. Inflation is fundamentally positive for gold in the long run, but so far – as I explained last week – “inflationary worries have been counterweighted by the expectations of the Fed’s tightening cycle”. The relationship is simple: higher inflation translates into higher expectations of a more hawkish Fed. The odds of an interest rate hike in June 2022 increased from 23.1% - recorded at the end of September - to 61.6% on October 22 and 65.7% on October 29, 2021. As a result, the bond yields increased, while the greenback strengthened.
There is also another possible driver of rising interest rates and an appreciating US dollar. CPI inflation in the euro area accelerated to 4.1% in October from 3.4% in September, reaching the highest value since July 2008. However, the ECB kept its monetary policy unchanged last week despite quickly rising prices. Moreover, it’s not signaling any tightening of its stance, maintaining that high inflation is transitory even though Christine Lagarde acknowledged that the decline in inflation would take longer than the central bank had initially expected.
The point here is that the ECB remains an outlier among central banks, which either have already tightened or signaled tightening of their monetary policy. This means that the US dollar is likely to appreciate against the euro, which should be another headwind for gold. Having said that, this scenario will occur if the markets believe in a dovish stance of the EBC. The rising yields on German bonds indicate that the markets don’t entirely trust Lagarde’s rhetoric and expect a more hawkish stance of the ECB, which would be fortunate for gold.
Implications for Gold
What does higher US inflation imply for the gold market? Well, not so much in the short run. Even though I’ve seen some signs of a bullish revival in the gold market, the bulls remain too weak to challenge the $1,800 level. That’s too much, man!
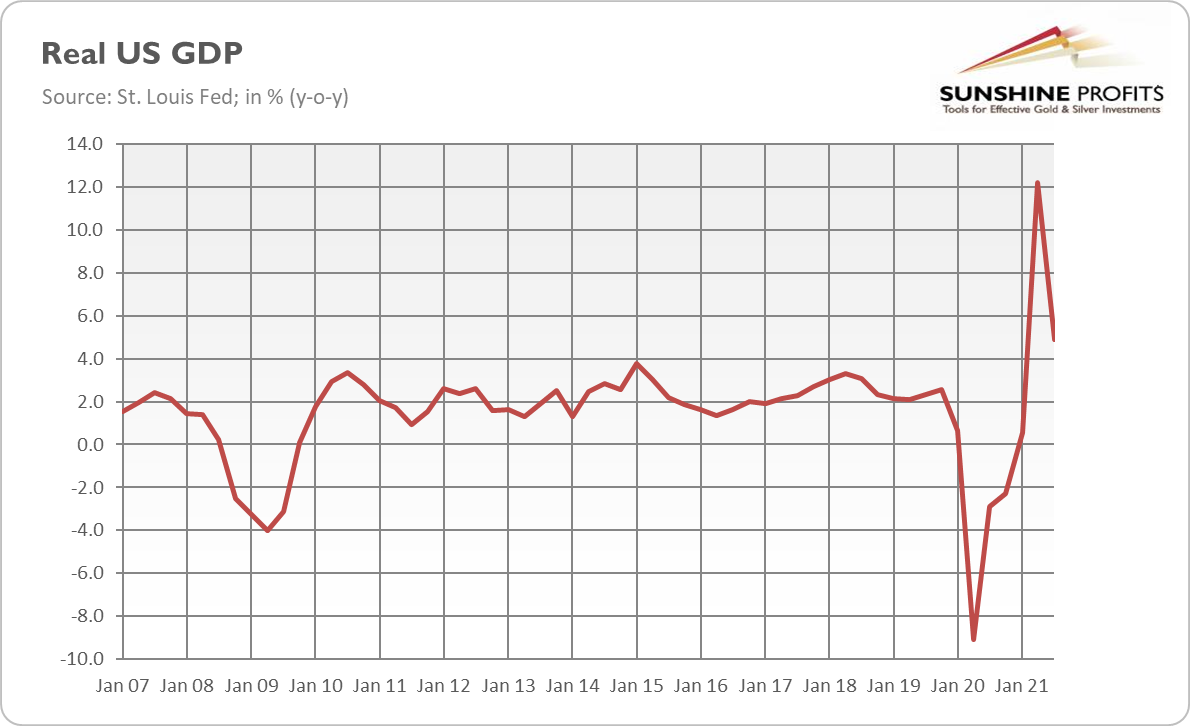
Luckily, better times are coming for gold. Have you seen the advance estimates of the durable goods orders (0.4% decline in September) or of the GDP in the third quarter of this year? According to the BEA, real GDP increased at an annual rate of 2.0% (annualized quarterly growth), much below the 6.7% reported in Q2 and much below the expectations of 2.8% growth. When it comes to the annual percentage growth year-over-year, real GDP rose 4.9% compared to 12.2% in Q2, as the chart below shows.
So, the pace of growth remains historically fast, but it’s decelerating quickly. Given that the economy has already reopened and energy and transportation crises are hurting growth (not to mention inflation wreaking havoc), we should expect a further slowdown on the way. And this brings us closer to… yes, you guessed it, stagflation.
To be clear: we are still far from stagnation, but the economic slowdown after a spectacular post-pandemic recovery is already unfolding. When we add it to high inflation, we should get an environment supportive of gold prices. However, supportive factors won’t be able to fully operate until the Fed starts hiking interest rates and gold prices bottom out. Sometimes one needs to hit rock bottom to succeed later; perhaps that’s also the case with gold. Time will tell.
If you enjoyed today’s free gold report, we invite you to check out our premium services. We provide much more detailed fundamental analyses of the gold market in our monthly Gold Market Overview reports, and we provide daily Gold & Silver Trading Alerts with clear buy and sell signals. To enjoy our gold analyses in their full scope, we invite you to subscribe today. If you’re not ready to subscribe yet, and you are not on our gold mailing list yet, we urge you to sign up there as well for daily yellow metal updates. Sign up now!
Arkadiusz Sieron, PhD
Sunshine Profits: Analysis. Care. Profits.-----
Disclaimer: Please note that the aim of the above analysis is to discuss the likely long-term impact of the featured phenomenon on the price of gold and this analysis does not indicate (nor does it aim to do so) whether gold is likely to move higher or lower in the short- or medium term. In order to determine the latter, many additional factors need to be considered (i.e. sentiment, chart patterns, cycles, indicators, ratios, self-similar patterns and more) and we are taking them into account (and discussing the short- and medium-term outlook) in our Gold & Silver Trading Alerts.


Gold Reports
Free Limited Version
Sign up to our daily gold mailing list and get bonus
7 days of premium Gold Alerts!
Gold Alerts
More-
Status
New 2024 Lows in Miners, New Highs in The USD Index
January 17, 2024, 12:19 PM -
Status
Soaring USD is SO Unsurprising – And SO Full of Implications
January 16, 2024, 8:40 AM -
Status
Rare Opportunity in Rare Earth Minerals?
January 15, 2024, 2:06 PM

