

-
FOMC Pushes Gold Prices Down
September 23, 2021, 9:25 AMBrace yourselves, gold bulls, as the Fed clears the way for tapering and shifts interest rate liftoff to 2022. You’ve been warned.
Yesterday (September 22, 2021), the FOMC published its newest statement on monetary policy. There are just a few alterations in the publication, which mainly reflect changes in the economic environment. The Fed noted that the sectors most adversely affected by the pandemic “have improved in recent months, but the rise in COVID-19 cases has slowed their recovery”, while inflation “is elevated” (last time, the Fed wrote that “inflation has risen”).
However, the most important change is, of course, the signal about a slowdown in the pace of asset purchases. The Fed acknowledged the economy’s progress towards the goals of price stability and maximum employment, and said that tapering of quantitative easing could soon be warranted:
Last December, the Committee indicated that it would continue to increase its holdings of Treasury securities by at least $80 billion per month and of agency mortgage‑backed securities by at least $40 billion per month until substantial further progress has been made toward its maximum employment and price stability goals. Since then, the economy has made progress toward these goals. If progress continues broadly as expected, the Committee judges that a moderation in the pace of asset purchases may soon be warranted.
Although this is not a revolution in the Fed’s thinking and it’s not a surprise for the markets, the move is hawkish. The statement shows that the US central bank is determined to begin tapering soon despite the weak non-farm payrolls in August. The Fed didn’t provide any date, but investors could expect an announcement in October or November and effective implementation by the end of this year.
Thus, the statement is negative for the gold prices. However, the silver lining is that the FOMC decided to write “moderation” instead of simply “tapering”. For me, this particular phrasing sounds softer, which gives some hope that tapering will be very gradual. So, the Fed’s monetary policy would remain accommodative for quite a long time.
September Dot-Plot and Gold
Now, let’s move on to the Fed’s newest economic projections that accompanied the statement. As the table below shows, the FOMC expects slower GDP growth, higher unemployment rate and higher inflation this year compared to its June’s forecasts.
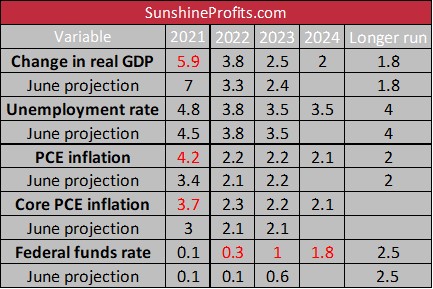
To be more precise, the FOMC expects that the GDP will jump 5.9% in 2021, compared to the 7% rise expected in June. It’s still an impressive surge but significantly slower than it was expected just three months ago. So, it seems that the Fed has taken the negative impact of the spread of the Delta variant of the coronavirus into account. Similarly, the unemployment rate is forecasted to decrease to 4.8% instead of to 4.5% expected in the previous projections.
Meanwhile, the US central bank has also increased its inflation outlook. The FOMC members believe now that the PCE inflation will jump 4.2% this year, compared to 3.4% seen in December. The core PCE inflation is also expected to rise faster, i.e., 3.7%, versus 3% projected previously. So, the Fed expects a slowdown in the GDP growth combined with acceleration in inflation, which sounds stagflationary at the margin. These forecasts, when analyzed alone, should be positive for gold prices.
However, the US central bank also updated its forecast for the interest rates. And I don’t have good news. In the latest edition of the Fundamental Gold Report (September 16, 2021), I warned readers of hawkish changes in the expected path of the federal funds rate.
Given the increase in inflation since June and all the employment progress the economy made, the upcoming dot-plots could be hawkish and send gold prices lower. You have been warned.
And, indeed, according to the fresh dot plot, the FOMC considers one interest rate hike next year as appropriate at the moment. On top of that, the Fed sees three additional 25-basis points increases in 2023, and three more in 2024 (and more hikes later in the future). So, instead of two hikes in 2023, we have one upward move as soon as in 2022 and three more in the following year. It means that the curve of the expected federal funds rate has become much steeper, which could make gold struggle.
Implications for Gold
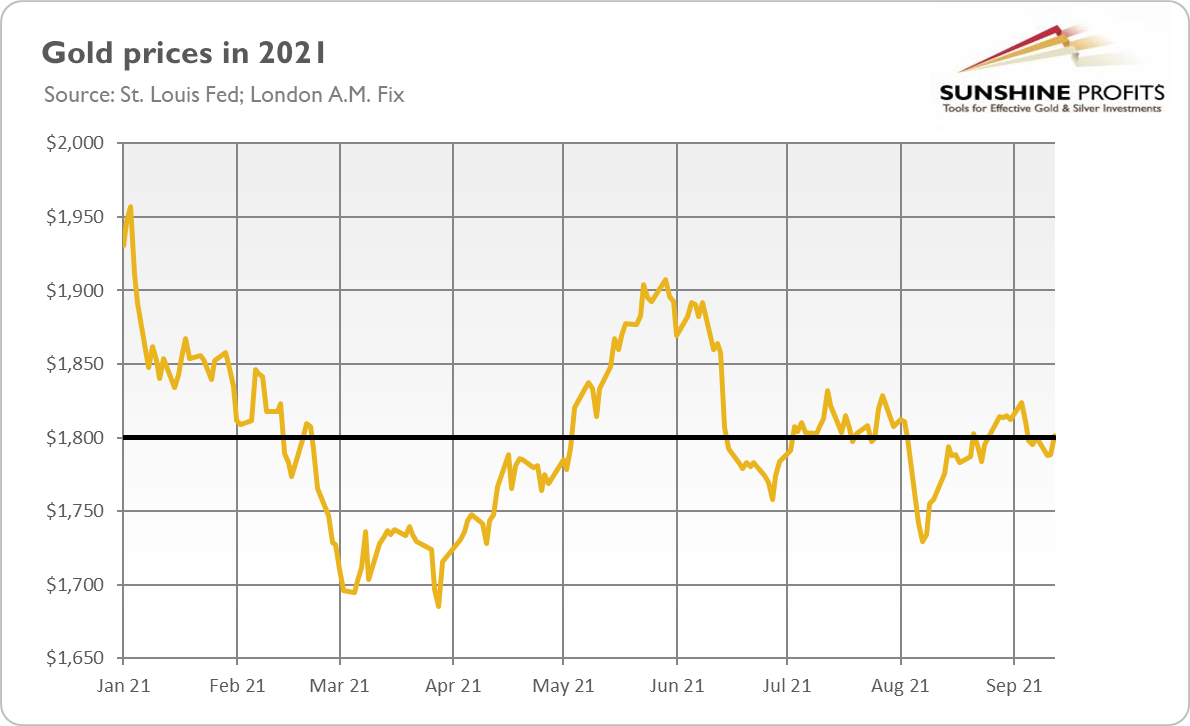
What do the latest FOMC statement and dot-plot imply for the gold market? Well, the Fed cleared the way to taper its asset purchase program and signaled that the first interest rate hike could occur sooner than expected. Not surprisingly, the price of gold declined in response to the shift in the timeline of the interest rates liftoff, in line with my expectations.
When it comes to the future, I believe that when the dust settles, gold may find some short-term relief. However, my guess is that gold will struggle until the Fed’s tightening cycle is well underway.
If you enjoyed today’s free gold report, we invite you to check out our premium services. We provide much more detailed fundamental analyses of the gold market in our monthly Gold Market Overview reports, and we provide daily Gold & Silver Trading Alerts with clear buy and sell signals. To enjoy our gold analyses in their full scope, we invite you to subscribe today. If you’re not ready to subscribe yet, and you are not on our gold mailing list yet, we urge you to sign up there as well for daily yellow metal updates. Sign up now!
Arkadiusz Sieron, PhD
Sunshine Profits: Analysis. Care. Profits.-----
Disclaimer: Please note that the aim of the above analysis is to discuss the likely long-term impact of the featured phenomenon on the price of gold and this analysis does not indicate (nor does it aim to do so) whether gold is likely to move higher or lower in the short- or medium term. In order to determine the latter, many additional factors need to be considered (i.e. sentiment, chart patterns, cycles, indicators, ratios, self-similar patterns and more) and we are taking them into account (and discussing the short- and medium-term outlook) in our Gold & Silver Trading Alerts.
-
Softening Inflation: Gold Jumps Again
September 16, 2021, 8:13 AMInflation softened further in August, and gold reacted positively. Look closely at what the Fed’s doing, as that’s where the clues for the future are.
Consumer inflation eased further in August. According to the latest BLS report on inflation, the CPI increased 0.3% last month after rising 0.5% in July. The core CPI, which excludes food and energy prices, also softened — it rose 0.1% after increasing 0.3% in the preceding month. It was the smallest increase since February 2021. The deceleration was mainly caused by declines in the index for used cars and trucks, which fell 1.5%, and in the index for transportation services, which decreased 2.3% (driven by a sharp fall of 9.1% in airline fares).
However, on an annual basis, the overall inflation stayed practically unchanged, rising again at a disturbingly high pace, as the chart below shows. The overall index surged 5.3% in August, following 5.4% in the previous month. Meanwhile, the core CPI soared 4%, following a 4.3% jump in July.
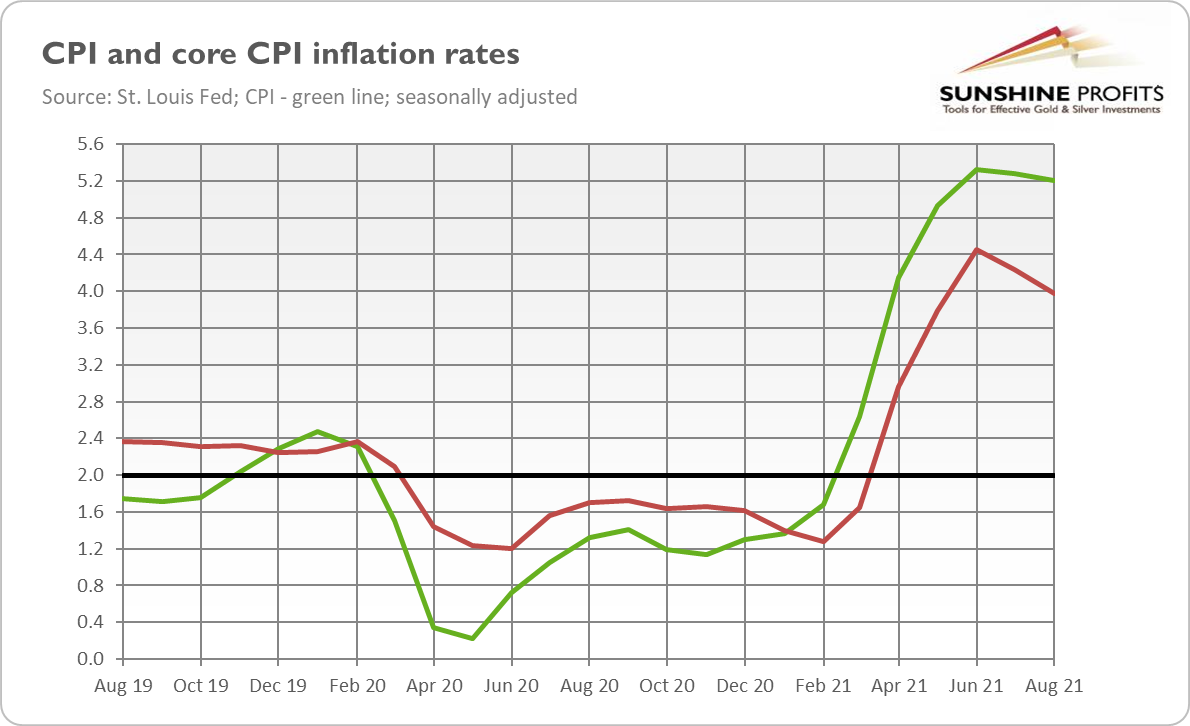
So, as one can see in the chart above, inflation peaked in June and decelerated for the second month in a row. However, what I wrote last month remains valid: “[inflation] remained disturbingly high, despite the deceleration in several subindexes, including the index for used cars. I dread to think what inflation would be if these categories weren’t moderate!”
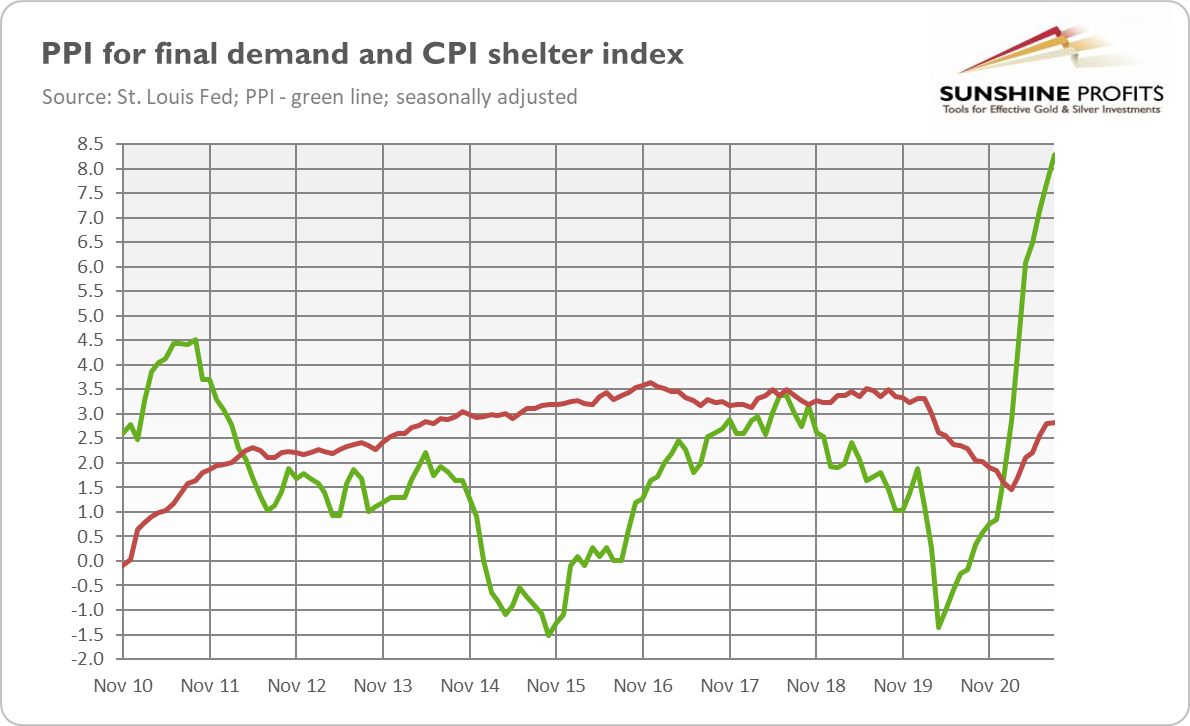
Inflation did soften, but it remains elevated and above 5% on an annual basis. Moreover, it doesn’t have to go away anytime soon. Why? The first reason is that the supply-chain crisis hasn’t ended yet. The supply-side problems are keeping the producer prices hot. In August, the PPI for final demand rose 0.7%, following 1% in July. Although the monthly pace decreased, it was still above expectations. But over the past 12 months, the producer price inflation soared 8.3%, significantly faster than 7.8% in July. It was the biggest jump since November 2010, when the series started, as the chart below shows.
The unresolved supply-chain crisis and stubbornly high producer price inflation imply that inflationary pressures are likely to persist and to be translated into higher consumer prices in the future. Because inventories are tight and because the mindset has changed, producers are relatively easily passing on higher costs to consumers.
Secondly, the index for shelter – the biggest component of the CPI – has been rising gradually since February 2021, and it accelerated from 2.79% in July to 2.82% in August, as the chart above shows. As a reminder, home prices – which are not covered by the CPI – have been surging recently, which should translate into further increases in the index for shelter.
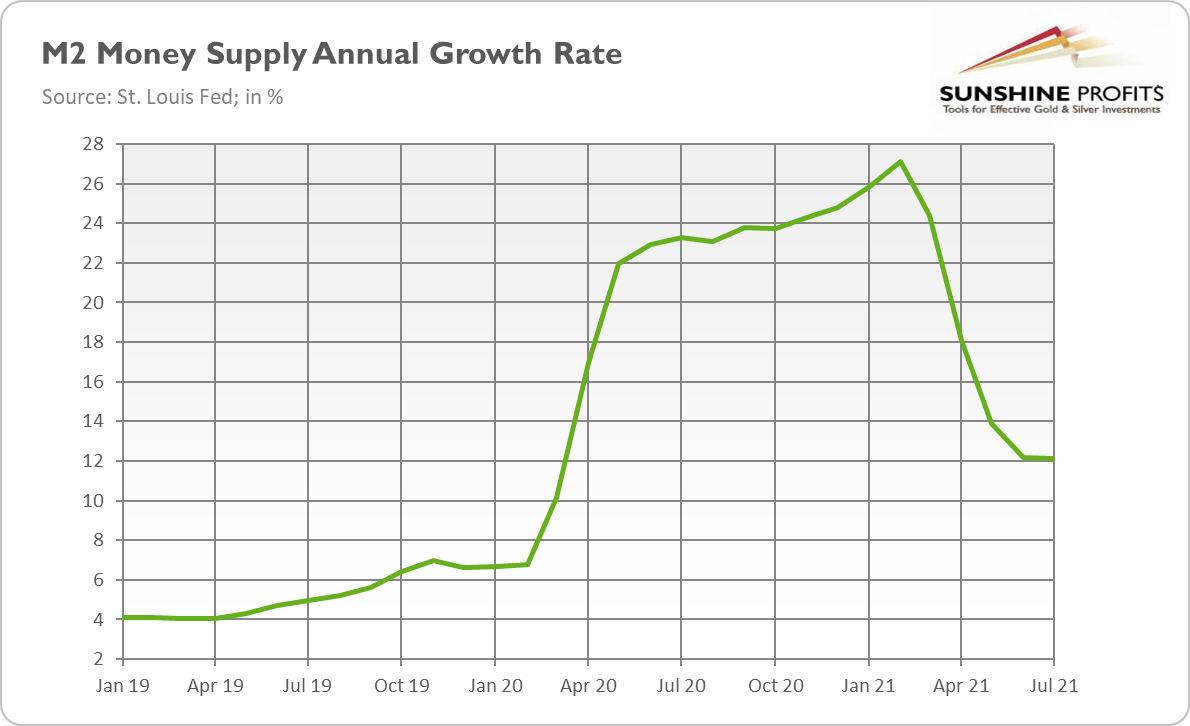
Last but not least, the annual growth of the M2 money supply has stabilized at about 12%, as the chart below shows. It’s of course much lower than the 27% recorded in February 2021, but it’s still almost twice as fast as the 6.8% seen just before the pandemic started. And the easy fiscal policy could also add something to the inflationary pressures if the fiscal deficits are monetized. All these developments suggest that inflation isn’t disappearing just yet.
Implications for Gold
What does the August report on the CPI imply for the gold market? Well, theoretically, softer inflation should be negative for assets sensitive to inflation such as gold. The yellow metal is seen as an inflation hedge, but the data says that it shines when inflation is high and accelerating. So, the deceleration should be bad news for gold.
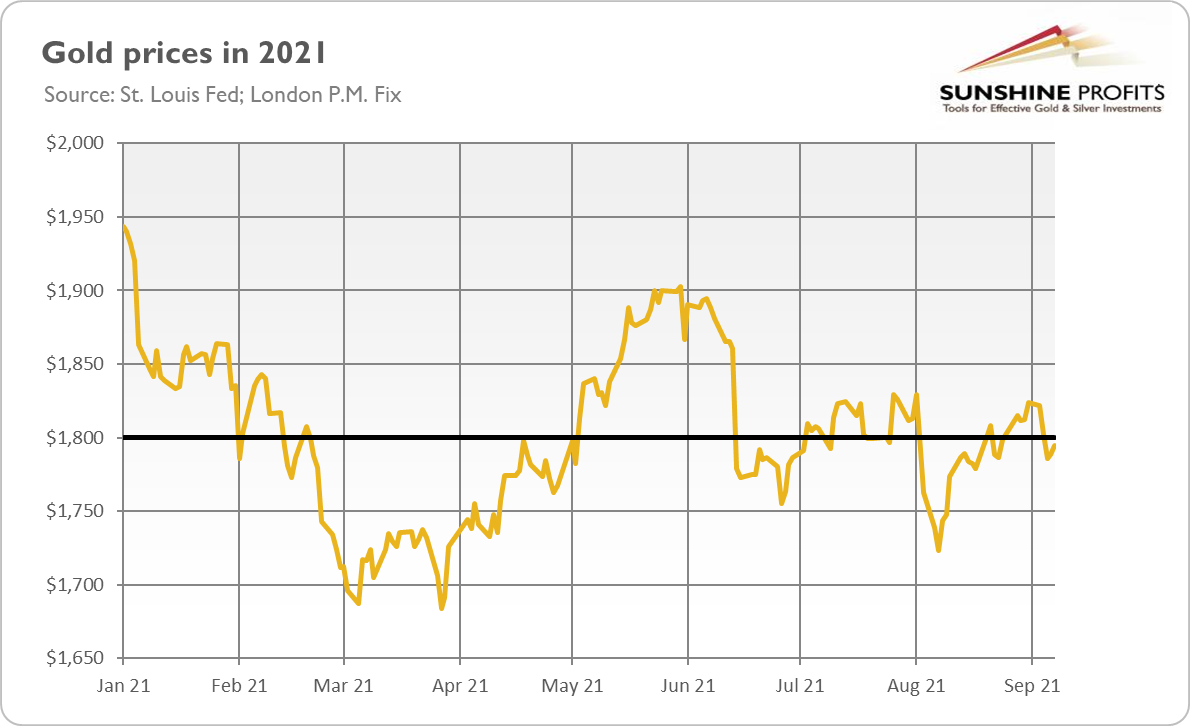
However, as the chart below shows, the price of gold has increased after the publication of the inflation report, jumping again above $1,800. Just as one month ago, slightly softer inflation has offered some hopes that inflation would prove to be transitory, in line with Powell’s narrative, and provide the Fed with an excuse to continue its ultra-dovish monetary policy. Indeed, according to the CME FedWatch Tool, the expectations for the Fed’s tightening cycle have diminished slightly from the previous week. For instance, the odds for the interest rate hike in December 2022 have declined from 54% to 50%, so it’s a coin toss. The softening of these expectations has supported gold prices.
However, the dark clouds are still present on the horizon. Although the August CPI eases somewhat the need for the Fed to begin to taper its quantitative easing, the inflation report shouldn’t materially change the Fed’s stance. After all, inflation is still significantly above the target and partial normalization of the monetary policy is coming anyway.
What’s more, this month the FOMC statement will be accompanied by a fresh dot-plot. As a reminder, the latest Fed’s projections plunged gold prices, as they revealed that the US central bankers were eager to hike the federal funds rate earlier than previously thought. Given the increase in inflation since June and all the employment progress the economy made, the upcoming dot-plots could be hawkish and send gold prices lower. You have been warned.
If you enjoyed today’s free gold report, we invite you to check out our premium services. We provide much more detailed fundamental analyses of the gold market in our monthly Gold Market Overview reports, and we provide daily Gold & Silver Trading Alerts with clear buy and sell signals. To enjoy our gold analyses in their full scope, we invite you to subscribe today. If you’re not ready to subscribe yet, and you are not on our gold mailing list yet, we urge you to sign up there as well for daily yellow metal updates. Sign up now!
Arkadiusz Sieron, PhD
Sunshine Profits: Analysis. Care. Profits.-----
Disclaimer: Please note that the aim of the above analysis is to discuss the likely long-term impact of the featured phenomenon on the price of gold and this analysis does not indicate (nor does it aim to do so) whether gold is likely to move higher or lower in the short- or medium term. In order to determine the latter, many additional factors need to be considered (i.e. sentiment, chart patterns, cycles, indicators, ratios, self-similar patterns and more) and we are taking them into account (and discussing the short- and medium-term outlook) in our Gold & Silver Trading Alerts.
-
Eurozone Impact on Gold: The ECB and the Phantom Taper
September 14, 2021, 7:47 AMThe ECB tapered its asset purchases. Only that it didn’t taper at all. Are you confused? Gold isn’t – it simply doesn’t care.
Tapering has begun. For now, in the Eurozone. This is at least what headlines suggest, as last week, the Governing Council of the European Central Bank held its monetary policy meeting. The European central bankers decided to slow down the pace of their asset purchases:
Based on a joint assessment of financing conditions and the inflation outlook, the Governing Council judges that favourable financing conditions can be maintained with a moderately lower pace of net asset purchases under the pandemic emergency purchase programme (PEPP) than in the previous two quarters.
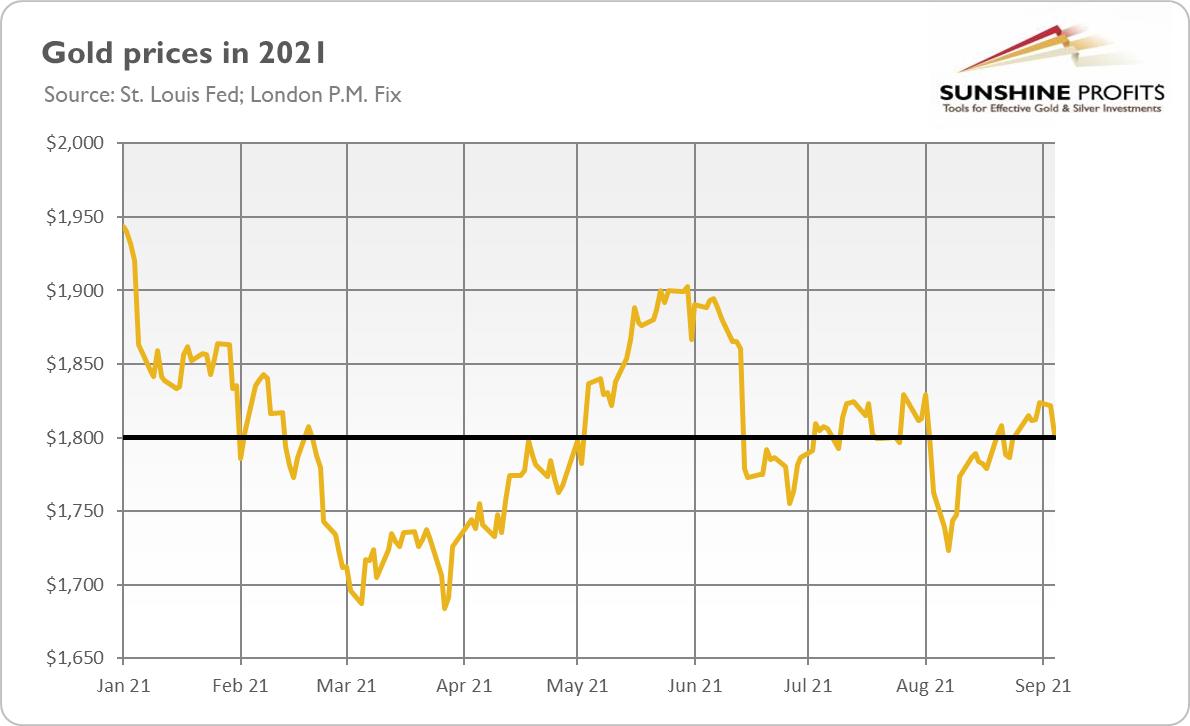
The financial markets were only slightly moved by the ECB’s action. The price of gold also barely changed, as the chart below shows. One reason is that such a step was widely expected. Another one is that this “tapering” is actually “pseudo-tapering”, or not tapering at all. Why?
The answer is: the ECB will continue to conduct net asset purchases under the Pandemic Emergency Purchase Programme with an unchanged total envelope of €1,850 billion. So, the total number of assets bought under this program won’t necessarily change, as the ECB could still spend all of the envelope. Only the pace will slow down, but please remember that it was boosted earlier this year. Hence, even Christine Lagarde admitted during her press conference that the ECB’s move was rather a “re-calibration of PEPP for next three months” than tapering.
What’s more, the net purchases under the Asset Purchase Programme, the original quantitative easing program, will continue at an unchanged pace of €20 billion per month. Last but not least, the ECB left its interest rates unchanged. And it reiterated that it was not going to normalize interest rates anytime soon, even in the face of strong price pressure. In other words, the ECB signaled once again that it would tolerate higher inflation:
In support of its symmetric two percent inflation target and in line with its monetary policy strategy, the Governing Council expects the key ECB interest rates to remain at their present or lower levels until it sees inflation reaching two percent well ahead of the end of its projection horizon and durably for the rest of the projection horizon, and it judges that realized progress in underlying inflation is sufficiently advanced to be consistent with inflation stabilizing at two percent over the medium term. This may also imply a transitory period in which inflation is moderately above target.
Implications for Gold
What does the ECB’s last meeting imply for gold? Well, although Lagarde and her colleagues didn’t signal any further reduction of monetary accommodation, the slowdown in asset purchases under PEPP is a small step toward normalizing the monetary policy after the pandemic. Additionally, please note that the ECB’s September economic projections boosted both the expected pace of the GDP growth and inflation in the coming years, which should provide the bank more room for hawkish actions. In this context, the ECB could be seen as a shy harbinger of the withdrawal of emergency measures introduced during the epidemic. This is probably why the euro has strengthened slightly after the ECB meeting.
However, the ECB remained very dovish in fact. It will just reduce the pace of asset purchases under PEPP, which was boosted earlier this year. And the European central bankers didn’t provide any timeline, nor any clues about the possible end of its quantitative easing programs. The Fed will also likely maintain its very accommodative stance, especially given the spread of the Delta variant of the coronavirus and the disappointing August nonfarm payrolls.
Having said that, the recent comments from the Fed officials suggest that they are determined to start or at least announce tapering by the end of the year. For instance, St. Louis Fed President James Bullard said in an interview that “The big picture is that the taper will get going this year and will end sometime by the first half of next year”.
Hence, the big picture for gold remains rather negative, as the prospects of the Fed’s tightening cycle could still exert downward pressure on gold. However, the actual beginning of the process, especially if accompanied by more dovish signals from the Fed than expected, could provide some relief for the yellow metal, in line with “sell the rumor, buy the fact”. My intuition is that 2022 may actually be better for gold than this year, but a lot will depend on the future economic developments, as well as the US central banks’ actions and communication. This week we will get fresh CPI data, and the FOMC will gather next week. Stay tuned!
If you enjoyed today’s free gold report, we invite you to check out our premium services. We provide much more detailed fundamental analyses of the gold market in our monthly Gold Market Overview reports, and we provide daily Gold & Silver Trading Alerts with clear buy and sell signals. To enjoy our gold analyses in their full scope, we invite you to subscribe today. If you’re not ready to subscribe yet, and you are not on our gold mailing list yet, we urge you to sign up there as well for daily yellow metal updates. Sign up now!
Arkadiusz Sieron, PhD
Sunshine Profits: Analysis. Care. Profits.-----
Disclaimer: Please note that the aim of the above analysis is to discuss the likely long-term impact of the featured phenomenon on the price of gold and this analysis does not indicate (nor does it aim to do so) whether gold is likely to move higher or lower in the short- or medium term. In order to determine the latter, many additional factors need to be considered (i.e. sentiment, chart patterns, cycles, indicators, ratios, self-similar patterns and more) and we are taking them into account (and discussing the short- and medium-term outlook) in our Gold & Silver Trading Alerts.
-
Gold Back Below $1,800!
September 9, 2021, 10:06 AMEasy come, easy go. The yellow metal rallied on Friday just to plunge on Tuesday. What’s your next move, Mr. Gold?
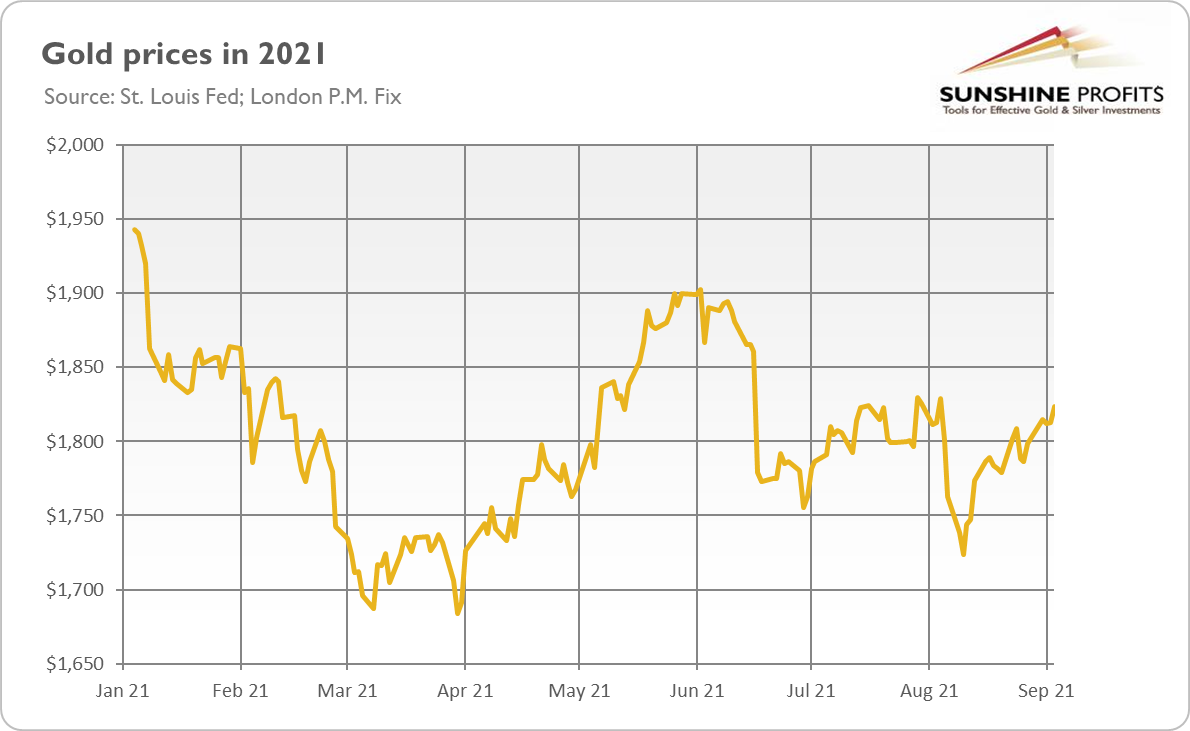
Ugh, the recent rally in gold prices was really short-lived. As the chart below shows, the price of gold increased after the publication of disappointing nonfarm payrolls on Friday. However, it declined as soon as on Tuesday, and on Wednesday it slid below $1,800.
I have to admit that I expected a more bullish performance. To be clear: I was far from opening champagne. For instance, I pointed out that the tapering of quantitative easing remained on the horizon, and I expressed some worries that gold’s rally was rather moderate despite the big disappointment of job gains:
Another caveat is that gold failed to rally above $1,835 despite softened expectations of the future path of the federal funds rate
However, I thought that the likely postponement of the Fed’s tightening cycle in the face of weak employment data would allow gold to catch its breath for a while. Well, it did, but only for a few days.
The quick reversal is clearly bearish for gold. Sure, without disappointing job numbers, the yellow metal could perform even worse. However, the inability to maintain gains indicates gold’s inherent weakness in the current environment.
Of course, the recent decline in gold prices was at least partially caused by new developments in the financial markets, namely: the strengthening in the US dollar and the rise in the bond yields. So, one could say that earlier bullish news was simply outweighed by later bearish factors.
However, please note that the US dollar strengthened and the interest rates rose amid an increase in risk aversion. The fact that gold, which is considered to be a safe-haven asset, drops when investors become more risk-averse, is really frustrating.
What’s more, some analysts pointed out that the dollar strength and higher yields were not enough to account for the plunge in gold prices – so, it seems that the momentum is simply negative and gold wants trade lower, no matter the fundamentals.
Indeed, neither the negative real interest rates, nor curbed dollar, nor high inflation were able to get gold to rise decisively this year. Nor the recent weak nonfarm payrolls that lifted the expectations of a more dovish Fed and the postponement of normalization of the monetary policy.
Implications for Gold
What does it all mean for the yellow metal? Well, the recent volatility in the gold market reminds us that in fundamental analyses it’s smart not to draw too far-reaching conclusions from the immediate price reactions and to look beyond the hustle and bustle of the trading pits. It also confirms that I was right, writing in the recent Fundamental Gold Report that “a long quiet summer has ended, and a more windy fall has started”.
Now, I have to point out that fundamental factors turned out in recent days to be more positive for the gold market than a few weeks ago. The announcement of the Fed’s tapering will be likely postponed from September to November 2021. Indeed, yesterday’s remarks of the New York Fed President John Williams at St. Lawrence University suggest that the FOMC may continue its wait-and-see approach this month and taper later in 2021:
There has also been very good progress toward maximum employment, but I will want to see more improvement before I am ready to declare the test of substantial further progress being met. Assuming the economy continues to improve as I anticipate, it could be appropriate to start reducing the pace of asset purchases this year.
Meanwhile, the economic activity has slowed down, partially because of the spread of the Delta variant of the coronavirus. For example, the recent edition of the Beige Book says that:
Economic growth downshifted slightly to a moderate pace in early July through August (…) The deceleration in economic activity was largely attributable to a pullback in dining out, travel, and tourism in most Districts, reflecting safety concerns due to the rise of the Delta variant, and, in a few cases, international travel restrictions.
Given that inflation remains high, the slowdown in economic growth will push the economy into stagflation, which should be a positive macroeconomic environment for gold.
Having said that, more bullish fundamentals without positive momentum could not be enough. As I’ve written earlier, gold has recently shrugged all the bullish factors off – it’s focused now on the economic normalization after the pandemic recession and the upcoming Fed’s tightening cycle. So, it seems to me that gold needs more than the postponement of tapering (think about next economic crises, the decline in economic confidence, or the abandonment of monetary policy normalization) to rally decisively. Until this happens, it is likely to continue its struggle.
If you enjoyed today’s free gold report, we invite you to check out our premium services. We provide much more detailed fundamental analyses of the gold market in our monthly Gold Market Overview reports, and we provide daily Gold & Silver Trading Alerts with clear buy and sell signals. To enjoy our gold analyses in their full scope, we invite you to subscribe today. If you’re not ready to subscribe yet, and you are not on our gold mailing list yet, we urge you to sign up there as well for daily yellow metal updates. Sign up now!
Arkadiusz Sieron, PhD
Sunshine Profits: Analysis. Care. Profits.-----
Disclaimer: Please note that the aim of the above analysis is to discuss the likely long-term impact of the featured phenomenon on the price of gold and this analysis does not indicate (nor does it aim to do so) whether gold is likely to move higher or lower in the short- or medium term. In order to determine the latter, many additional factors need to be considered (i.e. sentiment, chart patterns, cycles, indicators, ratios, self-similar patterns and more) and we are taking them into account (and discussing the short- and medium-term outlook) in our Gold & Silver Trading Alerts.
-
Weak August Payrolls: Why We Should Care
September 7, 2021, 4:10 AMA disappointing nonfarm payrolls report came. If the Fed postpones the tapering announcement considerably, gold might be able to rally for longer.
They say that September is a good time for gold. Indeed, historically, gold used to shine during the ninth month, and the yellow metal also started this year’s September on a good note. As the chart below shows, it jumped above $1,800 on the last day of August, and it has continued its rebound since then.
So, what happened? Well, on Friday, the newest report on the US labor market was revealed. The publication showed that the American economy added only 235,000 jobs in August, as one can see in the chart below. The number came much below expectations (of more than 700,000) and much below the impressive gains in July (above one million, after an upward revision). It was also the worst report since January 2021.
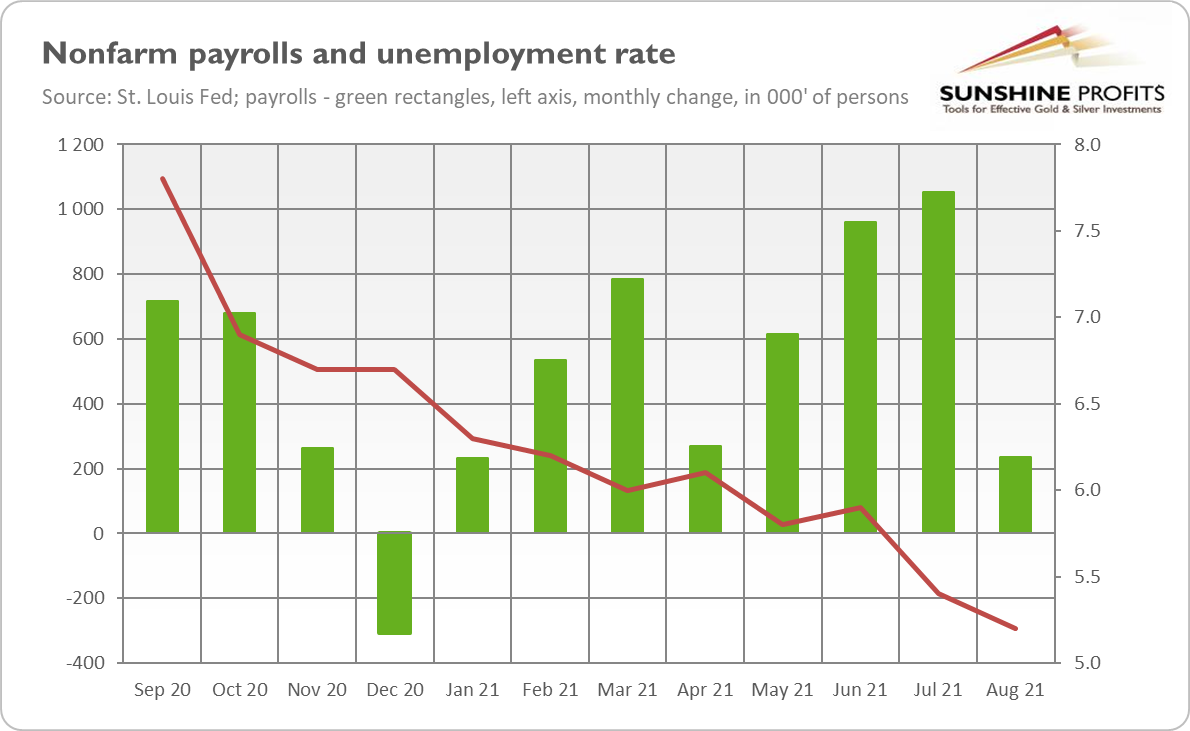
To be clear, the Bureau of Labor Statistics Employment Situation Report included some positive news as well. For instance, the unemployment rate declined from 5.4% to 5.2%, as the chart above shows. Additionally, it turned out that employment in June and July combined was 134,000 higher than previously reported. However, these strong revisions are not enough to outweigh the disappointing nonfarm payrolls.
Implications for Gold
What does the fresh report on the US job market imply for the gold market? Well, the slowdown in employment growth lowers the odds that the FOMC will announce the timeline of its tightening cycle this month. Before the employment report was published, many analysts bet that the Fed would present a plan of tapering of its asset purchases as early as at the September meeting. Now it’s not so clear, as it seems that the spread of the Delta variant of the coronavirus weighs on the economic activity. And, as a reminder, the Fed focuses now more on its employment mandate rather than the price stability. Weak payrolls mean that the shortfall from full employment will be eliminated later than previously anticipated.
It goes without saying that a more dovish Fed is positive for gold prices, as the postponement of normalization of the US monetary policy provides relief for the yellow metal. The prospects of the tightening cycle were creating downward pressure on gold earlier this year.
Another hidden positive factor for the gold market is the stagflationary character of the recent employment report. You see, job growth slowed down while wage inflation accelerated. According to the BLS, wages jumped 0.6% in August, up from a 0.4% increase in July. Indeed, we have inflation above 5%, while the economy is slowing down despite all the monetary and fiscal stimulus it got. It doesn’t sound good, does it? Given the size of monetary and fiscal injections, the economy should be booming, but it’s far from doing so. Well, prices are booming, but the economic activity is far from being spectacular right now.
The bottom line is that the August nonfarm payrolls might be, in a sense, a game-changer for the gold market. To be clear, the Fed won’t drop its plans to tighten monetary policy entirely (especially that August nonfarm number often disappoints initially), but it may postpone the beginning of tapering and reduce its asset purchases even more gradually than it was previously thought.
However, they can still announce tapering this year. Another caveat is that gold failed to rally above $1,835, despite the softened expectations of the future path of the federal funds rate. But it seems that gold bulls can enjoy the ride – at least for a while – until some hawkish comments from the Fed rattle markets again. One thing is sure: a long quiet summer has ended and a more windy fall has started. The upcoming FOMC minutes should provide some clues as to whether or not gold will face more headwinds or tailwinds later this year.
If you enjoyed today’s free gold report, we invite you to check out our premium services. We provide much more detailed fundamental analyses of the gold market in our monthly Gold Market Overview reports, and we provide daily Gold & Silver Trading Alerts with clear buy and sell signals. To enjoy our gold analyses in their full scope, we invite you to subscribe today. If you’re not ready to subscribe yet, and you are not on our gold mailing list yet, we urge you to sign up there as well for daily yellow metal updates. Sign up now!
Arkadiusz Sieron, PhD
Sunshine Profits: Analysis. Care. Profits.-----
Disclaimer: Please note that the aim of the above analysis is to discuss the likely long-term impact of the featured phenomenon on the price of gold and this analysis does not indicate (nor does it aim to do so) whether gold is likely to move higher or lower in the short- or medium term. In order to determine the latter, many additional factors need to be considered (i.e. sentiment, chart patterns, cycles, indicators, ratios, self-similar patterns and more) and we are taking them into account (and discussing the short- and medium-term outlook) in our Gold & Silver Trading Alerts.


Gold Reports
Free Limited Version
Sign up to our daily gold mailing list and get bonus
7 days of premium Gold Alerts!
Gold Alerts
More-
Status
New 2024 Lows in Miners, New Highs in The USD Index
January 17, 2024, 12:19 PM -
Status
Soaring USD is SO Unsurprising – And SO Full of Implications
January 16, 2024, 8:40 AM -
Status
Rare Opportunity in Rare Earth Minerals?
January 15, 2024, 2:06 PM

