

-
The Bank of Canada Ends QE, Plunging Gold Prices in CAD
October 28, 2021, 9:36 AMSo, QE ended (so far in Canada, but the Fed will follow suit) and the termination plunged gold prices in Canadian dollars. Will this repeat globally?
Finally! Yesterday (October 27, 2021), one central bank ended its quantitative easing program after gradually reducing the pace of asset purchases earlier this year. Don’t panic though - it wasn’t the Fed, nor the ECB, nor the Bank of Japan. It was the Bank of Canada. As we can read in the monetary policy statement:
In light of the progress made in the economic recovery, the Governing Council has decided to end quantitative easing and keep its overall holdings of Government of Canada bonds roughly constant.
Of course, the central bank didn’t say a word about a reduction of the size of its balance sheet. This is how the dovish bias works: central banks never return to the pre-crisis levels of interest rates or balance sheet. Anyway, I would like to focus on the fact that the central bank of Canada admitted that it underestimated the persistence of inflation, which could remain elevated next year:
The recent increase in CPI inflation was anticipated in July, but the main forces pushing up prices – higher energy prices and pandemic-related supply bottlenecks – now appear to be stronger and more persistent than expected.
More persistent and higher inflation implies sooner monetary policy tightening. The BoC signaled that it could hike its main policy interest rate in mid-2022:
We remain committed to holding the policy interest rate at the effective lower bound until economic slack is absorbed so that the 2% inflation target is sustainably achieved. In the Bank’s projection, this happens sometime in the middle quarters of 2022.
The direct consequences of the Bank of Canada ending QE should be limited, as the BoC’s actions are not too meaningful for the global financial markets. However, yesterday’s decision is emblematic of the current shift among central banks from monetary easing into monetary tightening. Investors should be thus prepared for more persistent inflation and for a hawkish response of central banks.
Interestingly, while the BoC has just completed its asset purchases program, the Fed is only going to start tapering its own quantitative easing program. It means that the US central bank is tardy and behind the curve (especially that inflation in Canada is lower than across the border). So, its reaction will have to be stronger in the future. The market expects the first hike in the federal funds rate to happen in June 2022, so also in the middle quarters of 2022, despite the Fed’s one-year lag behind the Bank of Canada.
Gold may struggle until the Fed’s tightening cycle starts. You have been warned!
Implications for Gold
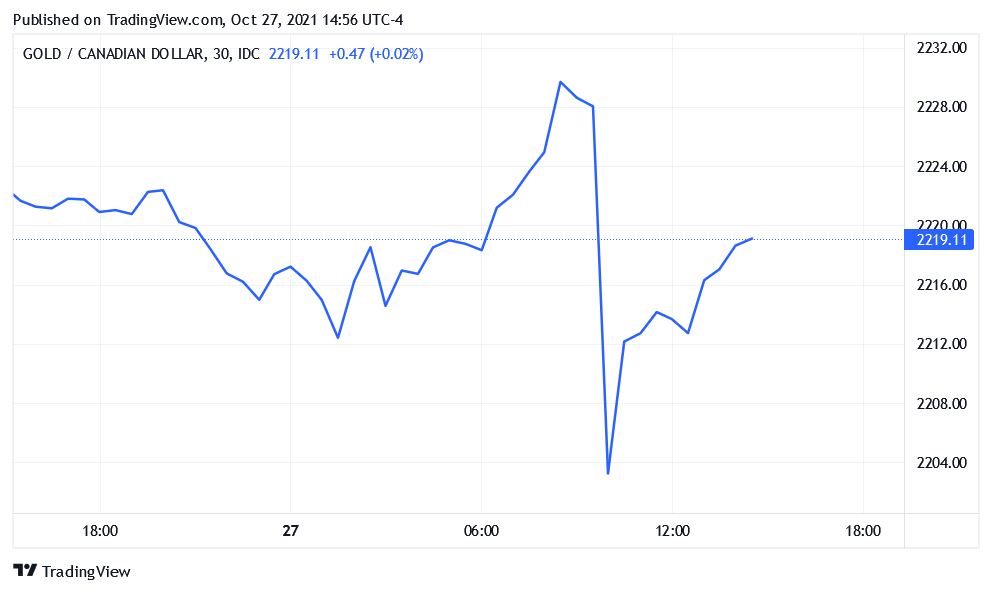
What does the end of Canadian quantitative easing imply for the gold market? Well, the direct impact on gold prices denominated in greenbacks should be minimal. However, the decision to stop QE exerted a huge impact on the price of gold denominated in the Canadian dollar. As the chart below shows, the price plunged yesterday from about 2228 CAD to C$2204 CAD within minutes.
This drop may be a harbinger of what may happen in the international gold market when the Fed tightens its own monetary policy. Of course, the announcement of tapering at the November FOMC meeting is widely expected. However, please remember that the message of tapering could be accompanied by other hawkish signals as well. So, although gold has been moving upward recently (see the chart below), its struggles could continue for a while.
The silver lining is that the drop in the gold price in CAD – although abrupt – wasn’t too deep overall and reversed quickly. To be clear, a 1% drop is relatively large, but it’s not a total disaster, especially given the prominence of the event. It seems that inflation worries currently provide support for gold prices.
If you enjoyed today’s free gold report, we invite you to check out our premium services. We provide much more detailed fundamental analyses of the gold market in our monthly Gold Market Overview reports, and we provide daily Gold & Silver Trading Alerts with clear buy and sell signals. To enjoy our gold analyses in their full scope, we invite you to subscribe today. If you’re not ready to subscribe yet, and you are not on our gold mailing list yet, we urge you to sign up there as well for daily yellow metal updates. Sign up now!
Arkadiusz Sieron, PhD
Sunshine Profits: Analysis. Care. Profits.-----
Disclaimer: Please note that the aim of the above analysis is to discuss the likely long-term impact of the featured phenomenon on the price of gold and this analysis does not indicate (nor does it aim to do so) whether gold is likely to move higher or lower in the short- or medium term. In order to determine the latter, many additional factors need to be considered (i.e. sentiment, chart patterns, cycles, indicators, ratios, self-similar patterns and more) and we are taking them into account (and discussing the short- and medium-term outlook) in our Gold & Silver Trading Alerts.
-
Powell Once Again Proved to Be Gold’s Joy Destroyer
October 26, 2021, 9:15 AMInflation worries have intensified, gold started to rally on Friday… and then Powell came, ruining the party and killing the bullish vibe.
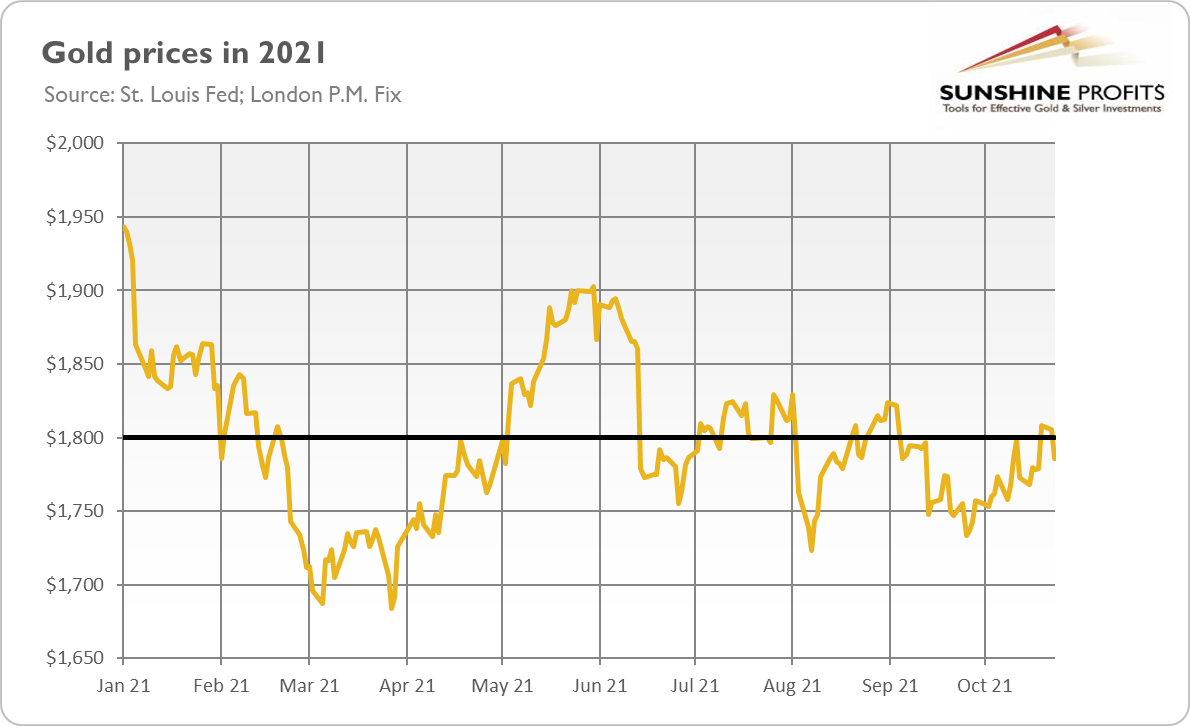
Friday (October 22, 2021) started wonderfully for the yellow metal. Gold was appreciating since early morning, and it even jumped above $1,810 around 10-11 A.M. New York Time. As the chart below shows, the London P.M. Fix was above $1,800, the key psychological level under which gold has been stuck recently.
Unfortunately, the joy was short-lived. Gold dived again below $1,800 later on Friday. What was the reason? Well, it might be just inherent weakness and inability to overcome its resistance level. But it seems that Jerome Powell contributed to the drop, if not triggered it.
He participated in an online conference hosted by the South African Reserve Bank on Friday, making remarks that were considered hawkish. What did Powell say? Well, he reiterated that the Fed is on track to start tapering its asset purchases this year and that the whole process is expected to end by mid-2022.
However, Powell downplayed the inflation threat. Even though he acknowledged that risks were growing and that “elevated inflation [is] likely to last longer than previously expected and well into next year”, he also said that supply-chain issues would eventually be resolved and inflation would fall back to the Fed’s target of 2%. As a consequence of Powell’s remarks, the price of gold declined roughly $30, from almost $1,815 to $1,785. The yellow metal rebounded slightly later, but it was unable to return to $1,800.
Implications for Gold
What is happening in the gold market right now? Well, it seems that inflation worries have intensified recently, and gold started to grow (a bit timidly, but still) on those fears. Unfortunately for gold bulls, Powell threw cold water on gold’s rally on Friday. After all, the upcoming tapering of quantitative easing, as well as the cycle of interest rate hikes, could continue to create downward pressure on gold.
On the other hand, Powell also made some dovish comments, as he emphasized that the Fed was going to taper its asset purchases soon, but it wouldn’t raise the federal funds rate until the maximum employment was reached. He said: “I do think it’s time to taper; I don’t think it’s time to raise rates”.
What is even more important, Mr. Market has finally awakened from the dream about a world without inflation. In other words, investors started to question the Fed’s narrative about the ‘merely transitory’ price pressure. Given that the economic growth is going to slow down, the risk of stagflation is growing, which should support gold. Please take a look at the chart below.
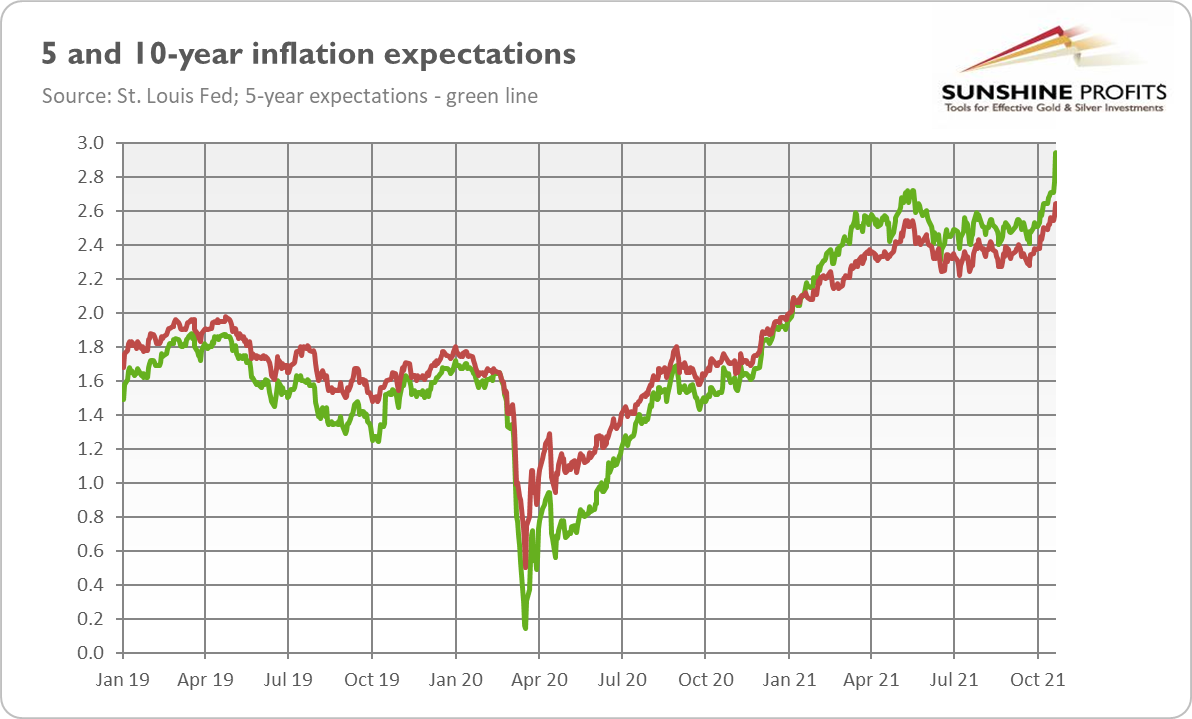
As one can see, the market-based inflation expectations rose significantly last week. The inflation breakeven rates in the 10-year bonds increased from 2.54% to 2.64%, while in 5-year bonds they jumped from 2.71% to 2.94%, the highest level since March 2005. It means that the markets expect more persistent inflation than the Fed and bet that the US central bank will stay behind the curve.
We can call it “the revenge of the supply”. Policymakers have been focused for years on the demand side of the economy, just to discover that the supply side matters too. Right now, companies all over the world are facing supply-chain bottlenecks, shortage of workers, energy crisis, transportation crisis, and semiconductors squeeze. Thus, many of them are now passing higher costs on (in the form of higher prices) to consumers, indicating even more increases down the road.
The bottom line is that rising inflationary expectations are fundamentally positive for gold prices. So far, inflationary worries have been counterweighted by the expectations of the Fed’s tightening cycle and economic recovery. However, the growth is going to slow down, while the date of the first hike is approaching quickly. Therefore, gold’s outlook should improve in the coming months.
If you enjoyed today’s free gold report, we invite you to check out our premium services. We provide much more detailed fundamental analyses of the gold market in our monthly Gold Market Overview reports, and we provide daily Gold & Silver Trading Alerts with clear buy and sell signals. To enjoy our gold analyses in their full scope, we invite you to subscribe today. If you’re not ready to subscribe yet, and you are not on our gold mailing list yet, we urge you to sign up there as well for daily yellow metal updates. Sign up now!
Arkadiusz Sieron, PhD
Sunshine Profits: Analysis. Care. Profits.-----
Disclaimer: Please note that the aim of the above analysis is to discuss the likely long-term impact of the featured phenomenon on the price of gold and this analysis does not indicate (nor does it aim to do so) whether gold is likely to move higher or lower in the short- or medium term. In order to determine the latter, many additional factors need to be considered (i.e. sentiment, chart patterns, cycles, indicators, ratios, self-similar patterns and more) and we are taking them into account (and discussing the short- and medium-term outlook) in our Gold & Silver Trading Alerts.
-
To Be or Not to Be: How the Evergrande Crisis Can Affect Gold
October 21, 2021, 8:44 AMEvergrande is on the brink of bankruptcy. Will gold prices collapse together with the real estate developer or benefit from its default?
Generals are always prepared to fight the last war, while economists are always prepared to fight the last recession. But what if the next economic crisis doesn’t start in the US financial sector, but in China’s real estate?
Naturally, I refer to Evergrande, a Chinese developer with total liabilities of more than $300 billion — around 2% of China’s GDP! A default of one of China’s largest and most indebted companies could entail significant repercussions for the global economy.
Although the Evergrande crisis won’t necessarily be China’s Lehman Brothers moment (I will elaborate on this in the upcoming edition of the Gold Market Overview), it will certainly curb China’s economic growth. Actually, the slowdown has already begun, as the country’s GDP grew just 4.9% in the third quarter of 2021, much less than the 7.9% seen in Q2. It was the slowest pace recorded in a year.
The slowdown is not surprising. After all, China faces a massive energy crunch, shipping disruptions, and a burst of the property bubble. Until recently, the bubble was tolerated or even actively boosted as it drove income and growth, benefiting everyone: developers, authorities, and also ordinary citizens who placed most of their savings in real estate. The property sector has grown so much that it accounts for about 30% of China’s GDP! So, given the size of China’s economy, it has become one of the most important sectors in the world.
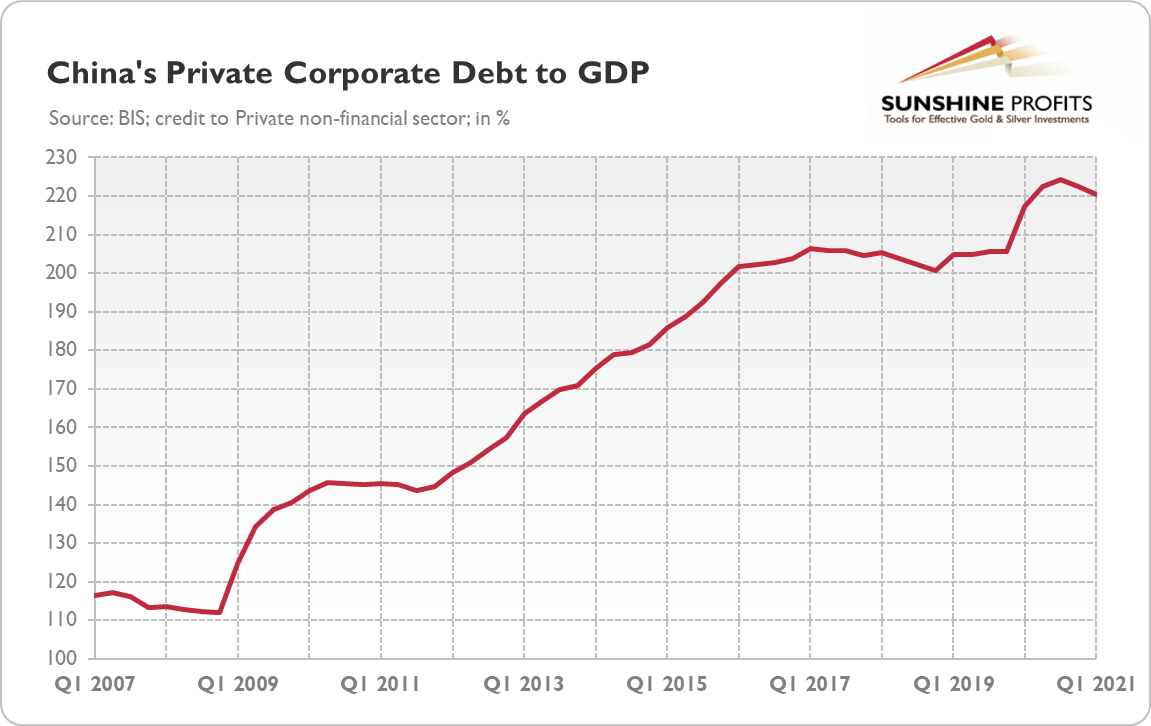
However, China’s government decided to curb excessive borrowing and deflate the bubble. Perhaps the irrational exuberance became too irrational – just think about all these ghost towns with millions of empty apartments, not to mention the surge in corporate debt from 112% of GDP in 2008 to 222% in 2020 (see the chart below). So, last year, China’s government introduced the policy of “three red lines” which made it much more difficult for large developers such as Evergrande to issue more debt. This tightening caused a liquidity crisis, as well as a drop in property investment by 4% in September.
Here is the problem: the government wants to move away from a growth model based on investment and debt, but the country hasn’t transitioned to a consumption-led model yet. Thus, given the size of China’s property sector and a lack of new growth engines, we should expect a further slowdown in China’s (and global) economic growth.
Implications for Gold
What do China’s economic problems imply for the gold market? Well, the price of gold hasn’t been affected by the Evergrande crisis so far, remaining stuck below $1,800. Although, please remember that gold is most sensitive to the US economy, and we haven’t seen any signs of contagion spilling over the Chinese borders yet. However, the slowdown in global economic growth caused by the burst of China’s real estate bubble should bring us closer to the stagflationatory scenario, which should be positive for gold prices. The deceleration in China’s economic growth could abruptly change the narrative about a solid recovery from the pandemic, making investors worry more about inflation. A slowdown in economic growth could also lower bond yields, which should be supportive for the yellow metal.
Furthermore, even though most of the pundits downplay the risk of financial contagion stemming from the collapse of Evergrande (or other Chinese real estate developers), such a risk exists. If it materializes, gold should shine as a safe-haven asset.
Another possible implication is that China might devalue the yuan again. As investments are weakening and consumption hasn’t become a sufficient driver of the economy, the government could bet on exports to support the GDP growth. This could trigger some safe-haven inflows into gold, but there are also some risks here. As I wrote in 2017, “in the summer of 2015, China devalued the yuan, which pushed global equities lower. Hence, a devaluation of the renminbi would imply an appreciation of the U.S. dollar, which does not sound good for the gold market.”
If you enjoyed today’s free gold report, we invite you to check out our premium services. We provide much more detailed fundamental analyses of the gold market in our monthly Gold Market Overview reports, and we provide daily Gold & Silver Trading Alerts with clear buy and sell signals. To enjoy our gold analyses in their full scope, we invite you to subscribe today. If you’re not ready to subscribe yet, and you are not on our gold mailing list yet, we urge you to sign up there as well for daily yellow metal updates. Sign up now!
Arkadiusz Sieron, PhD
Sunshine Profits: Analysis. Care. Profits.-----
Disclaimer: Please note that the aim of the above analysis is to discuss the likely long-term impact of the featured phenomenon on the price of gold and this analysis does not indicate (nor does it aim to do so) whether gold is likely to move higher or lower in the short- or medium term. In order to determine the latter, many additional factors need to be considered (i.e. sentiment, chart patterns, cycles, indicators, ratios, self-similar patterns and more) and we are taking them into account (and discussing the short- and medium-term outlook) in our Gold & Silver Trading Alerts.
-
Inflation Advances, and So Does Gold — Except That It Doesn’t
October 19, 2021, 8:25 AMInflation accelerated again in September, and gold prices (finally!) reacted positively. Bad news: the rally was short-lived.
Unfortunately, I was right. One month ago, when commenting on the CPI readings for August, I wrote that inflation “doesn’t have to go away anytime soon” and that the economic developments suggest that “inflation isn’t disappearing just yet.” And here we are, one month later, with inflation accelerating again.
Indeed, the latest BLS report on inflation shows that the CPI rose 0.4% in September after increasing 0.3% in August. The core CPI, which excludes food and energy prices, also accelerated to 0.2% in September from 0.1% in the preceding month.
On an annual basis, inflation has also accelerated a bit, as the chart below shows. The overall index soared 5.4% in September, following 5.2% in the previous month (numbers seasonally adjusted). It was the biggest surge since July 2008 – and that was in the midst of the Great Recession. Meanwhile, the core CPI edged up from 3.98% to 4.04%.
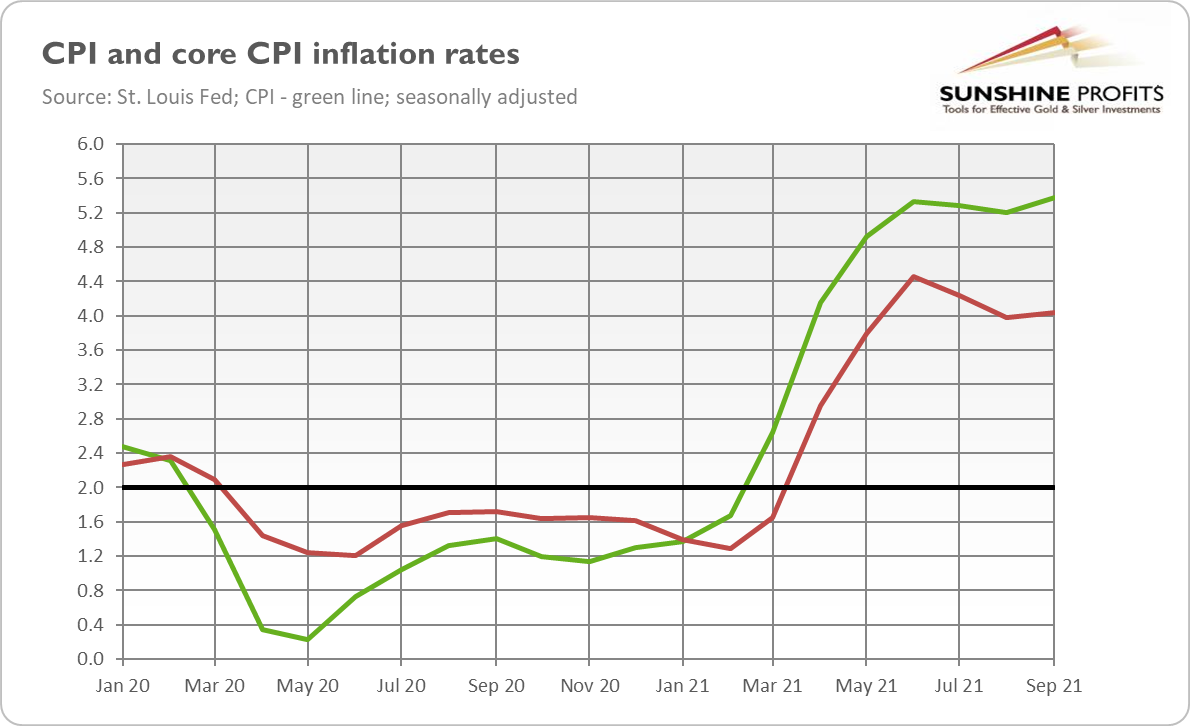
So, inflation is not transitory. On the contrary, the chart above shows that the June overall CPI reading functioned as a peak only temporarily. The fact that inflation rebounded to a new high is a final blow to the ‘transitory inflation’ narrative. Therefore, my warnings that inflation doesn’t have to go away anytime soon remain valid.
Actually, my arguments have been strengthened by the recent data. Why? Well, inflation intensified despite the fact that several subindexes declined in September. As we can read in the BLS report:
The index for airline fares continued to fall sharply, decreasing 6.4 percent over the month after falling 9.1 percent in August. The apparel index also decreased in September, declining 1.1 percent over the month after rising 0.4 percent in the previous month. The index for used cars and trucks fell 0.7 percent this month, continuing to decline after it decreased 1.5 percent in August.
So, why didn’t inflation decrease? After all, the mainstream narrative was that inflation was caused by a few categories strongly linked to the pandemic and the reopening that followed. Well, here we are; these categories fell, but inflation rose. The answer to this puzzle is: the Fed officials and the pundits were wrong. Inflation is not limited to just a few categories because of the supply-chain disruptions, it’s a broad-based phenomenon caused by the increase in the broad money supply and in the monetary demand.
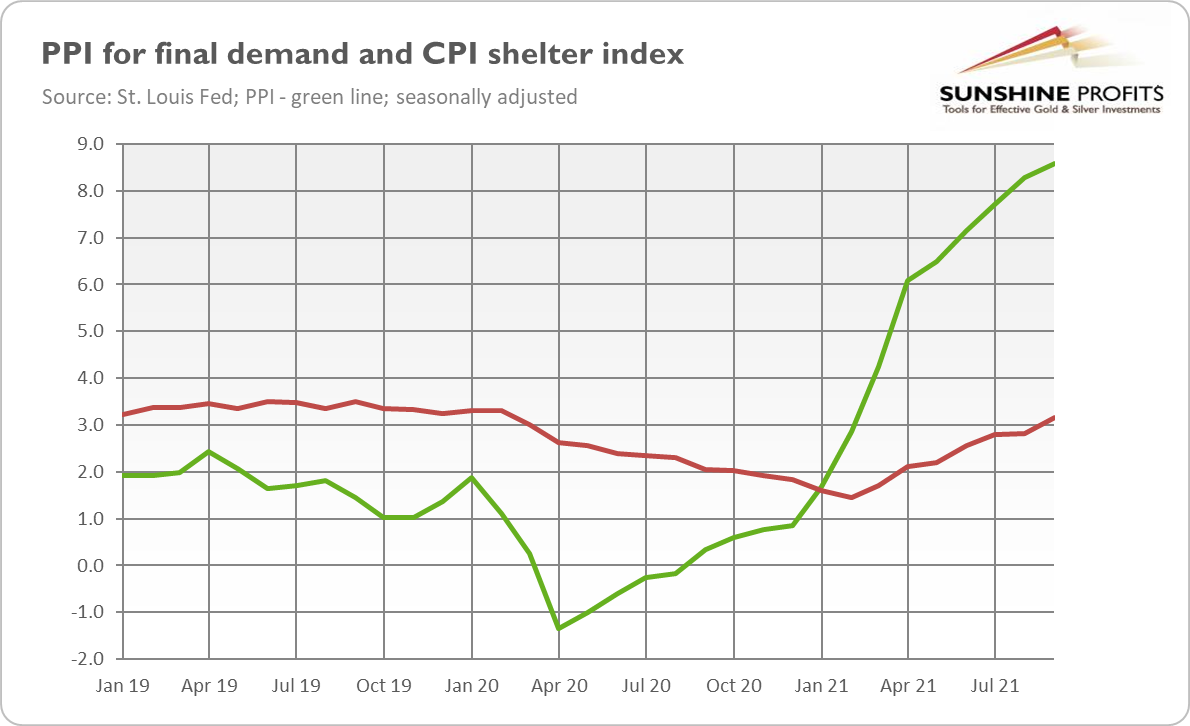
More specifically, the declines in some subindexes were counterweighted by increases in others, in particular by the significant acceleration in the shelter index. As one can see in the chart below, the shelter index jumped 3.2% in September, much faster than the 2.8% observed in August.
This acceleration is perfectly in line with my analyses. In September, I wrote:
Secondly, the index for shelter – the biggest component of the CPI – has been rising gradually since February 2021, and it accelerated from 2.79% in July to 2.82% in August (…) As a reminder, home prices – which are not covered by the CPI – have been surging recently, which should translate into further increases in the index for shelter.
Oh boy, I hate to be right! However, I’m afraid that consumer inflation could increase even further in the near future. Careful examination of the money supply growth implies that the real peak in inflation might occur in Q1 2022. Given the upward trend in home prices, the shelter index could continue its upward march. Last but not least, the surging Producer Price Index (see the chart above) might also add to the inflationary pressure.
Implications for Gold
What does the September report on CPI imply for the gold market? Well, the theory remains the same: high inflation should be positive for gold, as it is considered an inflation hedge. Higher inflation also means lower real interest rates and a weaker greenback, which should support gold prices. However, elevated inflation wasn’t supportive for the yellow metal so far, as it strengthened the expectations of the Fed’s tightening cycle, creating downward pressure on gold prices.
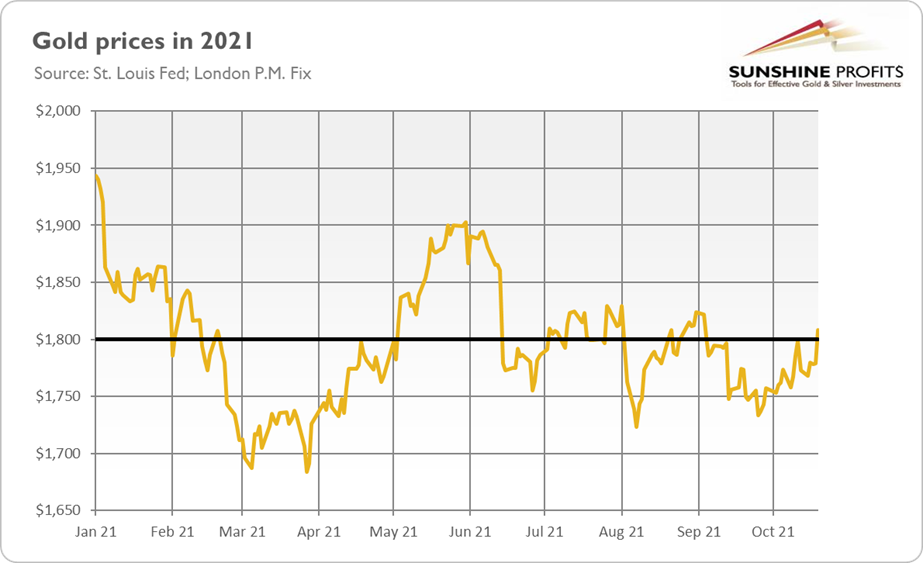
All in all, the September report (which showed continuously rising inflationary pressure) made investors rethink the Fed’s transitory argument. These worries pushed gold prices to their resistance level of $1,800 on Thursday, as the chart below shows.
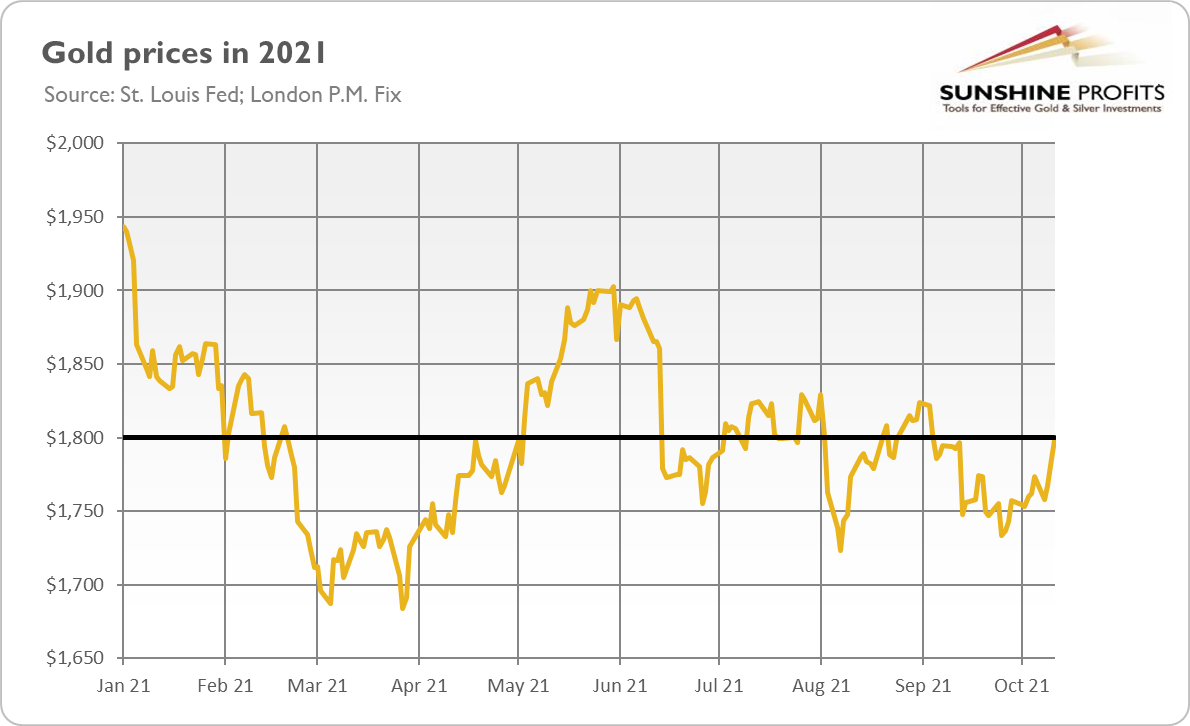
Unfortunately for the gold bulls, any hopes of a more prolonged rally were quickly quenched, as the price of gold declined on Friday. So, it seems that until the Fed tapers its quantitative easing, gold will remain under downward pressure. Nonetheless, when it finally happens, better times may come for gold.
If you enjoyed today’s free gold report, we invite you to check out our premium services. We provide much more detailed fundamental analyses of the gold market in our monthly Gold Market Overview reports, and we provide daily Gold & Silver Trading Alerts with clear buy and sell signals. To enjoy our gold analyses in their full scope, we invite you to subscribe today. If you’re not ready to subscribe yet, and you are not on our gold mailing list yet, we urge you to sign up there as well for daily yellow metal updates. Sign up now!
Arkadiusz Sieron, PhD
Sunshine Profits: Analysis. Care. Profits.-----
Disclaimer: Please note that the aim of the above analysis is to discuss the likely long-term impact of the featured phenomenon on the price of gold and this analysis does not indicate (nor does it aim to do so) whether gold is likely to move higher or lower in the short- or medium term. In order to determine the latter, many additional factors need to be considered (i.e. sentiment, chart patterns, cycles, indicators, ratios, self-similar patterns and more) and we are taking them into account (and discussing the short- and medium-term outlook) in our Gold & Silver Trading Alerts.
-
Gold Jumps Despite Hawkish FOMC Minutes
October 14, 2021, 10:21 AMThe September FOMC minutes were rather hawkish, but gold prices rose yesterday. Did higher inflation finally push the yellow metal up?
Yesterday (October 13, 2021), the FOMC published minutes from its last meeting in September. For me, the publication is rather hawkish, as it signaled that the Fed could begin tapering its asset purchases as soon as mid-November or mid-December.
Participants noted that if a decision to begin tapering purchases occurred at the next meeting, the process of tapering could commence with the monthly purchase calendars beginning in either mid-November or mid-December.
This is because the FOMC members decided that the “substantial further progress” toward the Committee’s price-stability and maximum-employment goals has almost been met:
Many participants noted that although the economic recovery had slowed recently and the August increase in payrolls had fallen short of expectations, the labor market had continued to show improvement since the Committee’s previous meeting. A number of participants assessed that the standard of substantial further progress toward the goal of maximum employment had not yet been attained but that, if the economy proceeded roughly as they anticipated, it may soon be reached. On the basis of the cumulative performance of the labor market since December 2020, a number of other participants indicated that they believed that the test of “substantial further progress” toward maximum employment had been met.
The disappointing September nonfarm payrolls triggered some doubts about whether the Fed could announce tapering as soon as in November, but the recent comments from Atlanta Fed President Raphael Bostic and Fed Vice Chair Richard Clarida dispelled these doubts. The former official said: “I think that the progress has been made, and the sooner we get moving on that the better,” while the latter declared “I myself believe that the 'substantial further progress' standard has more than been met with regard to our price-stability mandate and has all but been met with regard to our employment mandate”. These remarks cement the expectations that the Fed’s tapering will start soon this year.
The Fed officials also discussed the pace of tapering, which they wouldn’t do if they weren’t convinced that the time was right to go ahead:
Participants also expressed their views on how slowing in the pace of purchases might proceed. In particular, participants commented on an illustrative path, developed by the staff and reflecting participants' discussions at the Committee's July meeting, that gave the speed and composition associated with a tapering of asset purchases (…) The path featured monthly reductions in the pace of asset purchases, by $10 billion in the case of Treasury securities and $5 billion in the case of agency mortgage-backed securities (MBS). Participants generally commented that the illustrative path provided a straightforward and appropriate template that policymakers might follow, and a couple of participants observed that giving advance notice to the general public of a plan along these lines may reduce the risk of an adverse market reaction to a moderation in asset purchases.
Given that the Fed continues to purchase Treasury securities by at least $80 billion per month and MBS by at least $40 billion per month, the signaled path of tapering implies that the quantitative easing is going to start in November 2021 and end in June 2022. Such a timeline pleases the Fed, as it will enable it to hike the federal funds rate if inflation turns out to be more persistent than initially thought:
No decision to proceed with a moderation of asset purchases was made at the meeting, but participants generally assessed that, provided that the economic recovery remained broadly on track, a gradual tapering process that concluded around the middle of next year would likely be appropriate.
Indeed, the FOMC members showed stronger worries about inflation, dropping references to the transitory character of inflation, and acknowledging that there were some upside risks:
Most participants saw inflation risks as weighted to the upside because of concerns that supply disruptions and labor shortages might last longer and might have larger or more persistent effects on prices and wages than they currently assumed.
Oh, really, inflation could last longer than you repeated for months?! You were wrong once again, what a surprise! What’s more, the committee also expressed concerns about the impact of easy monetary policy on elevated asset prices and financial stability:
In addition, some participants mentioned the risks associated with high asset valuations in the United States and abroad, and a number of participants commented on the importance of resolving the issues involving the federal government budget and debt ceiling in a timely manner (…)
Several participants expressed concern that the high degree of accommodation being provided by monetary policy, including through continued asset purchases, could increase risks to financial stability.
Indeed, it’s high time for reducing the monetary stimulus, given the scale of irrational exuberance in the financial markets (investors are now so desperate to seek yields that they even buy non-existent sculptures)!
Implications for Gold
What do the recent FOMC minutes imply for the gold market? Well, the publication is rather hawkish, so it should be negative for gold prices. At least in theory. But the price of gold increased yesterday, approaching almost $1,800. What happened?
The detailed analysis of yesterday’s price movement displayed on the chart below shows that the FOMC minutes didn’t affect the gold market in any meaningful manner. This is probably because this year’s tapering has already been reflected in gold prices. The yellow metal reacted significantly, but to something different: the September CPI report.
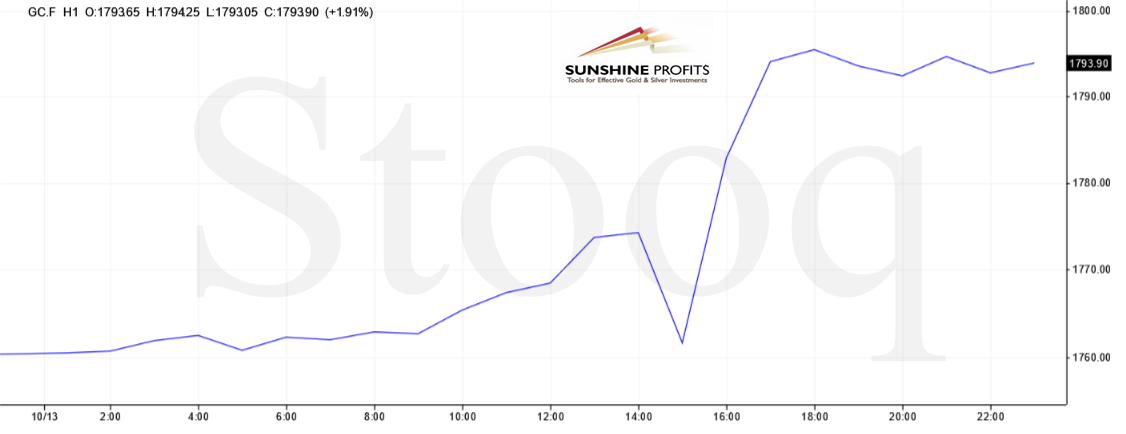
Inflation rose slightly last month from 5.3% to 5.4% year-over-year, according to the BLS (so, no, inflation is not going away, just as I was warning investors for months). The price of gold declined initially, only to gain later. It seems that, at first, investors decided that higher inflation equals higher interest rates and a more hawkish Fed, so they decided to push gold down (just as they used to in response to higher inflationary readings earlier this year). However, after a while, traders changed their minds. So, although it’s too early to conclude this with certainty, it’s possible that the markets finally started to fear inflation, its persistence, and its impact on economic growth. If this is the case, we could see more safe-haven inflows into gold.
Nonetheless, investors shouldn’t expect too much from one trading day, even though yesterday’s gold reaction gives some hope that the yellow metal will ultimately behave as an inflation-hedge and benefit from elevated inflation. We will see – gold has to jump above $1,800 first.
If you enjoyed today’s free gold report, we invite you to check out our premium services. We provide much more detailed fundamental analyses of the gold market in our monthly Gold Market Overview reports, and we provide daily Gold & Silver Trading Alerts with clear buy and sell signals. To enjoy our gold analyses in their full scope, we invite you to subscribe today. If you’re not ready to subscribe yet, and you are not on our gold mailing list yet, we urge you to sign up there as well for daily yellow metal updates. Sign up now!
Arkadiusz Sieron, PhD
Sunshine Profits: Analysis. Care. Profits.-----
Disclaimer: Please note that the aim of the above analysis is to discuss the likely long-term impact of the featured phenomenon on the price of gold and this analysis does not indicate (nor does it aim to do so) whether gold is likely to move higher or lower in the short- or medium term. In order to determine the latter, many additional factors need to be considered (i.e. sentiment, chart patterns, cycles, indicators, ratios, self-similar patterns and more) and we are taking them into account (and discussing the short- and medium-term outlook) in our Gold & Silver Trading Alerts.


Gold Reports
Free Limited Version
Sign up to our daily gold mailing list and get bonus
7 days of premium Gold Alerts!
Gold Alerts
More-
Status
New 2024 Lows in Miners, New Highs in The USD Index
January 17, 2024, 12:19 PM -
Status
Soaring USD is SO Unsurprising – And SO Full of Implications
January 16, 2024, 8:40 AM -
Status
Rare Opportunity in Rare Earth Minerals?
January 15, 2024, 2:06 PM

