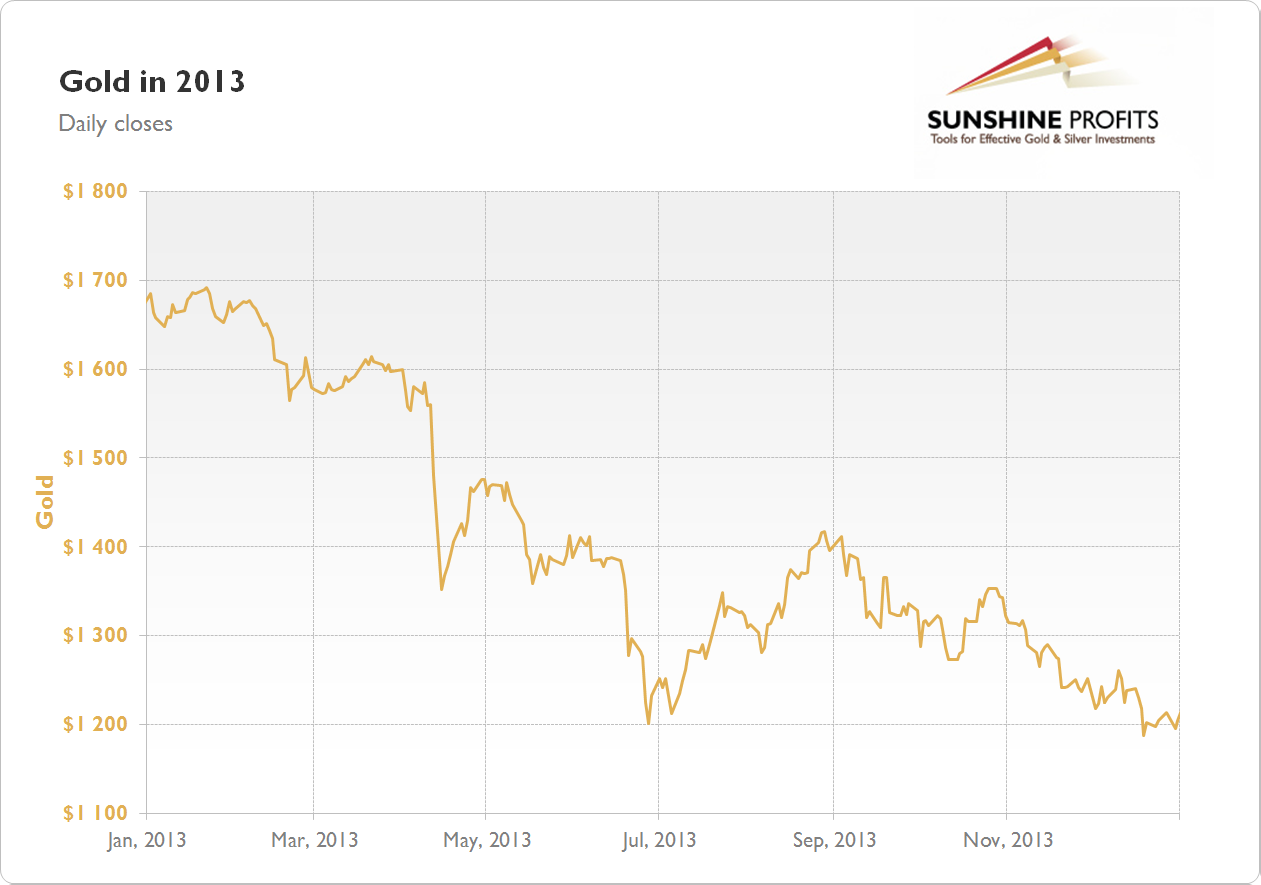
Gold Chart 2013

(clicking on the chart will expand it)
The gold price chart for 2013 shows that gold was declining in the first half of the year, before a rebound which took place in July-August. Gold reached a yearly low in late December. Overall, gold lost $469.20 (28.03%) in 2013. The yearly high was formed on January 22 at $1,691.40 and the yearly low was formed on December 19 at $1,187.10. The final close of the year was $1,204.80.
| Similiar charts | |
|---|---|
| Gold Chart 2014 | Gold Chart 2012 |
| Silver Chart 2013 | Gold Stock Chart 2013 |
Gold Alerts
More-
Status
New 2024 Lows in Miners, New Highs in The USD Index
January 17, 2024, 12:19 PM -
Status
Soaring USD is SO Unsurprising – And SO Full of Implications
January 16, 2024, 8:40 AM -
Status
Rare Opportunity in Rare Earth Minerals?
January 15, 2024, 2:06 PM
Recent
More- May 4, 2021, 6:54 AM Mushrooms in the Park?
- April 11, 2021, 12:24 PM Your Week In Brief
- March 12, 2021, 11:28 AM Dear Bill Gates, Please Stop Commenting about Bitcoin


