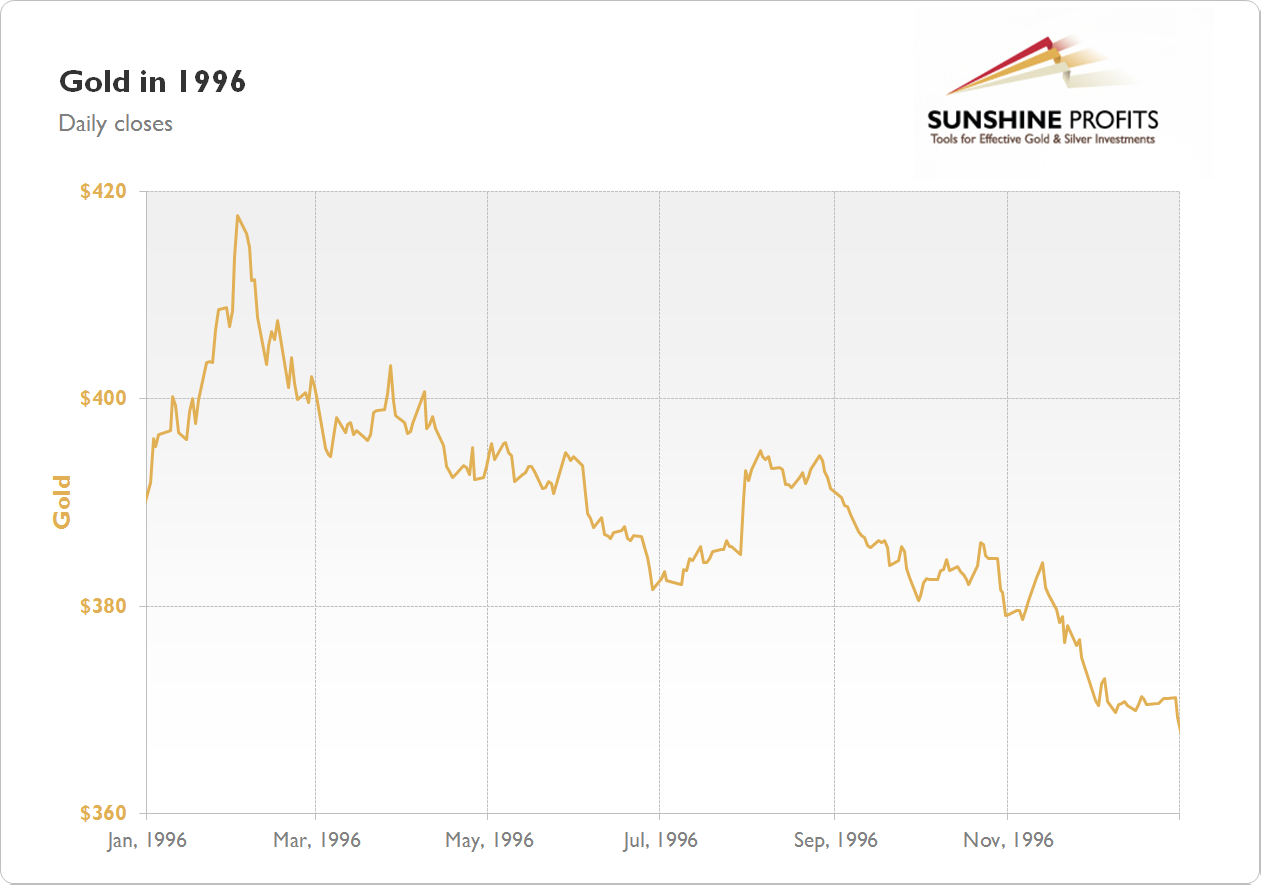
Gold Chart 1996

(clicking on the chart will expand it)
Gold price chart for 1996 shows that gold was gaining in the first month of the year. The yearly high was formed on February 2 at $417.70. Then, the price of gold was declining until the end of the year. The yearly low was formed on December 31 at $369.20. It was the final close of the year. Overall, gold lost $18.90 (4.87%) in 1996.
| Similiar charts | |
|---|---|
| Gold Chart 1997 | Gold Chart 1995 |
| Silver Chart 1996 | |
Gold Alerts
More-
Status
New 2024 Lows in Miners, New Highs in The USD Index
January 17, 2024, 12:19 PM -
Status
Soaring USD is SO Unsurprising – And SO Full of Implications
January 16, 2024, 8:40 AM -
Status
Rare Opportunity in Rare Earth Minerals?
January 15, 2024, 2:06 PM
Recent
More- May 4, 2021, 6:54 AM Mushrooms in the Park?
- April 11, 2021, 12:24 PM Your Week In Brief
- March 12, 2021, 11:28 AM Dear Bill Gates, Please Stop Commenting about Bitcoin


