

Briefly: in our opinion, full (250% of the regular size of the position) speculative short position in gold, silver, and mining stocks is justified from the risk/reward point of view at the moment of publishing this Alert.
Yesterday, we wrote that the Brexit saga continues with no clear and irreversible decisions and we can say exactly the same thing today. We also wrote that this didn't mean that we hadn't had any new signals. Actually, we did have them. And we can say the same thing today. The way silver soared, stopped and erased almost the entire daily gain only to close back below the declining resistance line - that is all very informative. Let's take a closer look.
Silver's Reversal
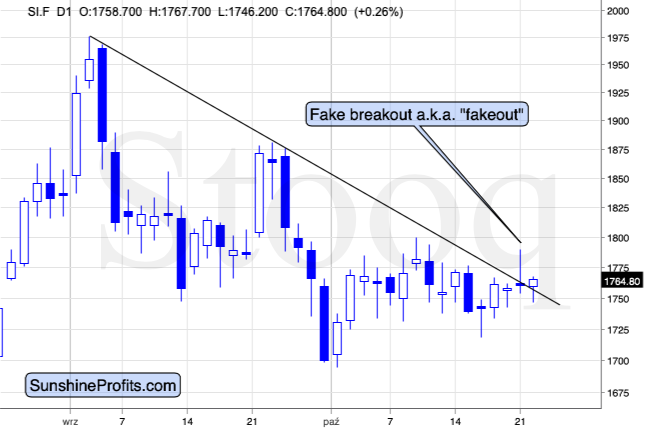
Silver seems to have broken above the declining resistance line, but all it really did was catching many silver bulls by surprise. As silver quite often does. Just look at the late-September rally. Seemed encouraging at that time but it was just another of the white metal's fake-outs. The invalidation of a breakout is a bearish phenomenon as it emphasizes how artificial and inconsequential the very recent "strength" was. This goes double for the silver market as it's known for this type of behavior. That's why silver's breakouts should be raising eyebrows instead of generating an immediate jump into the market with both feet. Especially, if neither gold, nor mining stocks confirm the move.
All in all, silver's yesterday's action has bearish implications for the short run.
That's far from the only interesting thing about the current silver price, though.
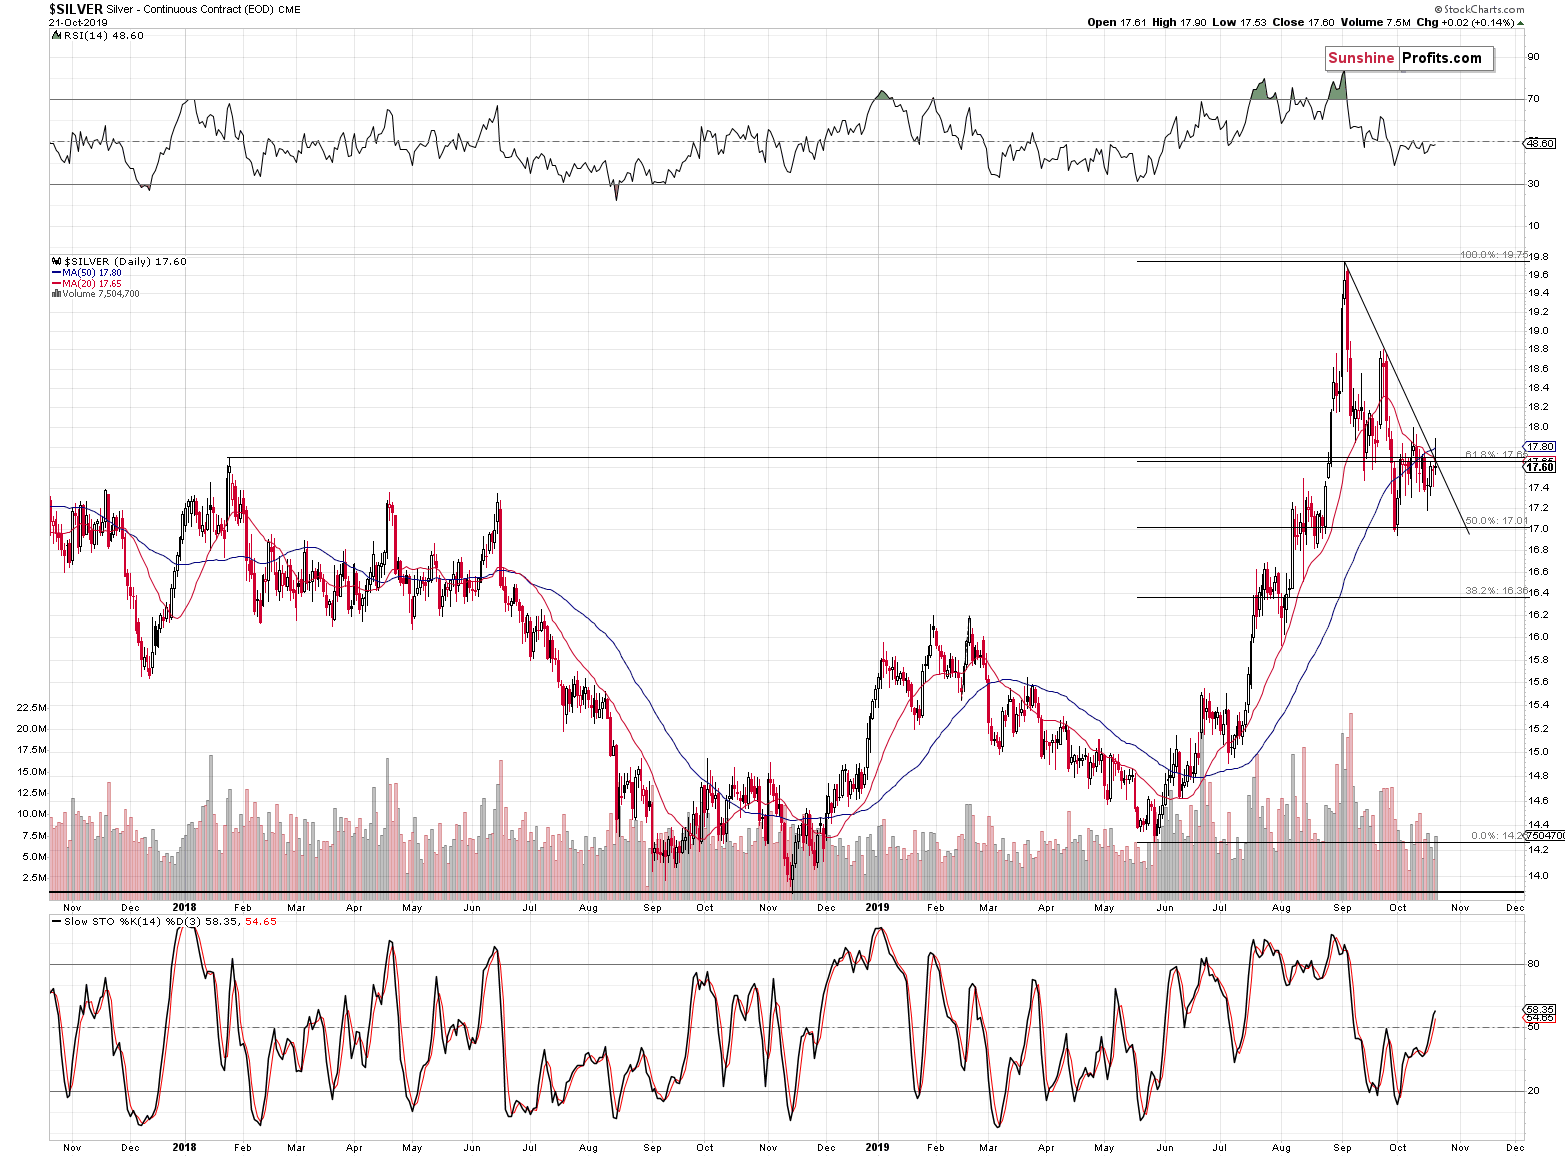
Despite the recent quick upswing, the white metal remains below the 2018 high. This might not be obvious at first sight, because the May - August rally makes everything appear more bullish than it should. We added a horizontal line on the chart (please feel free to click it to expand it) to make it clear that the current price and the price of the 2018 high are practically the same. And the late-September decline invalidated the earlier breakout above it. This is another bearish indication - not a very strong one, but still one, nonetheless.
The 50-day moving average (red) just declined below the 200-day moving average (blue), which is a classic sell sign, known as the "death cross". It sounds quite scary, but in reality both: the death cross and its opposite - the golden cross, are patterns that are ineffective in case of gold and silver. The above links provide explanations for gold, but just looking at the above chart can tell you that quite often these indications work in the opposite to how one might think. The classic example would be buying silver in April 2018, when the red line rallied above the blue line when silver soared. And that was practically the top. In March 2019, the red line moved below the blue line which marked the end of a short-term decline - meaning that the death cross actually had bullish implications in the short run. In July 2019, the golden cross meant... a local top and a short-term decline in the following days.
We saw the death cross several days ago and... Silver rallied shortly thereafter. What does it mean right now? It means that silver is likely to decline anyway, but not because of the death cross. And the rally that the death cross might have actually (falsely) indicated seems to be already over given yesterday's reversal.
Having said the above, let's take a look at what gold and mining stocks did yesterday.
The Short-Term in Gold and Miners
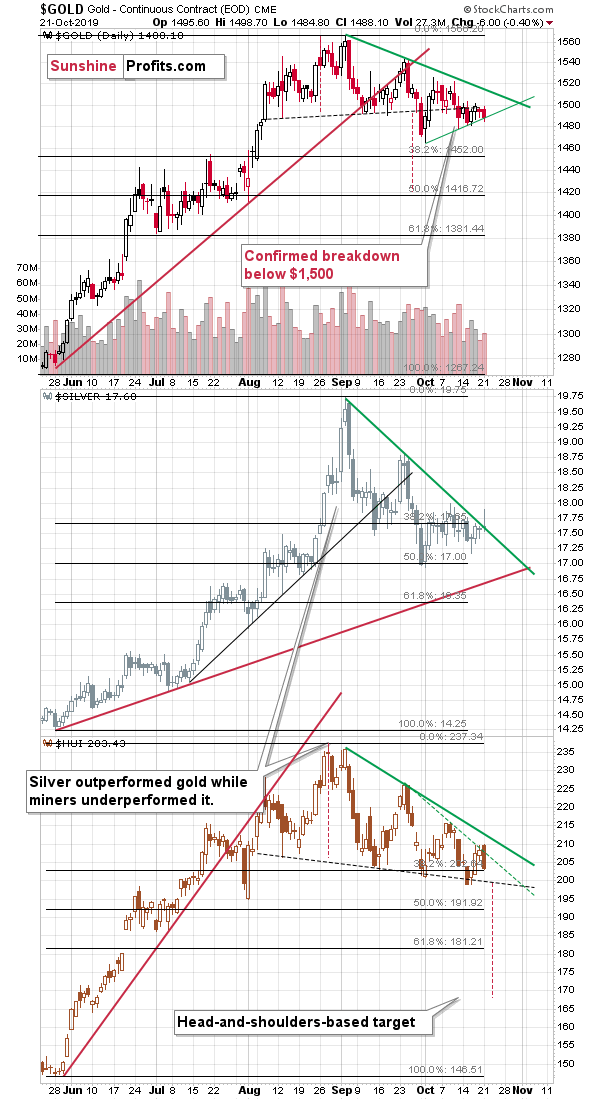
In short, they both declined, and yesterday's closing price was one of the lowest closing prices that we saw this month. Of course, gold remained below $1,500 and the GDX ETF moved lower, quickly invalidating the tiny breakout above the declining dashed green resistance line.
This all confirms the bearish outlook for the short term. Especially, when one considers what the USD Index has been doing.
USD Index Marginally Higher Yesterday
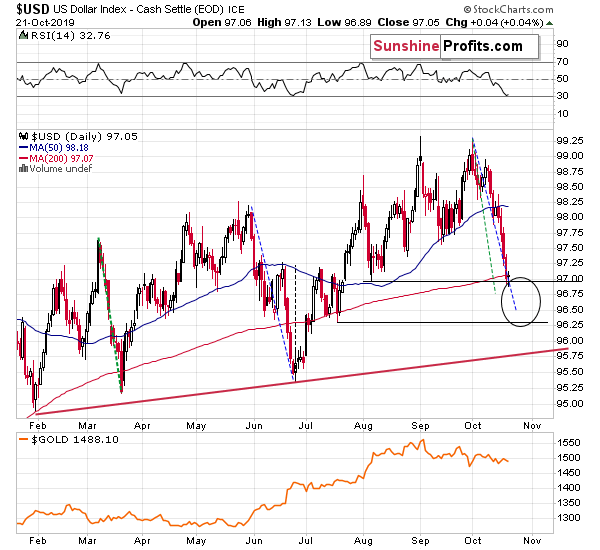
When the USD Index had been declining in the previous days, the precious metals sector moved higher just a little, mostly ignoring USD's slide. However, it took just a 0.04 rally in the USDX for gold and mining stocks to decline. Surely, the latter's decline was not profound at its face value but compared to the next-to-nothing 0.04 move up in the USD Index, gold's and miners' reaction was really big.
Gold's magnifying USD's bearish signals, while mostly ignoring USD's bullish signals. And the USD Index is most likely either done declining or almost done. This is a significantly bearish combination for the precious metals.
Naturally, the other key bearish factors for the medium term remain intact.
Key Factors to Keep in Mind
Critical factors:
- The USD Index broke above the very long-term resistance line and verified the breakout above it. Its huge upswing is already underway.
- The USD's long-term upswing is an extremely important and bearish factor for gold. There were only two similar cases in the past few decades, when USD Index was starting profound, long-term bull markets, and they were both accompanied by huge declines in gold and the rest of the precious metals market
- Out of these two similar cases, only one is very similar - the case when gold topped in February 1996. The similarity extends beyond gold's about a yearly delay in reaction to the USD's rally. Also the shape of gold price moves prior to the 1996 high and what we saw in the last couple of years is very similar, which confirm the analysis of the gold-USD link and the above-mentioned implications of USD Index's long-term breakout.
- The similarity between now and 1996 extends to silver and mining stocks - in other words, it goes beyond USD, gold-USD link, and gold itself. The white metal and its miners appear to be in a similar position as well, and the implications are particularly bearish for the miners. After their 1996 top, they erased more than 2/3rds of their prices.
- Many investors got excited by the gold-is-soaring theme in the last few months, but looking beyond the short-term moves, reveals that most of the precious metals sector didn't show substantial strength that would be really visible from the long-term perspective. Gold doesn't appear to be starting a new bull market here, but rather to be an exception from the rule.
- Gold stocks appear to be repeating their performance from 20 years ago, which means that a bottom in the entire precious metals sector is quite likely to form at much lower prices, in about a year
Very important, but not as critical factors:
- Long-term technical signs for silver, i.a. the analogy in terms of price to what we saw in 2008, shows that silver could slide even below $10.
- Silver's very long-term cycles point to a major reversal taking place right now and since the most recent move was up, the implications are bearish (this is also silver's technical sign, but it's so important that it deserves its own point)
- Long-term technical signs for gold stocks point to this not being a new gold bull market beginning. Among others, it's their long-term underperformance relative to gold that hint this is rather a corrective upswing within a bear market that is not over yet.
- Record-breaking weekly volume in gold is a strong sign pointing to lower gold prices
Important factors:
- Extreme volume reading in the SIL ETF (proxy for silver stocks) is an effective indication that lower values of silver miners are to be expected
- Silver's short-term outperformance of gold, and gold stocks' short-term underperformance of gold both confirm that the precious metals sector is topping here
- Gold topped almost right at its cyclical turning point, which makes the trend reversal more likely
- Copper broke below its head-and-shoulders pattern and confirmed the breakdown. The last time we saw something similar was in April 2013, when the entire precious metals sector was on the verge of plunging lower.
Moreover, please note that while there may be a recession threat, it doesn't mean that gold has to rally immediately. Both: recession and gold's multi-year rally could be many months away - comparing what happened to bond yields in the 90s confirms that.
Summary
Summing up, it seems that the corrective upswing in gold is over and that the yellow metal's big decline is already underway (and that it had started in August as we had written previously), and that it will resume shortly. The similarity to how gold stocks rallied and then declined about 20 years ago provides us with a specific time target for the decline in the entire precious metals sector - it's likely to take place for about 1 year from now. That's not particularly close, but the road lower that gold, silver, and miners are likely to take is not short either. The profits from the short position in gold, silver and mining stocks are likely to be legendary, but the difficult part is not to miss the decline. Fortunately, the pace of decline that we saw 20 years ago provides suggestions regarding when it might be worth to bet on the corrective upswing with one's trading capital and when it's better to wait it out. Based on the analogy to the above-mentioned decline, the next medium-term bottom might take place in about 2 months, in mid-December. There are additional indications pointing to a short-term reversal (likely a bottom) in early November.
At this time, it's unclear whether the target prices that we feature below are going to be reached in early November, mid-December or sometime between those dates. It seems much more likely than not that we won't have to wait beyond mid-December for the targets to be reached. The above-mentioned reversal dates are useful guidelines, but they are not clear rules. For instance, the bottom could take place at another date, and the reversal might actually mark the end of the corrective post-local-bottom upswing.
As always, we'll keep you - our subscribers - informed.
To summarize:
Trading capital (supplementary part of the portfolio; our opinion): F speculative short position (250% of the full position) in gold, silver, and mining stocks are justified from the risk/reward perspective with the following stop-loss orders and binding exit profit-take price levels:
- Gold: profit-take exit price: $1,391; stop-loss: $1,573; initial target price for the DGLD ETN: $36.37; stop-loss for the DGLD ETN: $25.44
- Silver: profit-take exit price: $15.11; stop-loss: $19.06; initial target price for the DSLV ETN: $24.88; stop-loss for the DSLV ETN: $14.07
- Mining stocks (price levels for the GDX ETF): profit-take exit price: $23.21; stop-loss: $30.11; initial target price for the DUST ETF: $11.69; stop-loss for the DUST ETF $6.08
In case one wants to bet on junior mining stocks' prices, here are the stop-loss details and target prices:
- GDXJ ETF: profit-take exit price: $31.62; stop-loss: $41.22
- JDST ETF: profit-take exit price: $24.88 stop-loss: $12.46
Long-term capital (core part of the portfolio; our opinion): No positions (in other words: cash)
Insurance capital (core part of the portfolio; our opinion): Full position
Whether you already subscribed or not, we encourage you to find out how to make the most of our alerts and read our replies to the most common alert-and-gold-trading-related-questions.
Please note that the in the trading section we describe the situation for the day that the alert is posted. In other words, it we are writing about a speculative position, it means that it is up-to-date on the day it was posted. We are also featuring the initial target prices, so that you can decide whether keeping a position on a given day is something that is in tune with your approach (some moves are too small for medium-term traders and some might appear too big for day-traders).
Plus, you might want to read why our stop-loss orders are usually relatively far from the current price.
Please note that a full position doesn't mean using all of the capital for a given trade. You will find details on our thoughts on gold portfolio structuring in the Key Insights section on our website.
As a reminder - "initial target price" means exactly that - an "initial" one, it's not a price level at which we suggest closing positions. If this becomes the case (like it did in the previous trade) we will refer to these levels as levels of exit orders (exactly as we've done previously). Stop-loss levels, however, are naturally not "initial", but something that, in our opinion, might be entered as an order.
Since it is impossible to synchronize target prices and stop-loss levels for all the ETFs and ETNs with the main markets that we provide these levels for (gold, silver and mining stocks - the GDX ETF), the stop-loss levels and target prices for other ETNs and ETF (among other: UGLD, DGLD, USLV, DSLV, NUGT, DUST, JNUG, JDST) are provided as supplementary, and not as "final". This means that if a stop-loss or a target level is reached for any of the "additional instruments" (DGLD for instance), but not for the "main instrument" (gold in this case), we will view positions in both gold and DGLD as still open and the stop-loss for DGLD would have to be moved lower. On the other hand, if gold moves to a stop-loss level but DGLD doesn't, then we will view both positions (in gold and DGLD) as closed. In other words, since it's not possible to be 100% certain that each related instrument moves to a given level when the underlying instrument does, we can't provide levels that would be binding. The levels that we do provide are our best estimate of the levels that will correspond to the levels in the underlying assets, but it will be the underlying assets that one will need to focus on regarding the signs pointing to closing a given position or keeping it open. We might adjust the levels in the "additional instruments" without adjusting the levels in the "main instruments", which will simply mean that we have improved our estimation of these levels, not that we changed our outlook on the markets. We are already working on a tool that would update these levels on a daily basis for the most popular ETFs, ETNs and individual mining stocks.
Our preferred ways to invest in and to trade gold along with the reasoning can be found in the how to buy gold section. Additionally, our preferred ETFs and ETNs can be found in our Gold & Silver ETF Ranking.
As a reminder, Gold & Silver Trading Alerts are posted before or on each trading day (we usually post them before the opening bell, but we don't promise doing that each day). If there's anything urgent, we will send you an additional small alert before posting the main one.
=====
Latest Free Trading Alerts:
Boris Johnson struggles to push the Brexit agreement through the British Parliament. For it can bite back! Who wins this battle? One could hope that gold, but this is not so certain...
The Duel Between Johnson and Parliament. Will Gold Win?
=====
Thank you.
Sincerely,
Przemyslaw Radomski, CFA
Editor-in-chief, Gold & Silver Fund Manager

